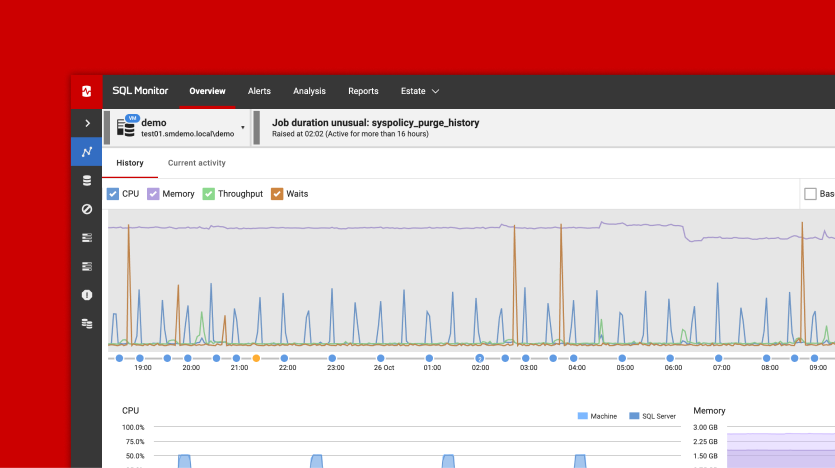
Avoid paying for unused CPU power, on-prem or in the cloud. This guide shows how to use Redgate Monitor to identify overprovisioned SQL Server VMs, reduce licensing and compute costs, and ensure your workloads still run smoothly. Read more
This article explores PostgreSQL's buffer cache hit ratio (BCHR), a metric tracked by Redgate Monitor to help you assess the health and performance of your databases. By correctly interpreting this ratio and using it with other relevant memory and IO metrics, you can identify potential bottlenecks in query execution before…Read more
This article demonstrates how Redgate Monitor helps teams manage database incidents efficiently, by providing the right data to the right people, at each stage of a tiered incident response system. With fewer distractions from routine issues, specialist staff can focus on core tasks while teams resolve problems faster and prevent…Read more
When processing a query in PostgreSQL that requires more memory than it's configured to allocate, data will be spilled to disk to complete the query operations. This can introduce performance bottlenecks. Redgate Monitor now includes recommendations for PostgreSQL that warn you when a spill occurs and will help you understand…Read more
This article demonstrates how to use a script notification, in PowerShell, to automatically send database alerts raised by Redgate Monitor as incidents to New Relic. This simple integration makes it easy to feed the detailed diagnostics that only a specialized database monitoring system such as Redgate Monitor provides, and the…Read more
For SQL Server 2019 onwards, Redgate Monitor can now show the actual execution plan, complete with runtime statistics, for expensive queries that were running over any period of investigation. This means you'll not only know how SQL Server executed your poorly performing query but also see accurate runtime data. Any…Read more
Redgate Monitor provides detail-level diagnostic data that will allow an expert to drill down to establish the cause of, and a fix for, any database problem. However, with support for webhooks, it can also contribute alerts to the sort of "Tier 1" alerting and paging system that an operations team…Read more
This article describes six performance metrics that ought to be central to your PostgreSQL monitoring strategy. By using a tool like Redgate Monitor to track these metrics over time, and establish baselines for them, you'll be able to spot resource pressure or performance issues immediately, quickly diagnose the cause, and…Read more
Redgate Monitor's Top procedures list makes it simple to find the procedures having the biggest impact on performance, allowing you to prioritize your tuning efforts, reduce risk and keep pace with the requirements of your growing database estate.Read more