


Cloud Database Cost Optimization with Redgate Monitor
If you're running SQL Server, Oracle, or PostgreSQL in AWS or Azure, there's a good chance your cloud bill is bigger than it needs to be. On premises, we sized for headroom because hardware refreshes were painful and expensive, especially if they went wrong. Without a proper workload assessment, that same instinct applied to cloud provisioning can leave you paying every month for capacity you rarely use, or it will allow a small number of expensive queries or batch jobs to push costs up disproportionately.
I've spent the best part of two decades moving databases into the cloud, and if there's one question that comes up a lot, it's cost. Pre-migration, that usually means, “How much is the cloud going to cost us?” Once the monthly bills start arriving, this quickly becomes, “Why is it costing us so much, and what can we do about it, without breaking anything?”
This post is my attempt to answer that properly, using a methodology I've used with customers directly, backed by Redgate Monitor.
Why cloud cost management deserves your attention
Cloud cost management has become an urgent concern for database teams, and the data backs up what I'm hearing from customers and peers. Redgate's 2026 State of the Database Landscape report found that 87% of organizations are actively monitoring cloud costs, rising to 92% among large enterprises. But watching the total isn't the same as understanding it: only 55% have analytics that link cost spikes directly to workload performance, and two-thirds of those without that visibility say they want it. That's the gap I run into constantly. Everyone can see the bill. Far fewer can see which parts of the workload are driving the costs, or why they have suddenly increased.
The same report found that cost management is still the single most-cited cloud challenge overall, reported by 51% of organizations, though that's down from 63% in 2025, so there is progress being made. One reason the problem persists is that responsibility for cloud costs is often spread across finance and procurement teams (38%) and operations teams (35%), with a dedicated cost management role in just 21% of organizations. When ownership is that fragmented, no one person has both the full picture and the day-to-day ability to act on it.
Too many teams treat cloud migration as a "one and done" project. They complete the migration, check that the workload is operating smoothly, and then move on. That can lead to a sizeable shock when the first cloud bill lands. Cloud usage and workloads change continuously, and costs can rise quickly with them, especially in hybrid environments with more complex storage and data transfer requirements.
Hybrid is now the normal operating model
Redgate's 2026 State of the Database Landscape research found that managing a hybrid environment, with a mix of on-prem and cloud workloads, has become the permanent operating reality for 43% of organizations, not a temporary staging post on the way to being fully cloud native.
Finance teams tend to think in monthly or quarterly cycles; cloud spend doesn’t respect that cadence. I’ve seen a feature switched on and become a five-figure surprise by the end of the same week.
Managing costs must become a daily habit for the people closest to the workload, not a quarterly retrospective for finance.
A quick word on FinOps
If you haven't come across the term, FinOps brings financial accountability to the variable spend model that cloud gives you. It's easy to file this away as something that belongs to the finance team, or as a box to tick once the migration project is closed out. It's not: it is an ongoing discipline of continuously balancing performance, capacity, and cost, as usage patterns and pricing models shift underneath you.
The important question here is where developers, DBAs, and operations teams fit into that picture. Operations teams can see the technical drivers of cost, whether that is over-provisioned instances, sustained I/O spikes, or batch jobs causing contention. However, Redgate's Cloud Migration Divide research, an AWS-focused extension of the 2026 report, found that fewer than half had visibility into how those problems translated into cloud costs, compared with three-quarters of senior leaders.
If you work in development, database administration, or operations, you have significant influence over cloud costs, whether that responsibility has been made explicit or not. Every query or index you tune, and every instance you right-size, has a direct line to a number on the invoice. If you record these changes and can link them directly to the savings that resulted, you make clear what caused costs to fall and help leadership better understand the value of your work.
This shared visibility is what turns FinOps from a finance initiative into something the whole organization practices.
The End of Abundance in Tech by Ben DeBow is a book I recommend people read to understand the 'what and why' of FinOps.
The monitoring methodology: a three-part triage
When I assess an estate, whether it consists of VMs, Azure SQL Database, Managed Instance, Amazon RDS, or Amazon Aurora, I start by dividing the systems into three groups. The aim is to identify those servers that are clearly over-allocated, those where tuning can unlock savings, and those where reducing costs will require more substantial engineering work.
It's a deliberately simple triage, because not every server needs the same amount of effort, and knowing which bucket a server is in saves a lot of wasted time.
I’m often called in to do this work only after the cost alarm has been raised. But with this methodology and Redgate Monitor, which brings resource usage, workload performance, and cloud costs into the same view, teams can start this work much earlier and make better-informed decisions during migration planning. If developers are given read-only access to the same monitoring data, it can even start while new features are being built.
1. JFDIs: clear over-allocation
These are the servers where the allocated resource and the resource being used seem almost unrelated. A VM with 16 vCPUs that never troubles 20% utilization. An Azure SQL Database provisioned several service tiers above what its DTU or vCore consumption ever demands, or an Amazon Aurora cluster with multiple reader nodes, which are dramatically underused.
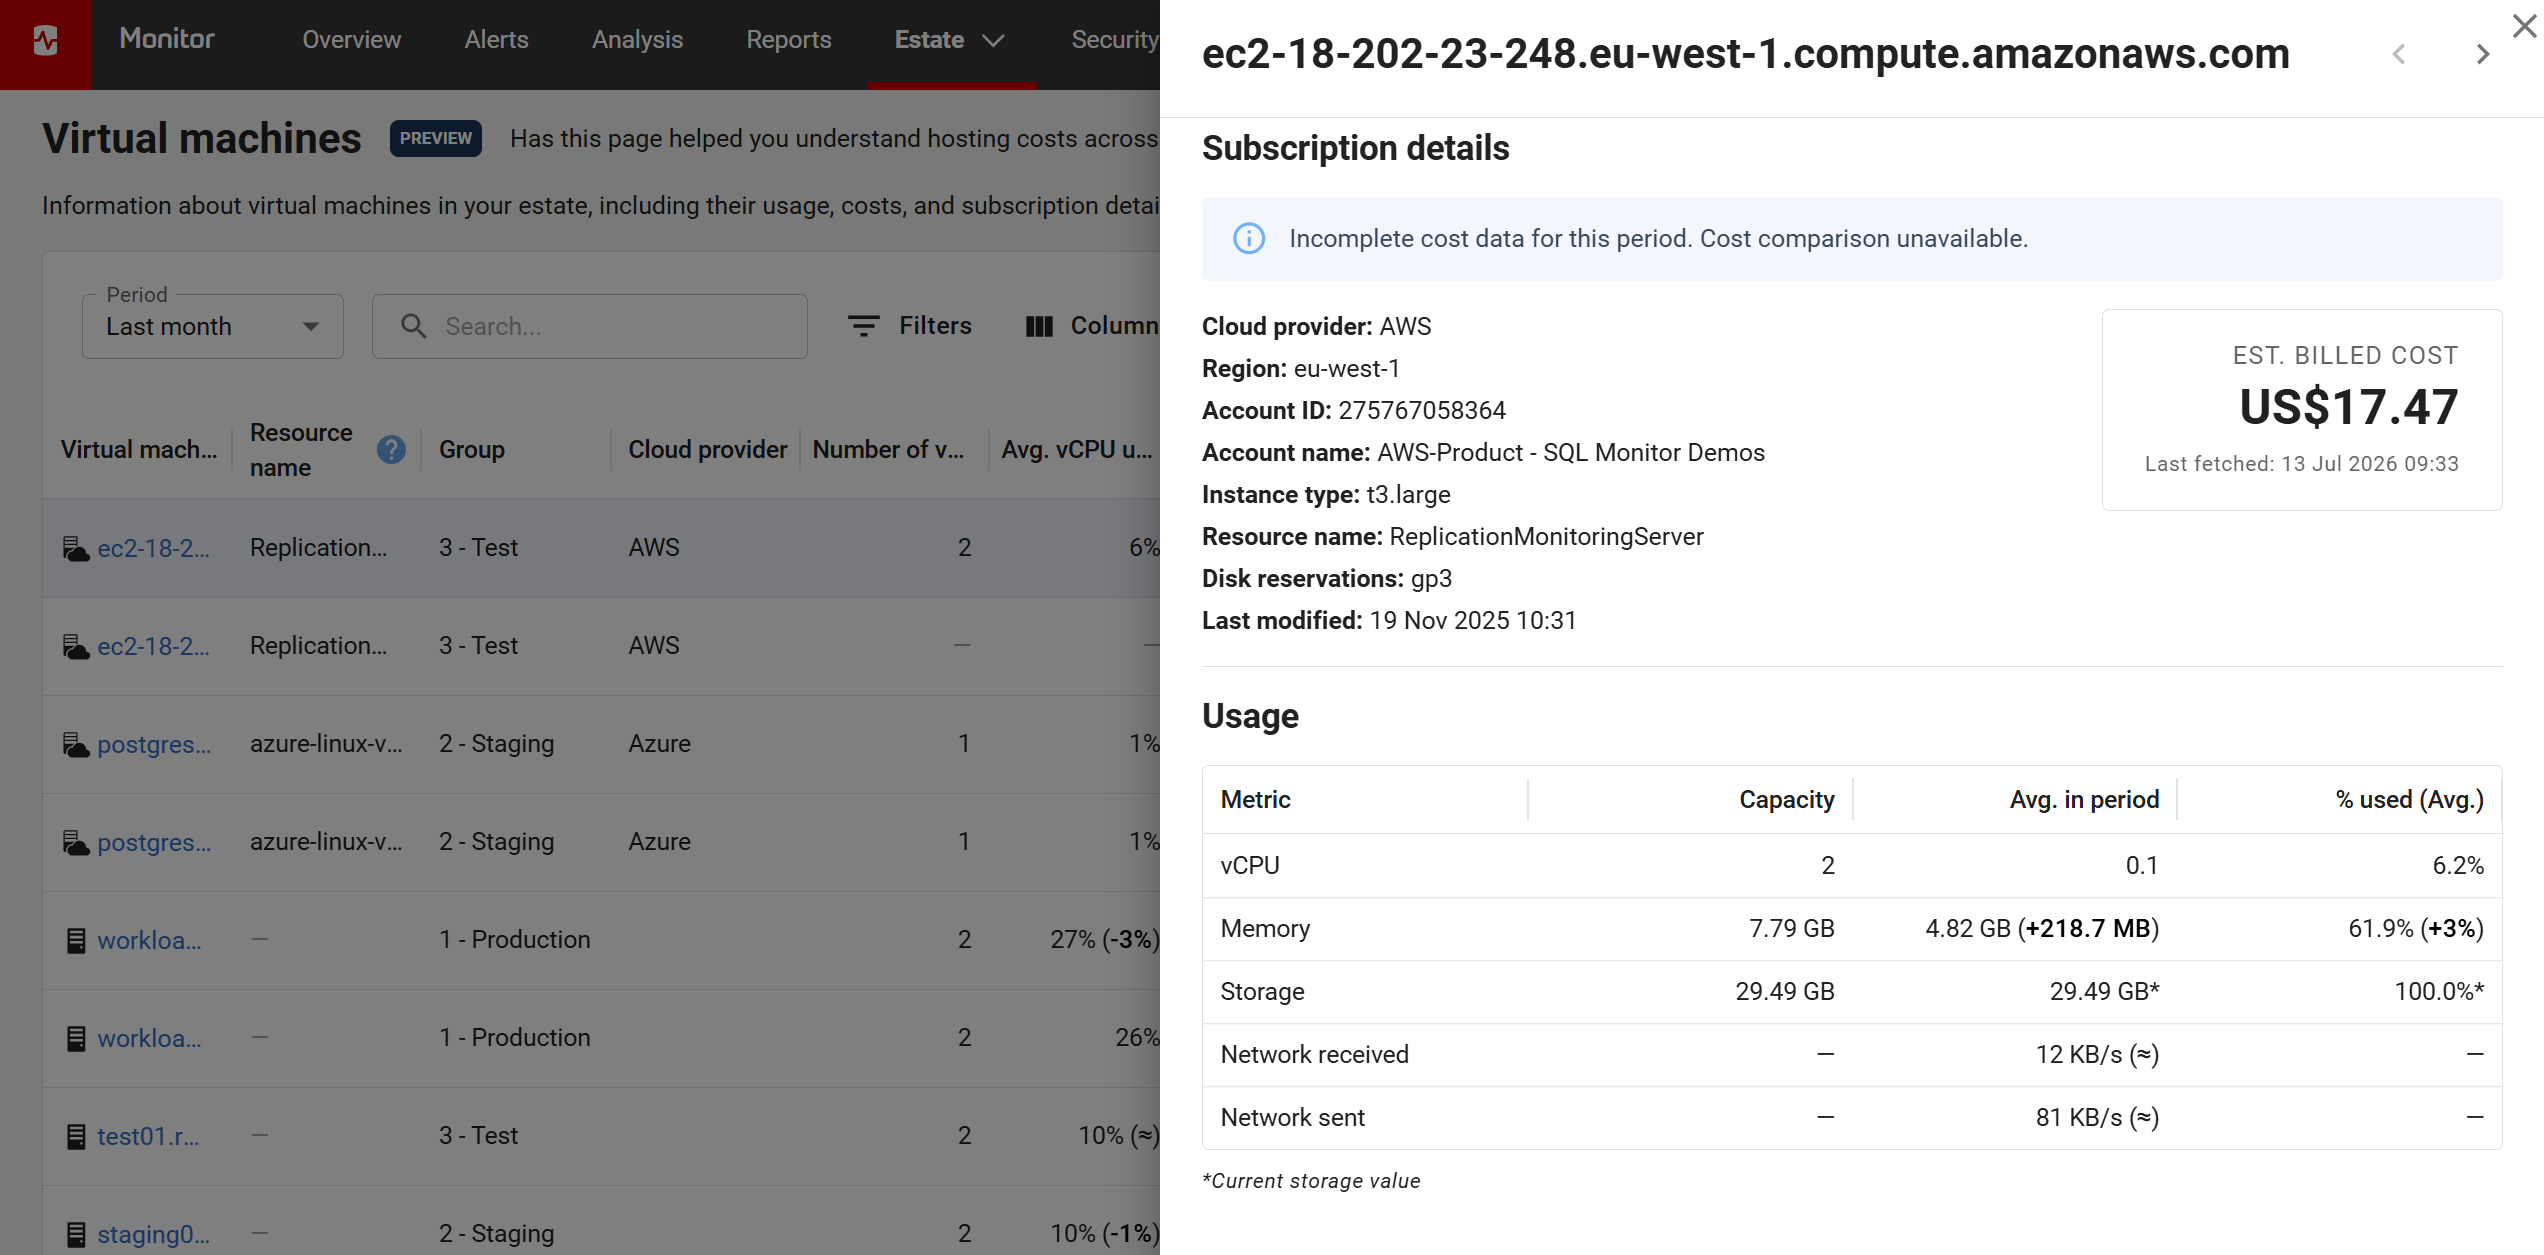
For VM-hosted estates, Redgate Monitor's Virtual Machines page is where I start. It lays out allocated versus used vCPU, memory, and storage for every machine, in one view. It lets you drill into an individual machine's charts to check that the low utilization isn't hiding an occasional but legitimate spike.
For managed services, the equivalent view comes from either the server/host dashboards on the Overview tab, or by using the Analysis tab, where you can build out custom visualizations and export the data. This lets you review CPU, memory, and elastic pool utilization over time for Azure SQL Database, or use the resource dashboards for RDS and Aurora instances.
If the ceiling and the actual usage are consistently a long way apart, that's an easy win: move to a smaller instance class or service tier and make the saving.
2. Quick wins: query optimization unlocks the downsize
This group looks over-provisioned at first glance, but when you dig in, the allocation is driven by a handful of expensive queries or a batch job that spikes resource use for a short window each day or week. You can't just shrink the instance, without causing contention during those periods, and affecting the performance of the whole workload. However, you can optimize the queries, or re-schedule the jobs causing the spike, which often gives you the headroom to right-size safely.
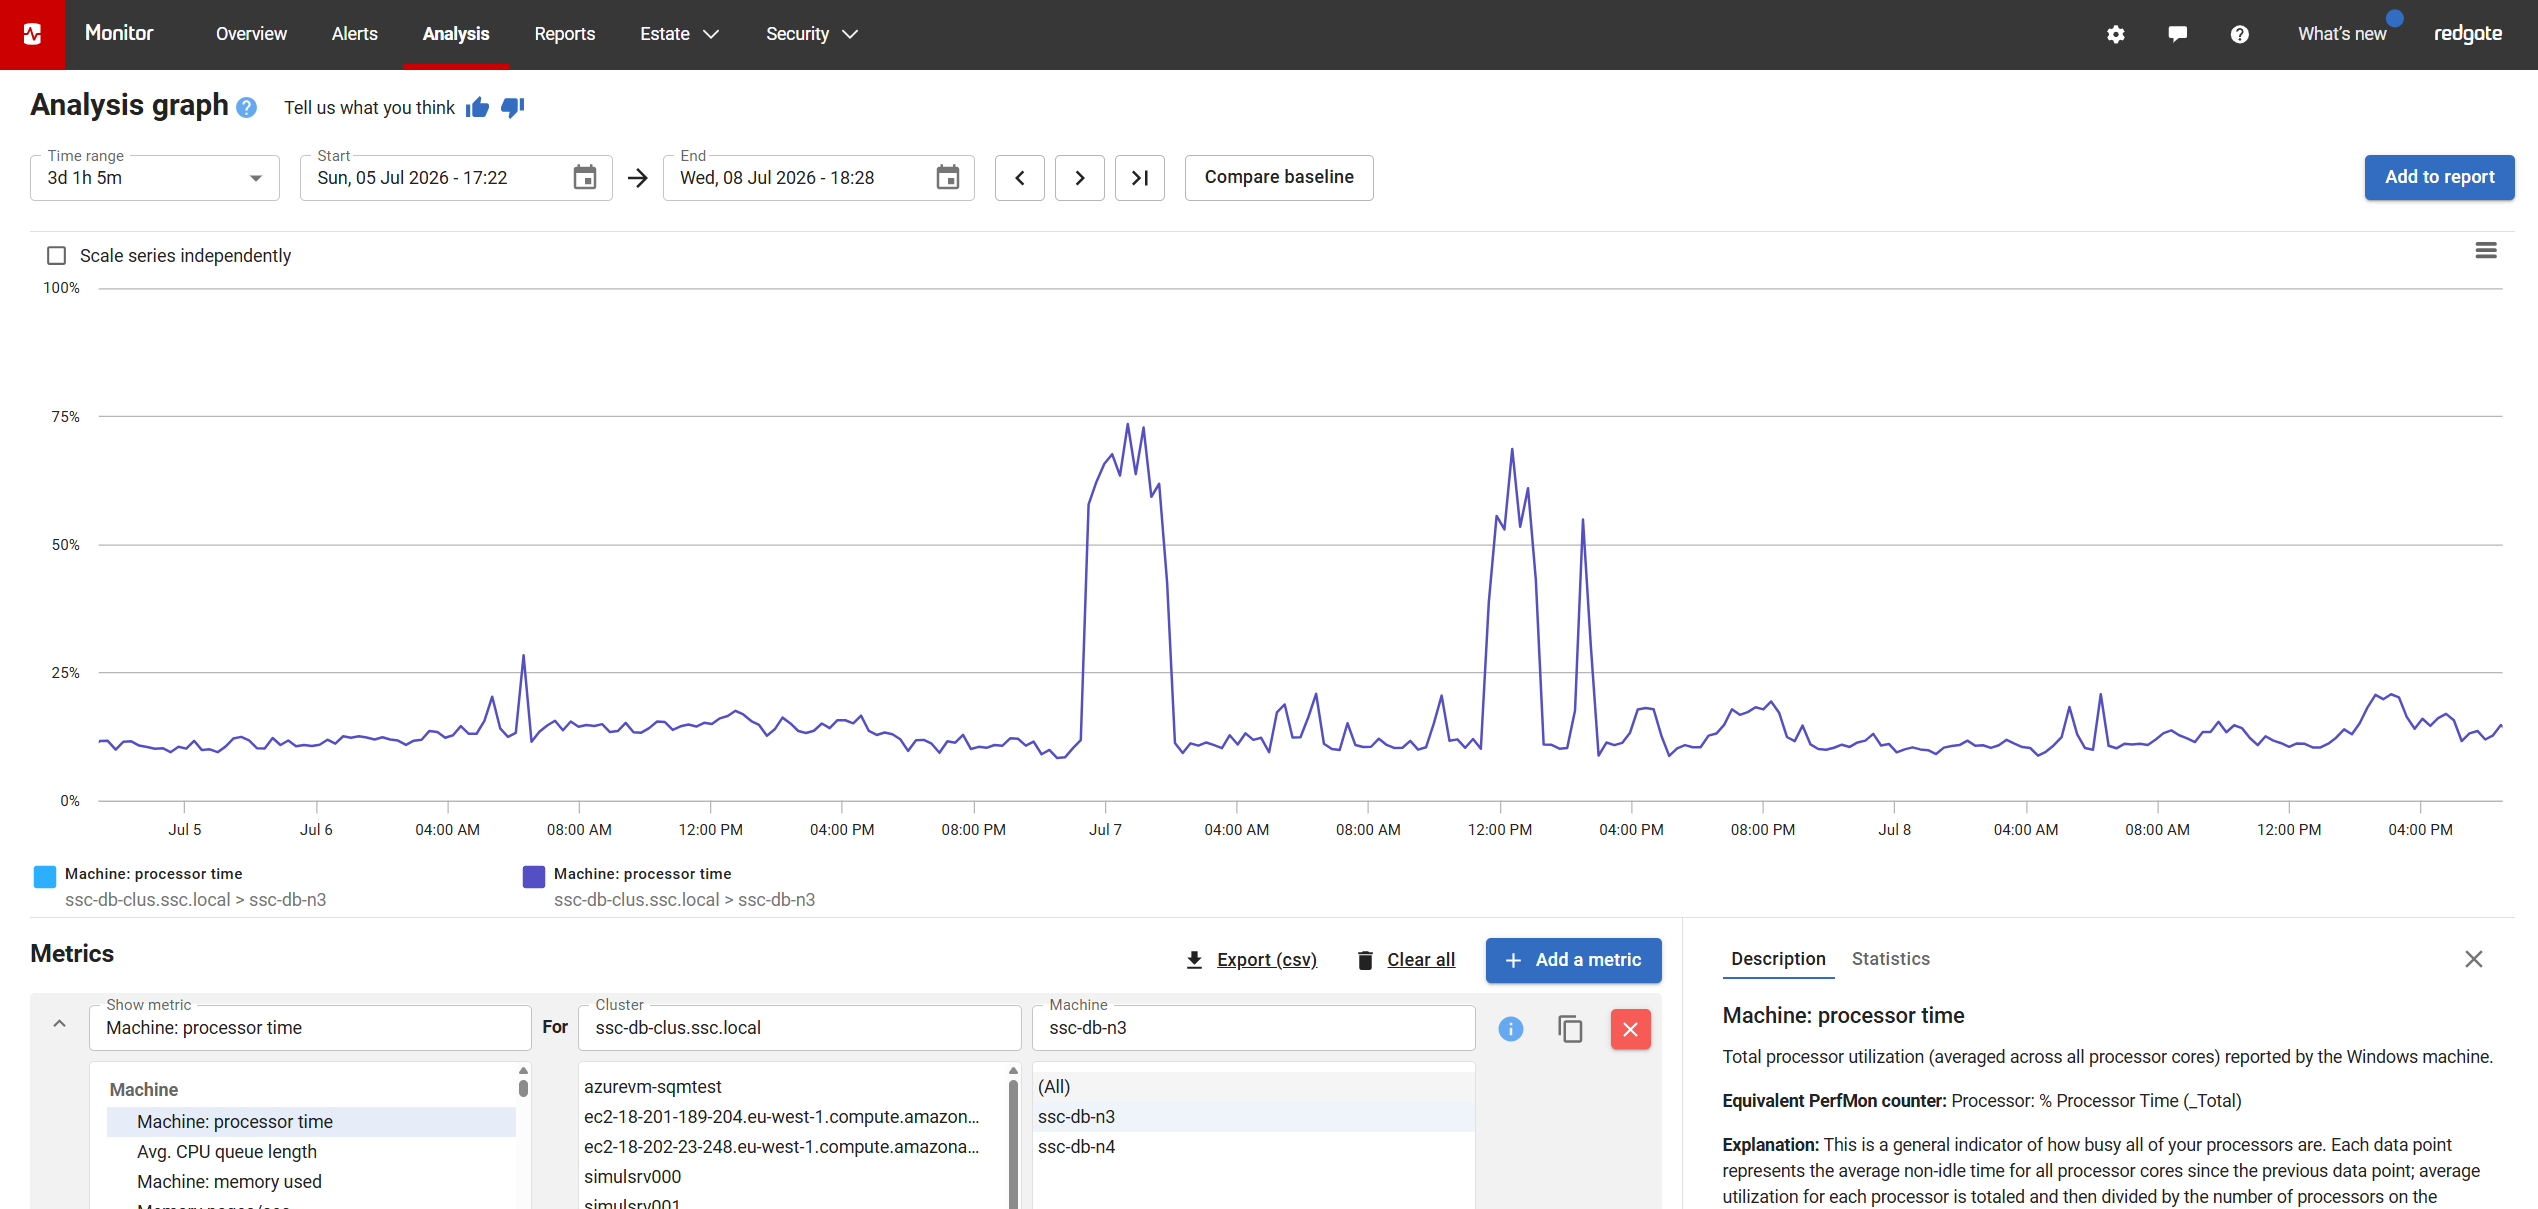
This is where Monitor's query and analysis views make life a lot easier: sort by duration or CPU time to find the big hitters, then track the same query's performance over time as you tune it. Once you have reduced the spike enough that the workload no longer depends on the higher level of capacity, you can safely move to a smaller instance. The following graphic shows a case where CPU utilization is low for most of the period but rises sharply during several workload peaks. If the queries causing these spikes can be tuned, the instance can be safely downsized.
One important consideration when tuning queries is parallelism. A query may use several CPU threads at once, so reducing the number of cores can affect its performance even if overall CPU utilization looks low. Any proposed downsize therefore, needs to be tested against the workloads that rely on parallel execution.
3. Challenging situations: the workload itself needs work
Some workloads simply won't right-size without substantial engineering effort. It may be a monolithic database that has grown to support too many functions and needs decomposing, so parts of the workload can move to smaller database services or a more appropriate platform. Or it may be a legacy application design that creates far more I/O or contention than necessary.
There's no shortcut here, and I'd rather tell a customer that up front than pretend otherwise. What Monitor gives you in this scenario is the evidence base: the query patterns, the wait statistics, the resource trends, that let you build a proper case for the refactoring work and then measure whether the work delivers the expected improvement.
What to measure, and why it isn't just CPU and memory
Here's the bit I think gets misunderstood most often: when you're deciding how far you can safely right-size, resource usage and performance are related, but they are not the same thing. You need to measure both.
Resource consumption metrics such as CPU, memory, I/O, and network usage show you how much of the available capacity the workload consumes. That is essential for spotting obvious over-allocation and easy tuning "wins". But these metrics alone don't tell you whether your customers are happy with the system performance.
For that, you also need to track both throughput metrics (transactions per second, batch requests per second) and query and application response times. These are the measures that tell you what service performance looks like, both before and after a change, regardless of the underlying infrastructure or service tier.
The practical approach is straightforward: before you touch anything, establish a baseline for both resource usage and workload performance metrics. Make the change and then compare the same measures afterwards. If throughput and response times remain within the range the business requires, the change has been successful. If performance deteriorates beyond what users will tolerate, you have gone too far and can size back up based on evidence rather than guesswork.
The target you're aiming for is a Cloud instance that has as little over-allocated capacity as possible, while still comfortably absorbing your workload's genuine usage spikes.
The method in action: how one customer uncovered $150k in savings
I recently worked with a large insurance group, headquartered in the UK but with operations spanning multiple regions. They were partway through evaluating Redgate Monitor when a change in their finance leadership put every new purchase under scrutiny. The message from their new CFO was blunt: unless it demonstrably saved money, it wasn't happening.
The DBA team already understood the day-to-day operational value of Monitor, but they did not have the hard numbers that finance wanted. So, during a call with the customer, a colleague and I opened the Virtual Machines page in their own environment and began working through the estate with them. Within twenty minutes, we'd identified around $20k in potential annual savings from over-provisioned VMs. That was enough to make the ROI conversation concrete rather than theoretical, and the team then extended the method to the rest of the estate.
By reviewing their twenty highest-cost servers, they identified roughly $50k in annual savings from right-sizing just six over-provisioned VMs, including savings in both compute and SQL Server licensing costs.
They then did something I'd encourage anyone in this position to try: they extrapolated. Six of the twenty servers were over-provisioned, with an average potential saving of around $8.5k each. They had another forty similarly high-spec servers sitting in a second region. Applying that same hit rate suggested a further $100k or more in potential savings, before they had even examined the long tail of smaller servers across the estate. All told, the identified opportunity came to more than $150k.
That's the "top 20 servers" approach in a nutshell: it's fast, it's focused, and it produces numbers a CFO can act on without needing a full estate analysis first. The business case came together quickly once it had real evidence behind it, and the stalled purchase went ahead.
Wrapping up
Managing cloud database costs isn't a project you finish and move on from. It's a discipline, and like most good disciplines, it works best when it's built on evidence rather than instinct. In this case, the evidence is the knowledge of how resource usage, workload performance, and cost relate to one another over time and in response to change.
Sort your database estate into clear over-allocation, tuning opportunities, and the workloads that need more substantial engineering work. Measure performance alongside resource usage and size for genuine peaks rather than averages.
Ultimately, the decision comes down to the price-performance trade-off: how much are you willing to pay for the level of performance you are happy to accept? This is something that really resonated with me when I was working at AWS because it shifted the discussion away from CPU core counts, node counts, and memory, and towards the outcome of those choices: how effectively the system serves its users and the organization. It can help make people more open to understanding what they need rather than what they want.
Redgate Monitor brings the resource and workload data needed for this assessment into one place, helping teams identify where capacity can be reduced safely and where tuning needs to come first. You can explore the same approach with a free 14-day trial. Point it at your VMs, your Azure SQL Databases, your Managed Instances, or your RDS and Aurora instances, and start by examining what "allocated-versus-used" looks like, for servers across your estate.
Start your free trial of Redgate Monitor.
This document contains proprietary information and is protected by copyright law.
Copyright © 2026 Red Gate Software Limited. All rights reserved
Tools in this post
Redgate Monitor
Real-time multi-platform performance monitoring, with alerts and diagnostics
You may also like

Article
Monitoring Changes in Permissions, Users, Roles and Logins
Phil Factor uses the default trace and a Redgate Monitor custom metric to alert you to unauthorized changes in security membership or permissions in any of your monitored databases.
Article
Redgate's support for Azure SQL Database Managed Instances
Today Microsoft released the public preview of Azure SQL Database Managed Instances – an exciting new option for running SQL Server workloads in the cloud. I’m pleased to say that initial support for this new offering is already available across the development tools in Redgate’s SQL Toolbelt, as well as in Redgate Monitor. This support will continue to improve as the platform evolves throughout its public preview. What are Managed Instances? Managed Instances (or Azure SQL Database Managed Instances, to give them the long name) are a new PaaS database offering, joining the Azure SQL Database and Elastic Pool services.
Article
Database Monitoring for Developers
Database monitoring is an essential part of database development and testing because it will reveal problems early and allow you to drill down to the root cause, as well as look for any worrying trends in behavior of the database, when under load. If you are delaying doing this until a database is in production, you're doing it wrong.
Article
Tracking Queries in Redgate Monitor
Redgate Monitor v12.1.28 has added functionality to track queries. This blog post will outline what this does and how it works. What is a tracked query? Tracked queries is a new feature on the Server Overview page for Redgate Monitor. It was added in preview in Redgate Monitor v12.1.28. This feature allows you to mark a query you are interested in as tracked to ensure we continue to sample data for the tracked query and to make it easier to find in the future. Why should you track queries? The ability to track queries is a powerful tool for users
Article
Migrating Between Monitoring Systems
This question comes up all the time: How do you migrate between monitoring systems? The answer is both simple and complicated. In order to understand this better, rather than just rely on my own knowledge, I reached out to a number of people to see how they accomplished this. I’m going to summarize their process for you here in order to help others who may find themselves in need of this information. Don’t Migrate The Data One of the first things I would have thought about when someone says the word “migrate” would be the need to move the data
Live training session
Redgate Monitor: All About Alerting - Set Up & Strategy for Success
Join us for a session with Solution Engineer and former Redgate Monitor Product Manager, Laura Copeland for a session on the best practices upon initial installation, maintenance, and optimization of alerts in Redgate Monitor.
Loading comments...