Security and compliance
Ensure data security and compliance with data masking, monitoring, and change traceability
Ensure data security and compliance with data masking, monitoring, and change traceability
Monitor and understand your databases with full visibility into performance and change
Build, test, and deploy database changes with confidence
Simplify and speed up database development workflows
Prepare reliable data foundations for AI initiatives
Simplify and secure database modernization across platforms
Control costs and boost efficiency in database operations
Simplify and speed up cloud database transformation
Multi-platform database observability for your entire estate. Optimize performance, ensure security, and mitigate potential risks with fast deep-dive analysis, intelligent alerting, and AI-powered insights.

Redgate Monitor helps you manage your entire database estate from a single pane of glass. Monitor SQL Server, PostgreSQL, Oracle, MySQL, and MongoDB – on premises, in the cloud, or in hybrid environments. Get database observability to proactively mitigate potential risks with instant problem diagnosis and customizable alerting. No downtime, customer complaints, or wake-up calls at 3am.
Benefits
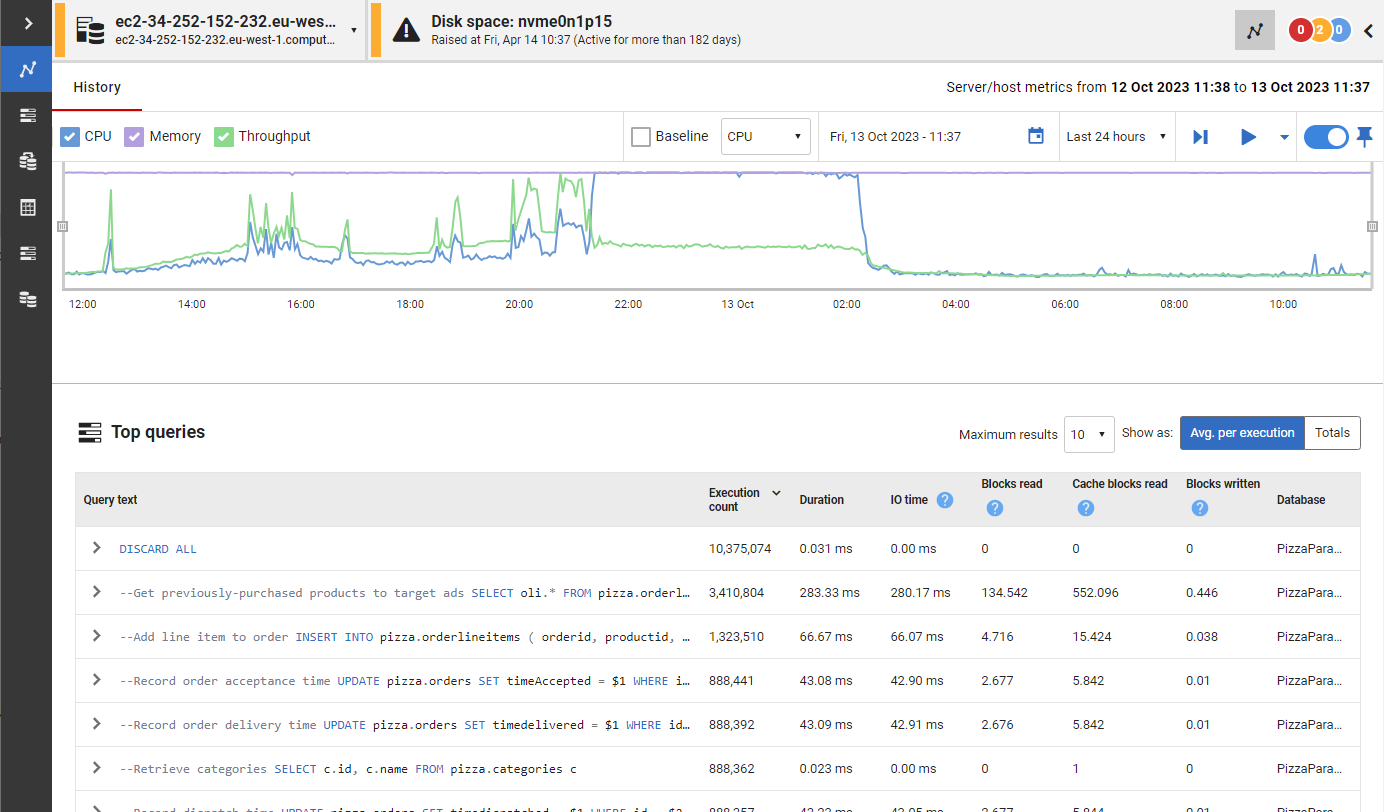
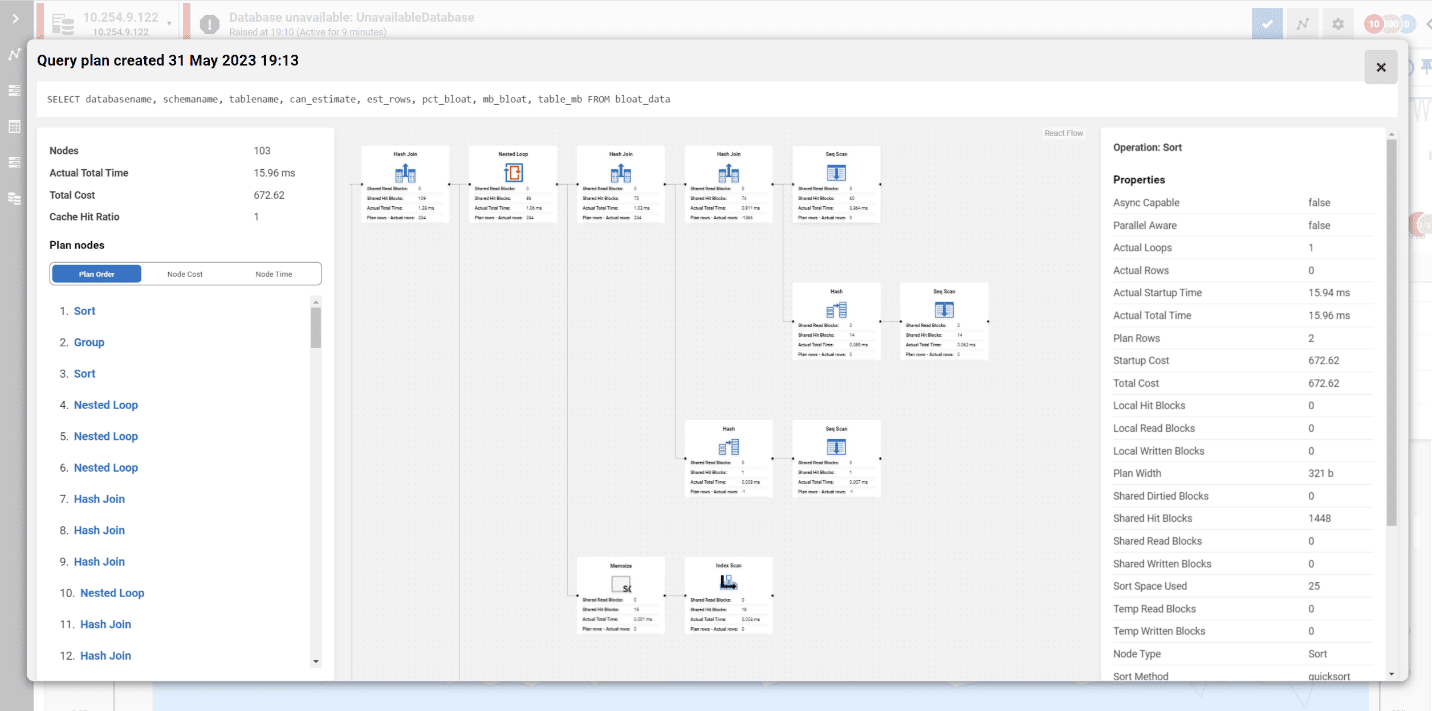
Redgate Monitor accelerates daily database maintenance by automating time-consuming tasks, such as identifying long-running queries or tracking blocked processes. Now equipped with Monitor AI, you can instantly surface performance bottlenecks and tune queries faster – without the manual effort. This frees up time to proactively improve the performance and security of your servers while ensuring your monitoring solution evolves as your challenges do.
Whether your databases are hosted on-premises, in the cloud or a mixture of both, with instant problem diagnosis and customizable alerts you have the answers to the health of your estate at your fingertips. Drill down into potential issues and solve them before they become a problem.
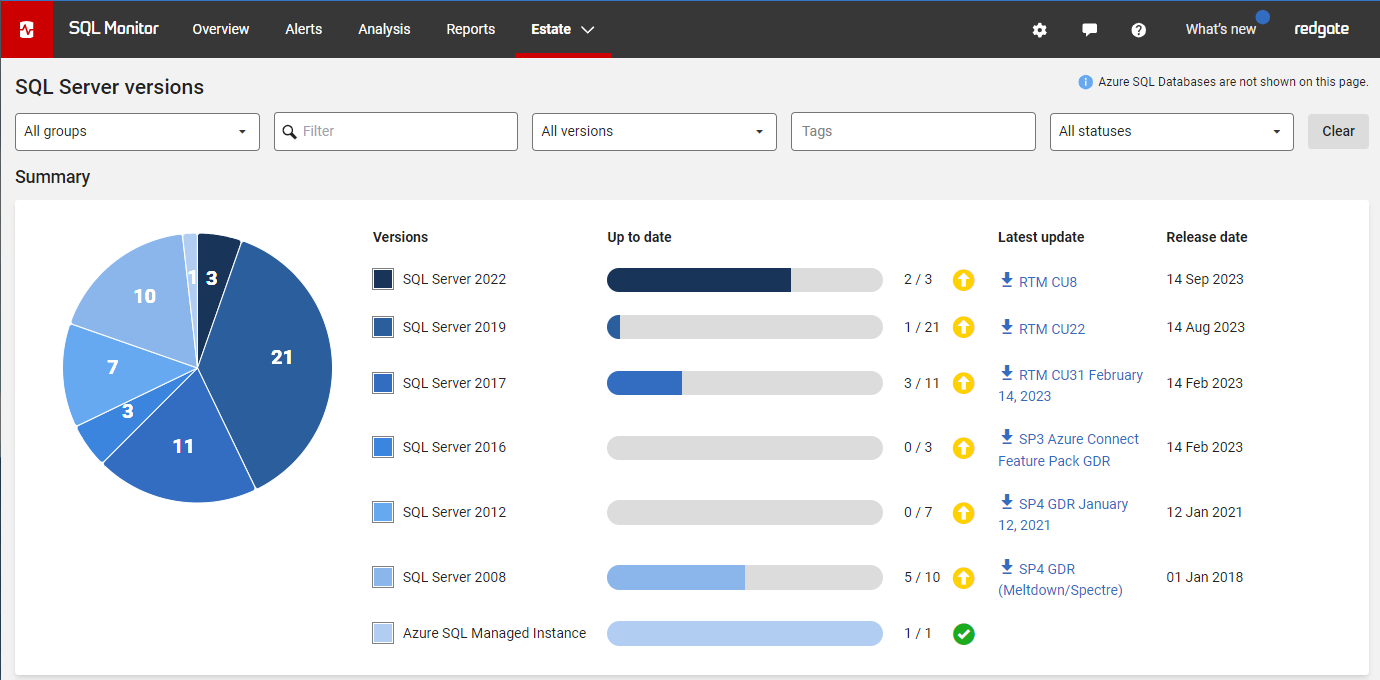
Redgate Monitor grows and adapts with your server estate, offering the scalability to support your complex, multi-platform environment. Regardless of where your servers are hosted, consistent monitoring for on-prem and cloud databases means you can manage your entire environment from a single pane of glass – giving you the agility to respond quickly as things change. Stay on top of configurations, access rights, installed versions and patches, licensing, disk usage statistics, backups and more – all in one place.
Try the live environment to see how Redgate Monitor works right away
Try the online demoSQL Server, PostgreSQL, Oracle, MySQL, and MongoDB – all in one place.
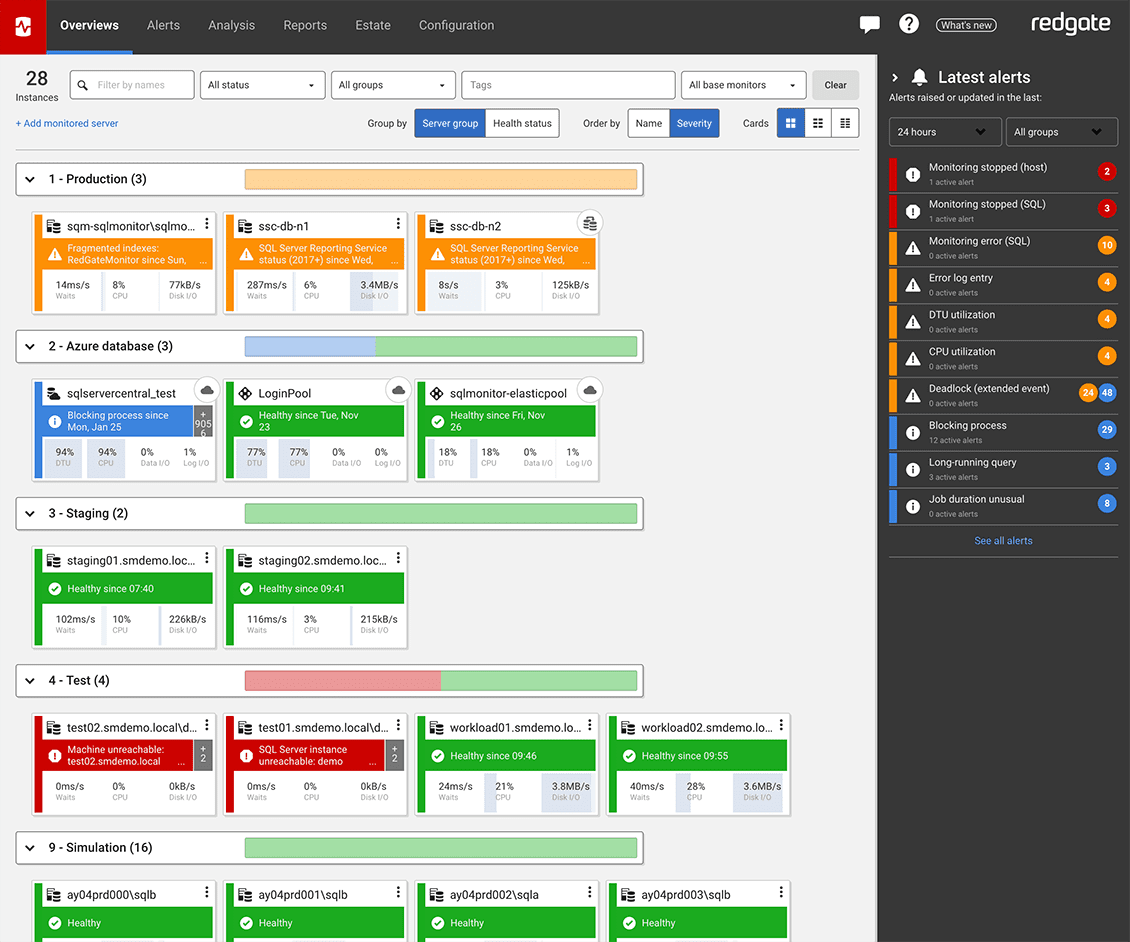
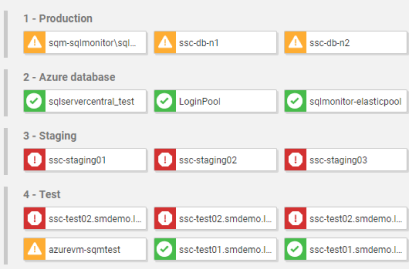
Get a unified, web-based view of all your instances, availability groups, clusters and virtual machines, no matter where they're located.
If anything needs attention, you can quickly drill down for detailed performance statistics.
0800 169 7433
sales@red-gate.com
per server, per year
Ideal for businesses looking for a powerful, comprehensive database monitoring solution.
Contact us
The perfect choice for organizations requiring advanced monitoring capabilities.
Also available in  and
and  Marketplaces.
Jump right in! Best for those who like to dig around and see how a tool works right away.
See our monitoring solution in action, watch the 5-minute overview demo of Redgate Monitor.
If you want a little longer to play around with Redgate Monitor, the good news is it's yours, for free, for 14 days.


| Platform | SQL Server | PostgreSQL | Oracle | MySQL | MongoDB |
|---|---|---|---|---|---|
| Windows (including cloud vms) | |||||
| Linux (including cloud vms) | |||||
| Amazon RDS | |||||
| Amazon Aurora | n/a | ||||
| Azure SQL DB | n/a | n/a | n/a | n/a | |
| Azure Managed Instance | n/a | n/a | n/a | n/a | |
| Azure Flexible Server | n/a | n/a | n/a |
Whether you’re an experienced database professional, just starting your career, or need to take care of databases on the side, Redgate Monitor gets you up and running quickly without sacrificing the depth of the diagnostic insights you need.
Redgate Monitor is built to scale with the ever-increasing growth in server estates and the complexity of how data is hosted. Once you start using Redgate Monitor, it will grow with your data and your needs.
Instead of just tracking issues, Redgate Monitor allows you to spot potential problems early, while you have time to plan the best response - rather than firefighting alerts as they occur.
Integration with deployment tools such as Redgate Flyway, and the ability to provide developers with access to diagnostic data, helps to display the impact of deployments (e.g. on CPU) and improves collaboration between developers and DBAs.
We’ve specialized in database software for over 25 years and dedicate eight in-house development teams to continuously improve Redgate Monitor.
With various information, training resources and a large community of database professionals, we’re there to empower you to get the most out of monitoring your servers.

Case study
Redgate Monitor goes beyond time savings and enhanced visibility at grenke AG. It helps them make quick decisions with explanations and evaluation aids, so bottlenecks and errors are actioned before they can impact customers.

Case study
The rapidly expanding online gaming provider, PointsBet, introduced Redgate Monitor to provide an expansive overview of its entire worldwide server estate, whether on-premises or on Azure.

Case study
Relying on a homegrown database monitoring solution was creating downtime, directly affecting members. Ensuring security and compliance was time-consuming and error prone as the company grew, so something had to change.
Whether you want more details about Redgate Monitor, a demo or information on best practices – get in touch with us.

Redgate has specialized in database software for over 25 years. Our products are used by 92% of the Fortune 100. 200,000 customers rely on Redgate worldwide.

Redgate offers comprehensive documentation and a friendly, helpful support team. An average 87% of customers rate our support 'Excellent'.