Automate Responses to Bad Deployments with Redgate Monitor
Jamie Wallis explains how Redgate Monitor can both reveal quickly who ran a deployment, and when, and automate the incident-response workflow to ensure it's dealt with swiftly. By extending such workflows to development and test servers, as well as production, the feedback cycle starts earlier, and you can stop problems from ever reaching the users.
DevOps is about the culture, methods and tools that make practices such as Continuous Integration (CI) and Continuous Delivery (CD), which require cooperation between teams, possible. The goals, broadly, are both to reduce the ‘time to delivery’ by introducing automation, and to improve test coverage, frequency, and quality. The result should be an increase in the frequency of releases, and their reliability.
As teams adopt CI and CD, so the role of a database monitoring tool, such as Redgate Monitor, extends beyond day-to-day health tracking and alerting; it also becomes indispensable in warning the team quickly of any instabilities introduced by database changes, delivered as part of each new release, and identifying who ran the deployment. Redgate Monitor can also automate the incident-response workflows that notify the correct people. When urgent fixes are required, for example, it can automatically raise a ticket to schedule the required work, providing sufficient details of the problem for those responsible to develop a fix.
By using Redgate Monitor to oversee development and test servers, as well as production servers, Redgate Monitor also provides DBAs and developers with a ‘unified view’ of the impact of database changes, making collaboration and problem solving much easier. This enables the cycle of feedback and improvement to start much earlier in the development cycle, preventing more potential problems from ever reaching production.
Using Redgate Monitor PowerShell API to track the impact of deployments
If a deployment introduces a bug that causes performance instability, or even a security vulnerability, then Redgate Monitor will help you act quickly, by revealing both cause and effect. It not only allows a DBA to spot warning signs early, such as via an alert raised on sustained deviation from established baselines for performance or security metrics, it also makes it obvious if a deployment occurred around that time, and which team owns the process.
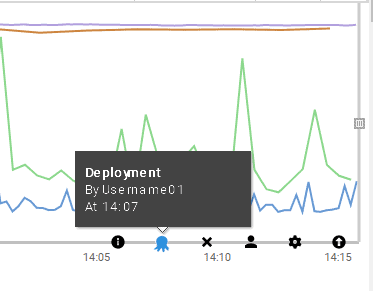
It has, for some time, automatically annotated its Server overview graphs with any deployments made using Redgate tools, such as SQL Compare or SQL Change Automation. Therefore, the DBA can see when they occurred, who ran the deployment, and the impact it had on resource use, if any.
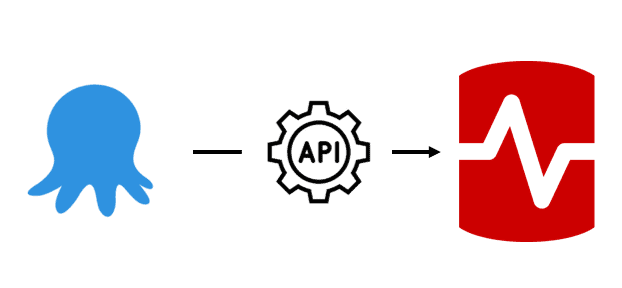
Redgate Monitor’s PowerShell API now extends this capability to any deployment tool that provides an output that it can capture. For example, if you use Octopus Deploy you can write a simple PowerShell command that captures information about the deployment and sends it as a message to Redgate Monitor:

The deployment will be displayed on the server overview graph, allowing you to see exactly what impact, if any, it has had on your key metrics.

Based on this, a DBA or whoever is responsible for monitoring the performance of the database, would have enough information to go to the team or individual who deployed the change to inform them of what has occurred and ask them to fix it.
Redgate Monitor API supports several different types, or sources, of annotation and each one is denoted with its own icon, as you can see on the above graph. This means that we can write scripts that notify Redgate Monitor of other potentially disruptive operations, such as ETL jobs that move around large volumes of data, or a server upgrade or configuration change, or security patch, which might cause unexpected changes in system behavior. Any of these events can trigger a decline in database performance, sometimes gradual, occasionally precipitous. For a demo, see Tagging SQL Server Changes in Redgate Monitor.
Automating incident-response workflows
Annotations reveal quickly when a deployment, or some other SQL Server maintenance task, was performed and who ran it. However, when such tasks are run frequently, by several different teams, it becomes very useful to automate the workflow that leads the correct team to respond, promptly.
For this process Redgate Monitor use webhooks. Most major ticketing systems, such as ServiceNow, group messaging apps, such as Microsoft Teams, or more general infrastructure management tools, such as Splunk, will allow you to set up a webhook to receive alert messages from Redgate Monitor.
For example, you can set up a webhook that delivers a certain alert message from Redgate Monitor to ServiceNow and instructs it to raise a ticket based on that alert.

If a deployment causes an issue that pushes a metrics above a certain threshold, which in turn triggers, for example, a high severity performance alert or security-related alert, Redgate Monitor will send that alert, via a webhook, to ServiceNow and the team that issued the ‘bad deployment’ will receive a ticket to fix it. This will all happen as soon as the problem arises, and without the need for any manual administration.
The dev team can make the fix and then repeat the deployment process, safe in the knowledge that any further issues will be flagged in the same way.
The DevOps benefits of monitoring your test and development and test servers
Ideally, of course, a DevOps approach will increase the quality of your integration, testing, and deployment processes, and therefore minimize the probability of deploying ‘problematic’ updates to your production servers.
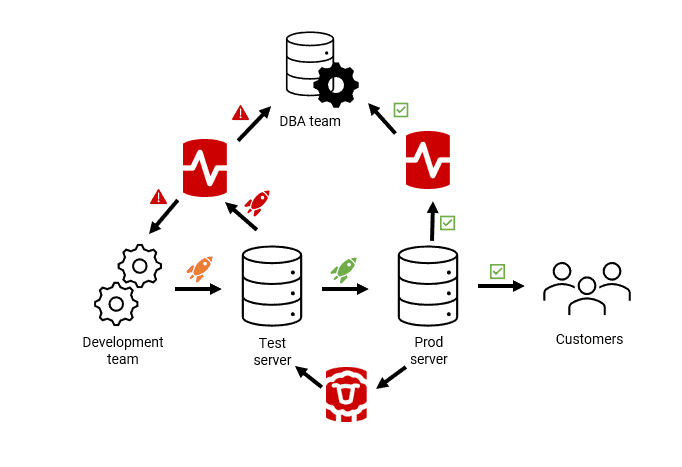
By using Redgate Monitor on your development and testing servers, alongside production servers, teams can assess the impacts of their changes, through the same processes described above, before deploying them to production. The following diagram shows one way this might all work, using Redgate tools. Through Redgate’s SQL Provision, you can ensure the test databases have realistic production-like data that doesn’t compromise security, and your teams can be certain that performance will be a close match to what your customers experience when the changes go live.
As teams deploy and test database changes, during development, any behavioral or performance instabilities they introduce can be tracked by Redgate Monitor, and the same automated workflows described previously will allow them to gather feedback and advice from others teams, and to manage and assign issues quickly and efficiently.

Summary
If you aren’t monitoring your database’s performance, you are in effect relying on your users to complain when the database is too slow for them to do their work. Few organizations will tolerate for too long these frequent interruptions to their business operations.
Instead, monitoring should be an integral part of your Database DevOps strategy. It is essential to ensure all your systems are running smoothly, and no issues are disrupting the work of your users. Beyond troubleshooting, monitoring gives you the ability to identify jobs that will improve performance or reduce the chances of future problems.
Additionally, a tool like Redgate Monitor will help you measure the impact of problems caused by bad deployments, and in automatically catching issues to enable your development teams to instantly see and fix them. Using deployment and ticketing tool integrations, via webhooks and Redgate Monitor’s API, you can:
- Automatically monitor deployments to instantly see what was released, to where, by who, and using which tool.
- Set thresholds to raise an alert if a deployment causes an issue.
- Automatically send that alert back to the development team, with information on what went wrong, via their preferred ticketing system.
By automating deployment and error notifications between Development and DBA teams you ease communication and provide full visibility on any subsequent issues affecting your databases and servers. You empower teams to maintain ownership of their deployments, which can generate a faster, smoother, and safer process.
Tools in this post
Redgate Monitor
Real-time multi-platform performance monitoring, with alerts and diagnostics


