Security and compliance
Ensure data security and compliance with monitoring and change traceability
Ensure data security and compliance with monitoring and change traceability
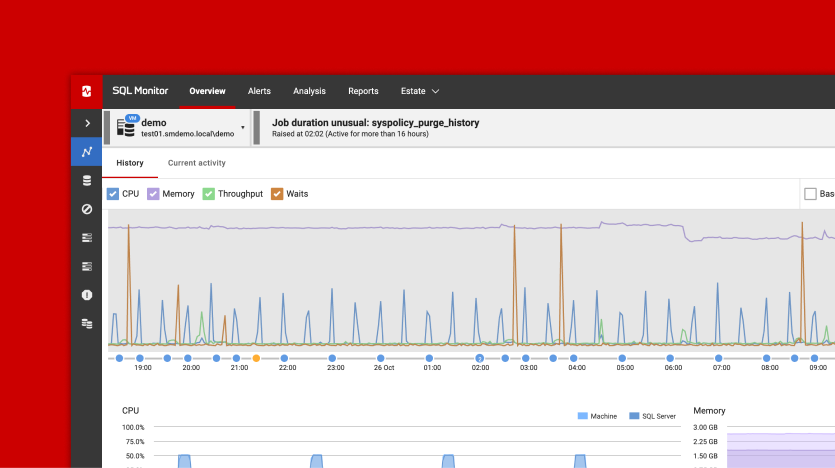
Monitor and understand your databases with full visibility into performance and change
Build, test, and deploy database changes with confidence
Simplify and speed up database development workflows
Prepare reliable data foundations for AI initiatives
Simplify and secure database modernization across platforms
Control costs and boost efficiency in database operations
Simplify and speed up cloud database transformation
Datadog and Redgate Monitor answer different questions. Datadog asks: can we see everything – applications, infrastructure, databases – in one platform? Redgate Monitor asks: when a database misbehaves, how fast can the database team find out why?

Redgate Monitor (formerly SQL Monitor) is built for database teams: diagnostics across SQL Server, PostgreSQL, Oracle, MySQL and MongoDB, estate-wide security and compliance visibility, transparent per-instance pricing, and a fully managed SaaS option. It's the dedicated tool DBAs reach for, whether it runs alongside an observability platform or replaces a database module inside one. Proven at scale: Republic Bank runs it across more than 1,900 databases.

Datadog is a genuinely broad, capable observability platform, and Datadog Database Monitoring is a real product with real depth behind it – this isn't a case of dismissing it. The question worth asking is which tool your database team reaches for first when something breaks at 3am, and whether that should be the same tool your platform team uses for everything else.
Dimension | Redgate Monitor | Datadog Database Monitoring |
|---|---|---|
| Focus | A dedicated database monitoring tool – diagnostics, alerting and estate visibility built specifically around database work. | A unified observability platform spanning infrastructure, applications, logs, security and databases, with Database Monitoring as one module inside it, per Datadog's own site. |
| Platforms covered | SQL Server, PostgreSQL, Oracle, MySQL and MongoDB, in one dashboard – self-hosted or in the cloud including AWS RDS, Azure SQL and Google Cloud SQL. | Postgres, MySQL, Oracle, SQL Server, MongoDB, Amazon DocumentDB and ClickHouse, per Datadog's own documentation – broader named engine coverage than Monitor today. |
| Database diagnostic depth | Diagnostics, alerting and tuning guidance built around database engines from the ground up. | Query Metrics, Query Samples and Explain Plans; query samples and their execution plans are retained for 15 days, with per-query metrics tracked for the top 200 normalized queries per host per collection interval, per Datadog's own documentation. |
| Who it's built for | Database teams and DBAs, including “accidental DBAs”, are the primary users, not a secondary audience. | Platform and SRE teams monitoring the whole stack, with database work as one view among many, per Datadog's own positioning. |
| Security & compliance monitoring | Enterprise edition adds estate-wide permissions visibility and configuration checks against hardened baselines, producing evidence for SOX, PCI DSS and HIPAA audits of the database itself. | Datadog's Audit Trail tracks activity inside the Datadog platform – logins, dashboard edits, API and configuration changes – rather than access history for the underlying databases, per Datadog's own documentation. Datadog holds a broad set of platform certifications, including SOC 2 Type I/II, ISO 27001/27017/27018/27701/42001 and FedRAMP High. |
| Deployment model | Self-hosted, cloud, or hybrid; also available as a fully managed SaaS edition. | A SaaS platform – the Agent runs on your infrastructure and sends data to Datadog's cloud. Datadog's CloudPrem, currently in preview, brings self-hosted log storage; the core platform, including Database Monitoring, remains cloud-hosted. |
| Pricing model transparency | Standard edition list pricing is published per server, with self-serve purchase. Enterprise is quote-based. | Database Monitoring is priced separately from the base platform, per database host. It isn't listed with its own price on Datadog's public pricing page, so a specific figure means asking your Datadog rep. |
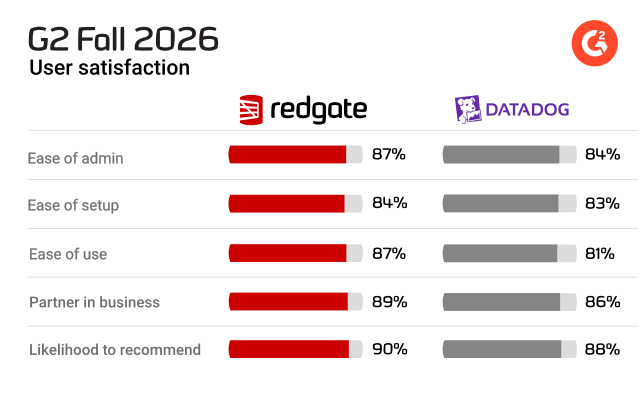
| Support | 87% of customers rate Redgate support “Excellent”; documentation, university courses and community forums included. | Support through Datadog's Learning Center, community forum and enablement sessions, per Datadog's own site. |
Folding database monitoring into an APM is an appealing idea on paper, and it is one plenty of organizations are actively weighing right now. If your team is small, or databases are a minor part of a much larger stack, that trade-off can be the right one.
But the cost of that decision, particularly for larger teams, is the ability to monitor the depth on the database itself, since a platform built to watch applications, infrastructure and logs treats the database as one area among several, and three numbers show what that costs a business.

An APM is built to notice a problem from the outside, once a transaction has already slowed or a request has already timed out and a user has felt the effect, whereas a dedicated database monitoring tool sits closer to the source and catches the condition that caused it, whether that is a query plan that changed overnight, a backup that failed silently or contention building between two workloads competing for the same resource, before any of it reaches the application layer. That gap between catching a cause and catching a symptom is an expensive one, because for 90% of mid to large enterprises a single hour of unplanned downtime now costs more than $300,000, and in banking, finance, healthcare and government that figure exceeds $5 million per hour (ITIC, 2024). Alerting that is switched on by default with tuned thresholds, rather than waiting on weeks of configuration before it fires on anything real, is what turns that theoretical earlier warning into an actual one.

Redgate's State of the Database Landscape 2026 reports that 84% of organizations now run two or more database platforms and that 46% plan to add more, with 43% operating hybrid estates that combine cloud and on-premises hosting. An APM's database coverage tends to be strongest on the engine or two it built for first, with the rest picked up later and covered less completely, and a growing mixed estate is precisely the environment where that unevenness becomes visible, which is why 55% of database professionals name monitoring as the area where they most need strong multi-platform support, ahead of every other category surveyed. Redgate Monitor covers a multitude of database engines from SQL Server, Postgres, Oracle and more, with a dedicated engineering team committed to a robust roadmap, constantly evolving the product to best support multi-database estates.

Where database monitoring lives inside an APM, someone on the database team still has to do the digging once an alert fires, because the platform has raised a signal without doing the database-specific diagnosis that sits behind it, and that manual work accumulates across every incident and every week. A tool built specifically for the database does that diagnostic work continuously instead of leaving it to a person.
For a lot of teams, the real answer isn't either/or. Running Redgate Monitor for the database estate alongside Datadog (or Dynatrace) for infrastructure and APM is common and it works: the platform team keeps its single pane of glass for everything else, and the database team gets a tool built around how they actually work.
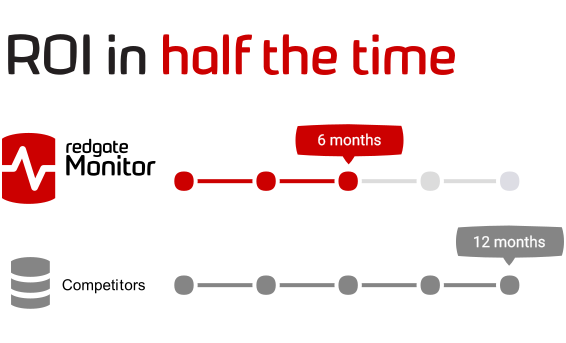
That “both” strategy pays for itself. Finance customer grenke AG cut daily monitoring from two hours to thirty minutes, a 75% drop in time spent. Digital Outsource Services saves 15 hours a week. Enterprise customers report saving an average of three hours a day using Redgate Monitor. Measured against senior database administrator salaries in the $120,000 to $160,000 range in the US market, that's the ROI case for running both: a database-depth tool pays for itself in time saved and faster diagnosis, whatever the platform layer costs on top. Add estate-wide compliance evidence and less alert noise, and you've got two more business-level wins a platform tool simply can't give the database team.

Datadog is a capable, widely used observability platform, and for platform and SRE teams who need one view across infrastructure, applications, logs and security, it's often the right answer. Datadog Database Monitoring is a real product, not an afterthought – by Datadog's own documentation, it covers Postgres, MySQL, Oracle, SQL Server, MongoDB, Amazon DocumentDB and ClickHouse, with query performance metrics, query samples and explain plans, plus – for PostgreSQL specifically – Bits Database Optimization, which can propose an automated query rewrite as a pull request. Datadog also holds a broad set of platform certifications, including SOC 2 Type I and II, ISO 27001 and FedRAMP High.
The question a database team should answer isn't whether Datadog is capable – it clearly is – but whether database monitoring inside a general observability platform gives them the depth they reach for during an incident, or whether that's a job for a tool built around the database specifically.

Redgate Monitor gives database teams fast, deep answers, whether they're fixing a problem, preventing the next one or planning ahead. It covers SQL Server, PostgreSQL, Oracle, MySQL and MongoDB from one dashboard, on premises or in the cloud, self managed or as SaaS.
Redgate Monitor Enterprise security and auditing features automatically check your servers against the CIS Benchmarks®, without manual checks or homegrown scripts. Because the Center for Internet Security® (CIS®) has certified those checks as accurate, leadership and auditors can trust the results, and your DBAs stay focused on the projects that move the business forward.
Platforms like Datadog have compliance tools too, but they don't check the settings inside your databases. That work falls back on your team, and risky settings can slip through until an auditor finds them.
It's proven at scale and across use cases. TruStone Financial used it to spot where databases could be consolidated onto shared instances during a merger, cutting its overall SQL Server licensing requirement by 25% even as its estate grew – its lead DBA, William Boutwell, says Redgate Monitor “cut my time exponentially”. GoodHabitz used it to validate sizing before a cloud migration, discovering it needed RDS instances up to eight times larger than initial estimates – avoiding a costly under-provisioning mistake – and went on to cut infrastructure costs by a third. Across Redgate Monitor Enterprise, customers listed on AWS and Microsoft Marketplace report saving an average of three hours a day that would otherwise go into monitoring and troubleshooting.
This doesn't have to be a rip-and-replace decision. The practical way to evaluate is to run Redgate Monitor alongside whatever you already have – Datadog included – during a free trial or a live online demo, on the servers where database depth matters most, and see what it surfaces that your current view doesn't. Some teams go on to replace their database module entirely; others keep Datadog for infrastructure and APM and run Redgate Monitor specifically for the database estate. Both are valid outcomes of the same evaluation.
See what database-first depth looks like alongside – or instead of – your existing observability platform: start a free trial, try the live online demo, or talk to us about your estate and stack.
If your database team needs deep, database-specific diagnostics – query plans, blocking, wait statistics, backup status – Redgate Monitor is built specifically for that job. In contrast, Datadog's Database Monitoring is one module inside a broader observability platform. Which is the better fit depends on whether your team needs database depth or single-platform consolidation more.
Yes. Many teams run Redgate Monitor for database-specific diagnostics while keeping Datadog for infrastructure and application monitoring. Neither tool requires you to drop the other.
Because it's built around how they actually work: query plans, blocking chains, wait statistics and backup status are the first screen, not one view among many. A tool built only for databases can go deeper on database-specific detail than a module inside a wider observability platform.
Datadog and Redgate Monitor do different jobs: Datadog watches infrastructure and applications, while Redgate Monitor watches the database itself. That difference costs real DBA hours when it's missing – grenke AG cut daily monitoring from two hours to thirty minutes (a 75% drop), Digital Outsource Services saves 15 hours a week, and Enterprise customers report saving an average of three hours a day. Those hours add up to a real number on top of whatever the platform layer costs. For the full TCO and board case, see our ROI calculator.
Redgate Monitor's Standard edition list pricing is published per server, with a self-serve purchase option; Enterprise is quote-based. Datadog Database Monitoring is priced separately from Datadog's base platform, per database host, and isn't listed with its own price on Datadog's public pricing page – so getting an exact figure means asking your Datadog rep.
Whether you want more details about Redgate Monitor, a demo or information on best practices – get in touch with us.

Redgate has specialized in database software for over 25 years. Our products are used by 92% of the Fortune 100. 200,000 customers rely on Redgate worldwide.

Redgate offers comprehensive documentation and a friendly, helpful support team. An average 87% of customers rate our support 'Excellent'.