Integrating Redgate SQL Code Guard with SonarQube
Greta Rudžionienė provides a step-by-step guide to running SQL code analysis checks, as defined by SQL Code Guard, in SonarQube, a general-purpose code quality tool that can perform continuous code analysis on a variety of languages.
Every time we make changes to an application, we run a series of tests to ensure that the new version still behaves and performs as we expect, and that the code changes don’t introduce any bugs. These practices have been applied for many years to application code. For example, it is common that development teams run regular code quality checks on their code base, looking for bugs, syntax errors, performance issues, vulnerabilities, and so on. While testing databases should be no exception, even Agile development teams often perform very few checks on the database.
SonarQube is a popular code quality tool that can plug in to build and Continuous Integration (CI) systems for continuous inspection of application code. Redgate’s SQL Change Automation automates database delivery, and like SonarQube plugs into all the popular build and CI servers. It incorporates the SQL Code Guard code analysis engine and will automatically run its code analysis checks on deployment scripts, identifying possible T-SQL issues relating to performance, style, best practice, deprecated syntax and more.
In this article, I will show you how to combine SonarQube and SQL Code Guard, so that you have a way to review technical debt across your entire code base.

SQL Code Guard
SQL Code Guard parses the SQL source code, inspecting it for compliance with a built-in set of static code analysis rules for a range of issues, including possible database design flaws (e.g. a use of a heap rather than clustered index), as well as problems with query logic that could cause unpredictable performance or behavior, or even cause security problems. You can check a live database, or you can check the code in any SQL file, or directory with .sql files in it.
Two Redgate tools use the SQL Code Guard analysis engine:
- SQL Prompt will inspect the code as you type it or load it into the query pane, in SSMS or VS, meaning that developers have a chance to eradicate many of these issues, before committing changes to source control.
- SQL Change Automation will run its code quality checks on any deployment script used during automated release processes
You can also invoke the command line version of the SQL Code Guard engine directly. Phil Factor shows how to do this from PowerShell. Here, I’ll show how to invoke the Code Guard checks automatically, from SonarQube, so that you can see the SQL code analysis alongside the application code analysis, for a single view of ‘technical debt’ across your entire codebase.
All you will need to do is download SQL Code Guard and extract it to a known location; I used “C:\Program Files\SqlCodeGuard“.
SonarQube
I won’t go into deep details on how SonarQube works, or its architecture, because you can read all about it in the documentation. In short, you need to install a SonarQube server instance. The SonarQube server processes the code analysis reports and saves them in a SonarQube database. You can also configure code analysis projects, and view the reports, via its UI.
You add plug-ins for the language(s) you need it to analyze. In our case, we’ll use the SonarSQL plugin that I wrote, as an integration between SonarQube and SQL Code Guard, so that the former will invoke the latter and report the results of its TSQL static code analysis.
We also need to install, usually on our build/CI server, the SonarQube code analyzer (“sonar-scanner“) that runs the code analysis on the code files in your source control repository and sends the results to the SonarQube instance.
I’m just going to install all the required parts on a single machine, so you have everything you need to do a proof-of-concept.
Install SonarQube server
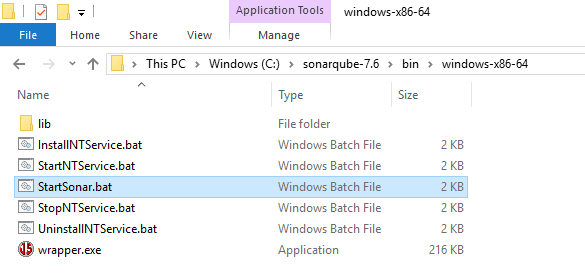
To begin with you will need a running SonarQube instance. Mine is a locally running service. If you don’t have one already, just download the zip from the Sonar website, extract it, and run:
sonar_home/bin/windows-x86-64/StartSonar.bat

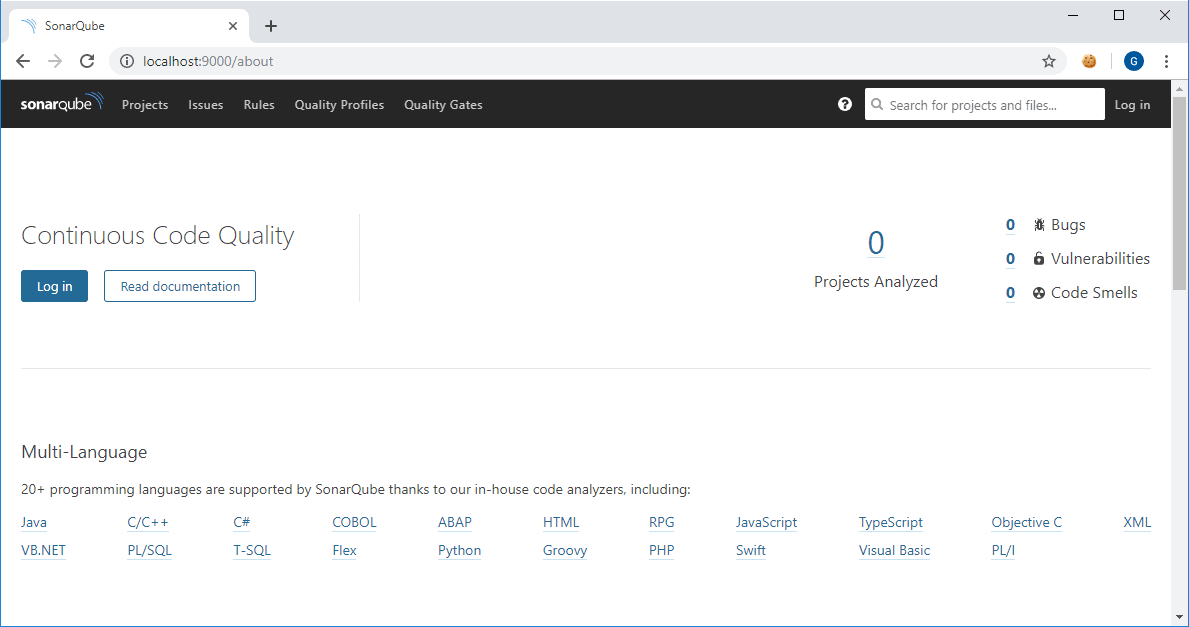
After this, if you navigate to http://localhost:9000, you should see the Sonar Web UI.

Install the Sonar SQL plugin
Next, we need to install the open source Sonar SQL plugin, which will allow SQL Code Guard to publish its reports within SonarQube. You can download the latest version of the jar from my GitHub repo, and put it into the sonar_home/extensions/downloads folder.

After this, restart the SonarQube service. You can stop/start the sonar executable, or stop it via the SonarQube UI, in the Administration | System tab.
Install Sonar-Scanner
Finally, we will need the sonar-scanner executable that will run the checks. Just extract it to a known location, such as “c:\Program files\sonar-scanner”. When sonar-scanner is run, SQL Code Guard executes, and your T-SQL code will be analyzed.
More generally, we also have the option to use special sonar-scanner plugins for the various build servers such as msbuild, ant, Jenkins, Azure DevOps and so on, so that we can run these code checks as part of automated build or CI processes. Again, you can read more on them in the SonarQube docs.
Configuring and running the code analysis checks
I have used an example database from here. You can either checkout from git of download a zip file. Now we’re almost ready to run the analysis, but before we do, there are a few parameters that need to be set. You can either pass them as arguments to sonar-scanner, as follows:
sonar-scanner -D sonar.projectKey=" demo.sql.tsql.project" -D sonar.projectName="My first TSQL project" )
Or create a sonar-project.properties file. I have used the second option, and my properties file looks like this:
# Unique project key in SonarQube
sonar.projectKey=demo.sql.tsql.project
# Project name displayed in Sonar
sonar.projectName=My first TSQL project
# Project version, used to distinqush project analyses
sonar.projectVersion=1.0
# relative path to tsql code files
sonar.sources=src
# absolute path to the SQLCodeGuard executable
sonar.sql.tsql.cg.path=C:/Program Files/SqlCodeGuard/SqlCodeGuard40.Cmd.exe
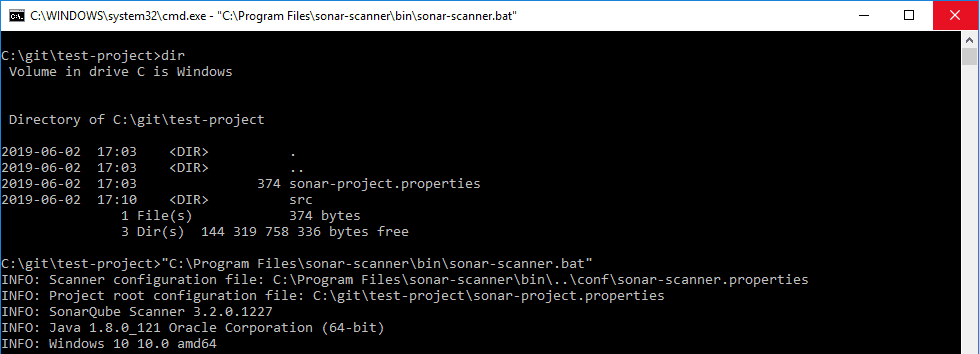
Modify this as required and simply save it as a text file in a location appropriate for the relative path defined for the source control directory that contains the database code files you want to analyze. My project folder looks like this:

That’s it! Now just run the sonar-scanner command line from the directory where the sonar-project.properties file is located.

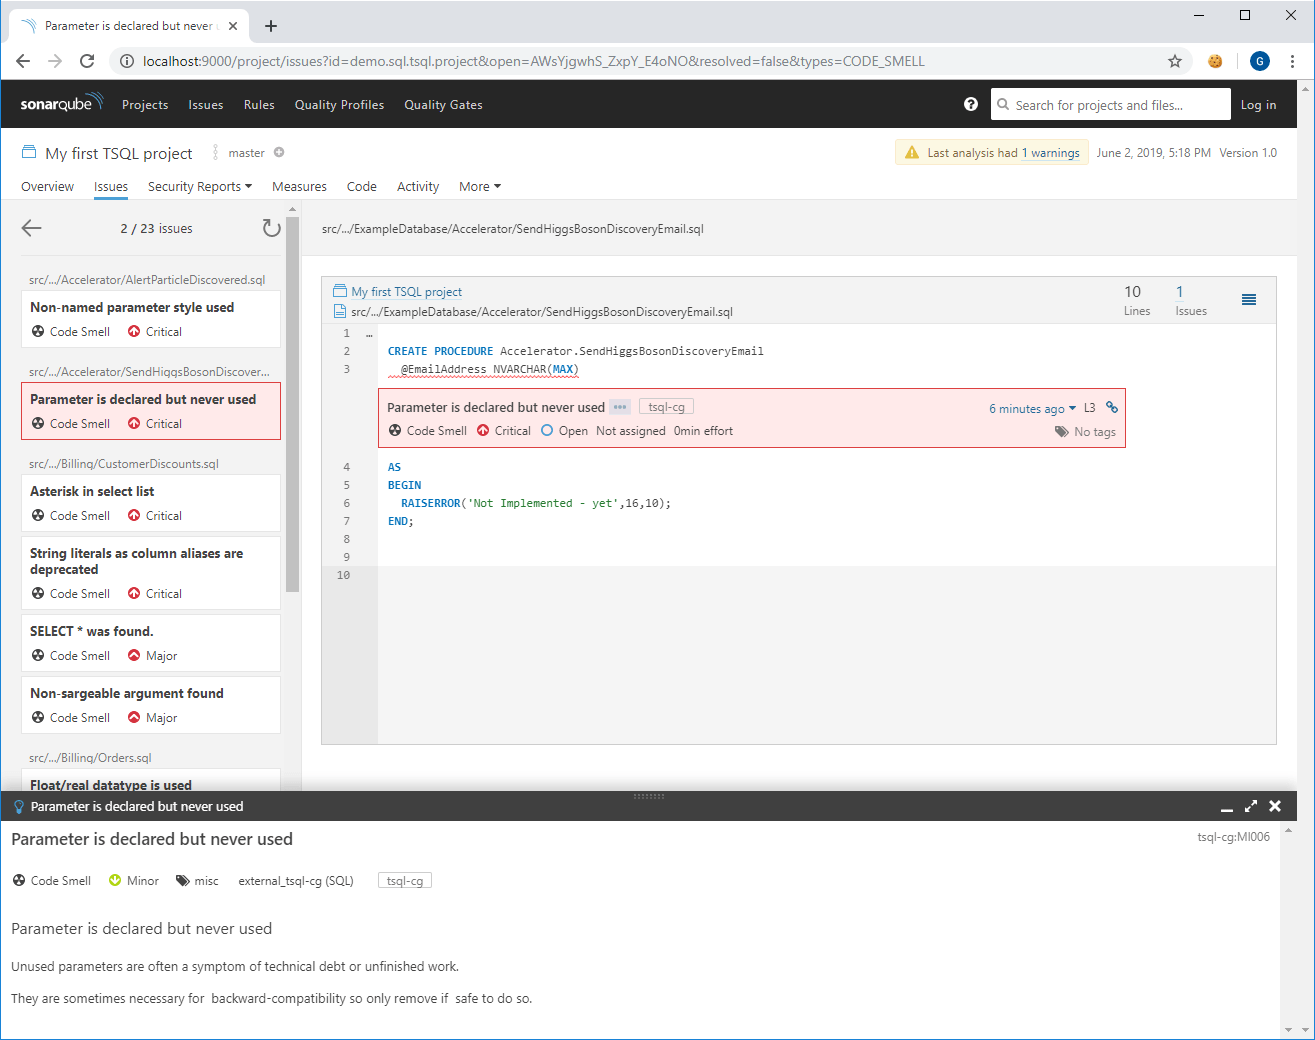
Once it completes the analysis, you can check out SonarQube UI to see report with issues found by SQL Code Guard and start resolving them. You can read more about the issues that code guard detect in the Redgate documentation, and many of the rules have accompanying technical articles to demonstrate the problems that rule violation can cause, and that offer guidance on how to fix them
Summary
By integrating RedGate’s SQL Code Guard tool with SonarQube, you’ll identify possible performance, design and other static code analysis issues as early as possible in the development process. This will help you to improve code quality, control technical debt and reduce maintenance costs, across your entire code base.

