


Learning from the Accelerate “Four Key Metrics”
 There's been a lot of excitement about the book Accelerate, which summarizes research from the past several years of the State of DevOps Report from DORA (which Redgate sponsors).
Perhaps the most popular topic is the “four measures of software delivery performance”, sometimes called “Accelerate metrics” or simply the “four key metrics”.
We’ve started to try track these at Redgate, and we’re learning to use them to drive improvements in how we deliver software.
How to track them?
We trialed manually gathering data, by recording release dates or time-stamping index cards. These are well-known and easy to adopt techniques, but we found them onerous and often left us without any single source of truth for the data.
Instead, we added tooling to our delivery pipeline to track and present this data for us.
Inspired by some open source work by the clever folks at Praqma, we developed some lightweight PowerShell that can interrogate Redgate’s various git repositories to generate the four key metrics using our source code history as a source of truth. We’re looking into open sourcing this code and sharing it with the community, so please let us know if you’d be interested.
How to use them?
One controversial topic was how to model this data. Accelerate makes a strong statement that a successful measure of performance should: focus on a global outcome to ensure teams aren’t pitted against each other. We expose these metrics at a global view for the company, to help us understand Redgate’s overall delivery performance.
We also want our teams to be able to optimize themselves. Redgate prides itself on encouraging autonomous, cross-functional teams to do their best work. We work in a high-trust environment, and teams take full responsibility for the delivery and quality of their work. This helped us to also expose these metrics at a per-team level, giving teams the tools to understand their own performance, on the strict understanding that we won't be comparing this across teams.
Our tooling makes it easy to report on the four key metrics for any subset of Redgate, so we do exactly that.
What have we found so far?
We’ve only had this tooling in place for a little while, but we’re already seeing the benefits of exposing and reflecting on our performance.
As a long-term agile house, we’ve always had a visible culture around the cadence of our work. That comes across in the tempo-based metrics, deployment frequency and delivery lead time.
Exposing this data has helped us identify some interesting working patterns that we may not have seen otherwise.
Understanding tempo
Like many companies, our way of working is heavily inspired by Scrum. Many teams work in time-boxed delivery cycles with intentional planning and incremental delivery. That means often having stable deployment frequencies of once a week, and delivery lead time around the five-day mark, as these charts showing the tempo metrics for one of Redgate's products show:
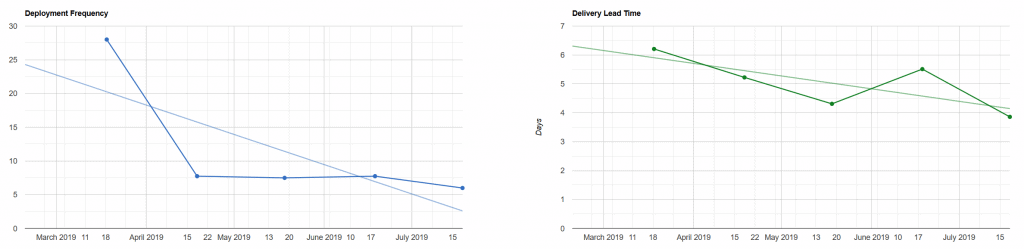
According to Accelerate, that would put a typical team at the positive end of the 'Medium Performers' bracket:

But what if we look at the tempo metrics for Redgate as a whole?
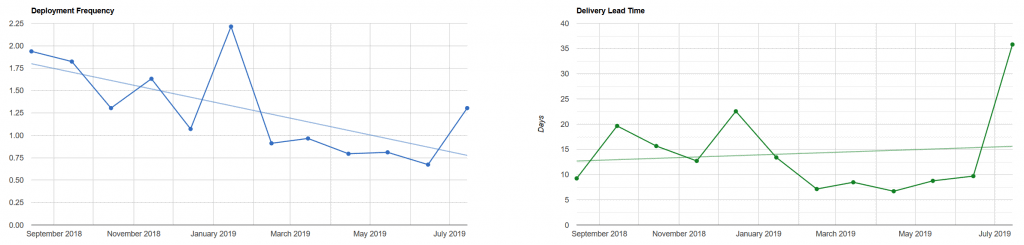
Firstly, we see a lot more variation. More on that in a moment.
The big eye-opener for us here is Redgate’s global deployment frequency. We’re releasing product improvements multiple times a day. While that’s great, it means our users are being asked to install updates far more often than we realized before. This is putting pressure on how we get those updates into their hands, and what our upgrade process looks like.
Why the variation?
Significant changes in deployment frequency tend to line up with peak holiday times, especially Christmas, which we probably expected.
Variation in delivery lead time took a bit more investigation, but highlighted teams who were struggling to deliver their work incrementally. This led to long-lived feature branches, and the team not getting valuable feedback on their work. Identifying this let us work with that team to determine how to slice a tricky piece of work into smaller deliverable pieces and get that value out to users sooner.
Understanding stability
Redgate has always taken product quality seriously and has deeply ingrained processes around identifying and recovering from failed releases. We know how to do this, but we’ve tended to treat it as a rare or special occurrence.
Because it was a seen as a special case we didn’t keep many records, but we’re starting to gather that data now. This has been made easier by another lightweight change to our deployment pipeline, and the stability metrics look like this:
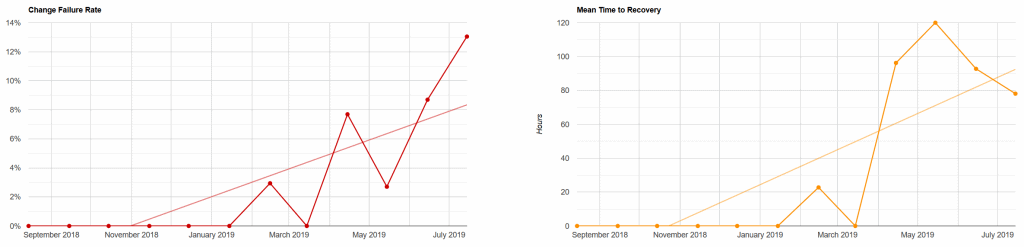
We’re already seeing that our change failure rate is higher than we expected; a valuable insight for a company that prides itself on quality. Worse is that recovery can take us multiple days. We mitigate this by identifying failed releases and preventing more users from adopting them, but exposing the truth about our stability practices is showing significant areas for Redgate to improve.
Talking the talk
In some parts of our business, talking about performance is natural. Disciplines like Marketing and Sales have widely accepted trading languages that really help us understand how Redgate is performing. Despite being a software company, we’ve always struggled to develop this language for product delivery.
By framing conversations around these four key metrics, we’re in a far better position to talk objectively about how we’re delivering software and identify local or global areas to improve.
What comes next?
We’ll continue to track and consider these metrics over the coming months and see what we can learn about our performance as we do so. More importantly, we’ll use those insights to inform how we work, and better judge the impact of introducing new ways of working. If you'd like to find out more, we’ll be sharing our successes (and failures) at ingeniouslysimple.com.
This document contains proprietary information and is protected by copyright law.
Copyright © 2026 Red Gate Software Limited. All rights reserved
You may also like

Blog
Announcing Redgate Flyway Enterprise’s advanced capabilities for Databricks now in Preview

Blog
To learn and improve, we cannot be afraid to fail

Blog
Loading comments...