The importance of monitoring your SQL Servers
Without a proper SQL Server monitoring system in place, DBAs can find they never have the time to implement new processes because they’re bogged down with too many daily checks, and other painstaking investigatory tasks. On top of this, they’re continually firefighting problems that are surfacing instead of being able to spend time finding and fixing the root causes, and they don’t readily have the answers available when something goes wrong.
What are the red flags you should look out for?
You’re short of time
SQL Server monitoring with custom scripts is very time-consuming. For a large estate it can take hours to login to each server, run the scripts, collate the results, and analyze them. This process then needs repeating for each individual server and, for a growing estate, can become unsustainable. This is compounded by the fact that Redgate’s recent State of SQL Server Monitoring Report found that most estates are continuing to increase in size, even those that are relatively small.
When you have a couple of SQL Servers, monitoring them manually might be possible. But what about when you have 10, 50, or 150 servers? For many organizations, continually increasing DBA headcount isn’t going to be a realistic option.
You’re always firefighting
When you’re constantly jumping from one critical problem to the next and spending a lot of your time doing manual investigatory work before you can even start resolving the underlying issue, you know there must be a better way.
If you could create performance baselines and benchmarks, you could catch the issues that arise before they become overwhelming. Taking a proactive approach would also mean that teams actually have the time to resolve the underlying issues, instead of constantly implementing quick fixes so that they can move on to the next most pressing problem.
You don’t have the answers
When management and other team members ask about why a server was slow overnight, you don’t want to be in a position where you don’t have an answer, especially if they’re also the ones notifying you the issue occurred.
Having the ability to go back in time and see exactly what was happening on the server and what caused the problem you’re now facing could save a lot of unnecessary diagnostic work and get you straight to working on the fix.
Keeping the systems working and your users happy is your priority. And if you have a way to proactively monitor your estate, you can be aware of a problem before your users and the wider team – and correct it before it impacts them.
The benefits of proactively monitoring your estate
A SQL Server monitoring tool can help teams that look after SQL Server be more proactive and deliver more value back into the organization. As well as alerting you to current issues, a monitoring tool can give you the information you need to stop them happening in the future.
Better invest your time
You need a database monitoring solution that tracks the health of your servers, instances and databases, all in one place, on one screen, regardless of where the servers are located. This will allow you to establish the health of your servers at a glance and reduce your daily checks down to mere minutes, meaning you gain the time back to better invest elsewhere.
Hybrid estate, singular dashboard
Redgate Monitor will monitor on-premises servers, cloud-based Azure SQL Server databases, elastic pools and managed instances, VMs, availability groups, and clusters. As your estate grows, you can bulk-add servers or automatically discover them through its API, making scaling straightforward.
Regardless of scale, Redgate Monitor’s global dashboard will allow you to track activity across all your servers, and their overall health, from a single place. SQL Server instances and servers are displayed as color-coded tiles on a single pane, making it easy to see which are healthy, and which may need your attention:
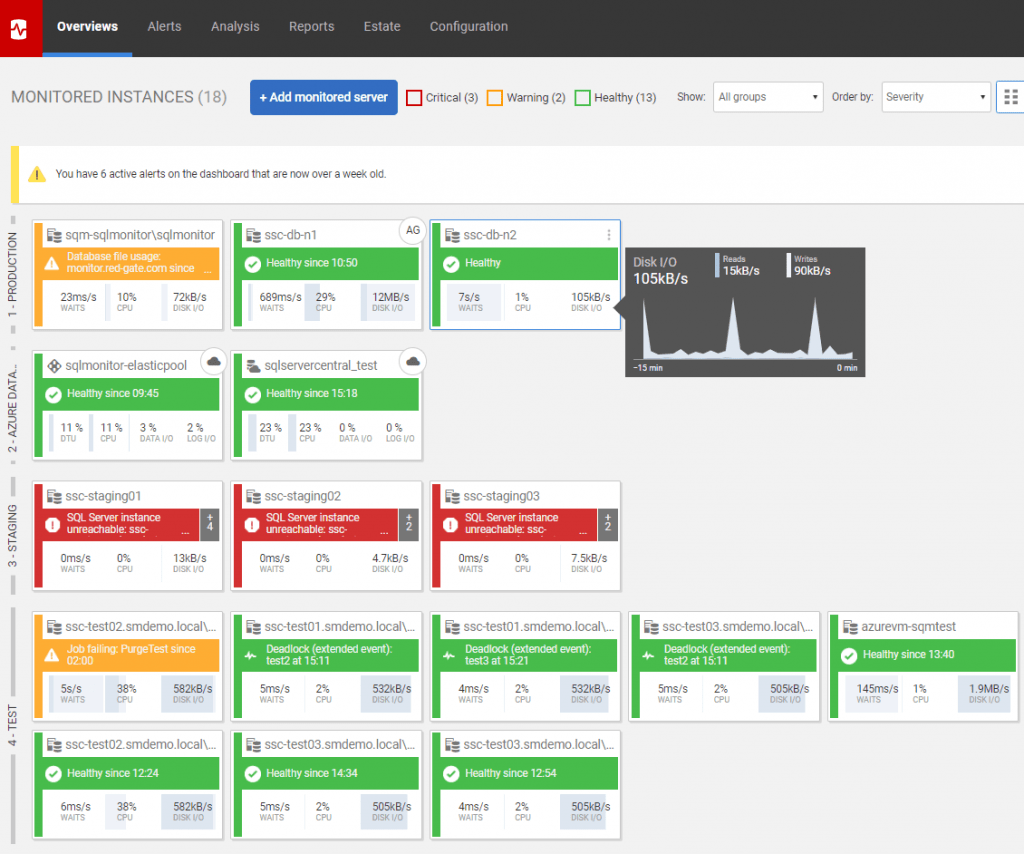
You can also categorize your servers into Groups that share a common set of properties or requirements, such as production servers, staging or test and development servers. Again, this allows you to prioritize issues, as they arise, according to the group affected.
For more details, see the Redgate Hub article, Scaling Redgate Monitor to Large SQL Server Estates.
Support
Having the proper support in place for your tooling is paramount to having a continued positive experience with the solutions you have put in place. Redgate’s top-rated support team is always available to help with any questions as part of your standard support and upgrades package. We also have free online training courses for Redgate Monitor on Redgate University along with many product learning articles on our website. Users can suggest new future features and functionality on UserVoice and, within the tool, the ‘What’s New’ tab tells you about the latest features added to Redgate Monitor.
Web-based collaboration
Alongside the wide array of features and extensive support offered by a major monitoring tool, Redgate’s solution stands out because it’s web-based. By making the information more accessible, it enables faster and more collaborative problem solving. This, in turn, promotes a DevOps approach to working since the data is more easily accessible, and easier to understand and share amongst the wider team.
Less time spent firefighting
To significantly reduce the time you spend firefighting, your SQL Server monitoring tool must:
- Provide baselines to help you distinguish between abnormal and routine patterns of behaviors
- Link cause and effect
- Allow you to predict trends and anticipate looming problems
Baselines
It’s easy to panic and dive into firefighting mode on spotting, for example, a sustained spike in CP, but is the CPU busier simply because the server is busier? Are the number of connections, or number of user requests per second higher than normal?
You can only know for sure if your monitoring tool knows what ‘normal’ looks like, for that time on that day, by comparing the current behavior to its baseline – in other words, to the same metrics at the same time yesterday, or the same time over the past several days or weeks. Your performance metric baselines might reveal that CPU pressure is normal at that time because end-of-month reports are running, for example.
The effects of deployments
It’s quite common that a deployment will result in server behavior that deviates from normal. However, it can take a while to link cause and effect unless the data is right there in front of you.
Redgate Monitor will automatically mark, on your Instance timeline, any deployments performed by Redgate deployment tools such as SQL Compare and SQL Change Automation. This means you’ll instantly see when the deployment occurred, and the impact it had on your performance metrics.
So if you experience unusual behavior after a deployment, you’ll be able to pinpoint it effectively. You’ll also have information about the issues caused by past deployments so you can properly understand their knock-on effects and avoid them happening in the future.
Anticipating problems
A good monitoring tool won’t just collect the current values for a set of metrics and display them on informative graphs. It will analyze all this data and predict the future value of these metrics, based on trends that are occurring.
In addition to its set of metrics and alerts for tracking issues for each server and database, the Estate pages in Redgate Monitor make it much easier to retain a simple picture of trends across the whole estate. This will allow the team to predict when in the future the current disk space available on a database server will be consumed, for example.
For further details, see the Redgate Hub article, Using the Redgate Monitor Estate Pages.
Always have the answers you need
Intelligent diagnostics
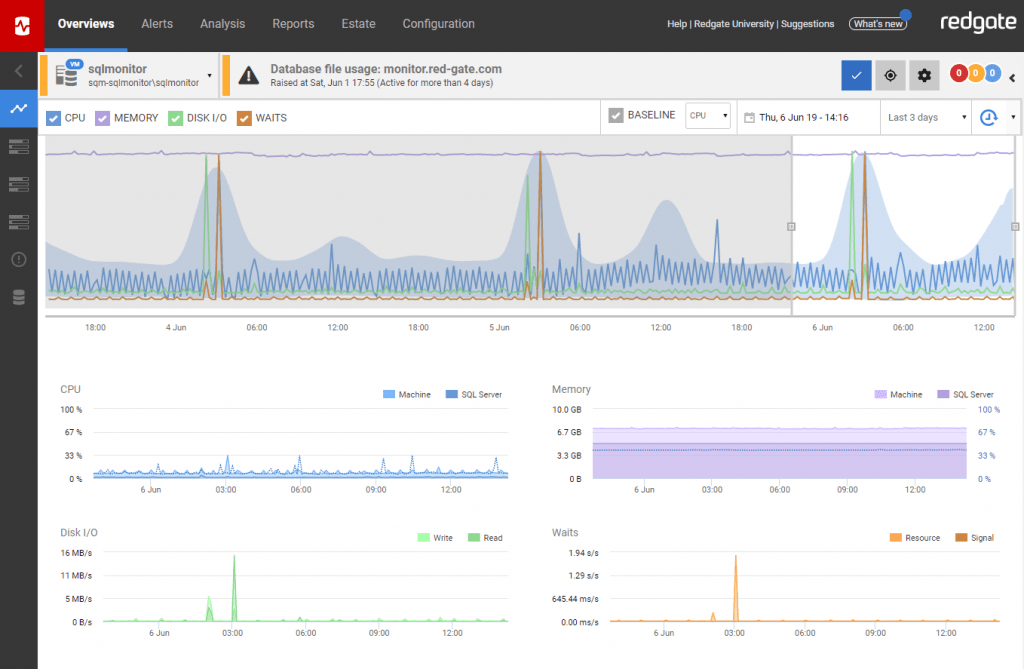
With a focused set of performance metrics at your disposal, you can quickly pinpoint the cause of any issues you’re having with your estate’s health.
Redgate Monitor arms you with the information you need to diagnose the problems you come up against. It uses intelligent baselines to see patterns in performance and then helps you drill down to more in-depth analysis, allowing you to discover the root cause of problems rather than merely the symptoms. You can also segment your data within Redgate Monitor to create graphs which show metrics over very specific time periods.
Query impact
Long running and problematic queries are a key element that can slow down your systems, so it’s imperative that you have a proper way of monitoring them. Performance details for every query will then let you identify delays and deadlocks, and then avoid them in future. A good monitoring solution will also show past queries in a historical graph, automate the impact analysis of your top queries, and create deadlock visualizations.
Redgate Monitor provides all of this alongside the T-SQL text and the query plan, so with the available data you can find expensive queries, unblock delays caused by resource waits, and resolve deadlocks which are hindering usage. With query history, you’re given the information you need to effectively plan for the future, improve performance, and save time going forwards.
Alerts
Being able to tell what’s happening within your systems, what areas need attention, and what’s causing processes to slow down is invaluable. A robust and customizable alerting system will help you achieve this. An alert should include information about what’s wrong and where you can go to find additional information on how to fix the problem. You should also be able to group alerts into common themes, set up notifications according to the alert severity, and customize alerts to suit your estate.
Redgate Monitor takes only seconds to raise an alert and the most recent ones are clearly displayed in a dedicated panel on the main overview tab. Alerts are grouped into themes and different types of issues so that they can be quickly distinguished and prioritized. Redgate Monitor comes with over 55 pre-configured and fully customizable alerts out of the box, and you can also tailor the way you receive alerts, whether it’s by email, Slack, or PagerDuty for SMS updates. There are many filtering options based on a number of different properties, and there is also extensive information available if you want to drill down into the cause of the alert.
Summary
With a robust monitoring system in place, teams can benefit from keeping track of all their servers in one place, wherever they’re hosted. They can easily track, find and fix slow-running queries, as well as diagnose other root causes of problems that could affect server health and performance.
With diagnostic capabilities, analytical detail readily available, and tracked deployment history, you have all the information you need regarding the common problems that can adversely affect your systems. By utilizing this and making small adjustments to your processes, you can plan for the future far more effectively.
Whether it’s working out the best time to deploy your database changes, giving you the foresight into when to scale your disk space, or improving query performance to avoid future resource waits, Redgate Monitor can help you manage your estate more effectively. And with proper alerting and reporting capabilities, there is always transparency in relation to potential issues arising.
Ready to discover the advantages of proactive SQL Server monitoring? Try our live online demo environment or download a free 14-day trial now.
Tools in this post
Redgate Monitor
Real-time multi-platform performance monitoring, with alerts and diagnostics
You may also like
Blog
Redgate Flyway Product Updates – January 2026
Blog
SQL Prompt Product Updates – January 2026
Blog