


Marking deployments and more in Redgate Monitor
NOTE: The code in this article works with Redgate Monitor 13. Read this article for Redgate Monitor version 14.
Redgate Monitor is an essential tool for DBA teams worldwide, providing real-time monitoring of SQL Server and PostgreSQL performance. With RedgateMonitor, you can easily track deployments, errors, and other events on the timeline. This feature, called annotations, allows you to quickly identify the root cause of performance issues and take corrective action. Redgate Monitor’s timeline is a powerful tool that helps you stay on top of your database performance and keep your systems running smoothly. 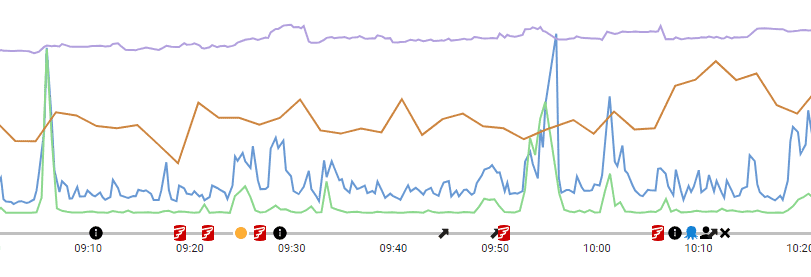
You'll use a PowerShell script to add the annotations to the timeline with just a handful of lines of code.
The PowerShell module
To get started using the Redgate Monitor PowerShell module, navigate to your configurations page and look for the PowerShell API section. You’ll find links to the API documentation, the module, authentication token, and example scripts. Take a look at the example scripts, because there is an annotate example in the Monitored servers section.
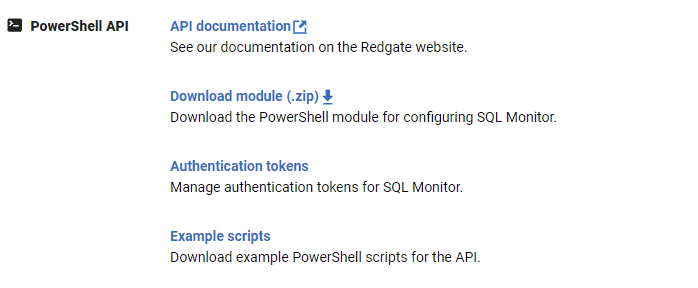
Be sure to always download a new copy of the module after every Redgate Monitor upgrade because the module must match the version of Redgate Monitor that you are running. You’ll also need an authentication token to connect to Redgate Monitor.
The example script
The first step is to connect to Redgate Monitor after importing the module.
|
1
2
3
|
Import-Module .\RedgateSQM
$ErrorActionPreference = 'Stop'
Connect-SqlMonitor -ServerUrl 'http://mysqlmonitorserver:8080' -AuthToken 'GeneratedAuthenticationToken'
|
Next, you must grab the specific monitored server where you want the annotation.
|
1
|
$sqlInstance = Get-SqlMonitorMonitoredObject -Type SqlServerInstance -Name "localhost\SQL2022"
|
Note that
Get-SqlMonitorMonitoredObject requires a
Type parameter. The documentation lists these types:
- SqlServerInstance
- AzureManagedInstance
- AzureSqlServer
- PostgresInstance
- AmazonRdsHost
- AmazonAuroraCluster
- Cluster
- Machine
Finally, run the
Add-SqlMonitorAnnotation command to create the annotation.
|
1
|
Add-SqlMonitorAnnotation -Target $sqlInstance -Description "Deployment" -UtcDate $([datetime]::UtcNow)
|
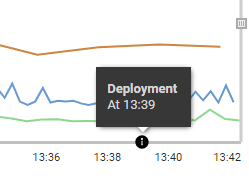
This example specifies the target or monitored object, a description for the annotation, and a date. That was just five lines of code – including connecting to Redgate Monitor. It’s that easy!
Here’s the entire script:
|
1
2
3
4
5
6
7
|
Import-Module .\RedgateSQM
$ErrorActionPreference = 'Stop'
Connect-SqlMonitor -ServerUrl 'http://mysqlmonitorserver:8080' -AuthToken 'GeneratedAuthenticationToken'
# For more details about working with annotations see https://www.red-gate.com/SM13/powershell-annotations
# Use the following to annotate a specific SQL Server instance
$sqlInstance = Get-SqlMonitorMonitoredObject -Type SqlServerInstance -Name "localhost\SQL2022"
Add-SqlMonitorAnnotation -Target $sqlInstance -Description "Deployment" -UtcDate $([datetime]::UtcNow)
|
You can also monitor your PostgreSQL servers with Redgate Monitor. Here's an example:
|
1
2
3
|
# Use the following to annotate a specific PostgreSQL instance
$pgInstance = Get-SqlMonitorMonitoredObject -Type PostgresInstance -Name "10.254.9.122"
Add-SqlMonitorAnnotation -Target $pgInstance -Description "Deployment" -UtcDate $([datetime]::UtcNow)
|
But wait…there’s more!
There are several other options you can use to provide even more information that are not used in the example. See this documentation page to learn more about these parameters.
- Source: Use this parameter to specify the type of event. The
Source parameter also controls the icon you’ll see on the timeline. (See the first image in this article for examples.) Choices are
- Flyway
- Octopus
- Deployment
- Permissions Change
- Configuration Change
- SQL Update
- Error
- SpecificInfo: This parameter allows you to include more information about the event, such as an error number or SQL Server version. It's supported for all the sources except for the Flyway, Octopus, and Permissions Change sources.
- URL: You can also include a clickable URL along with the annotation. Use this to link to direct to more information about the event, documentation, or anything you want.
Conclusion
It’s easy to send annotations to Redgate Monitor, especially if you are already familiar with using the PowerShell module. If you haven’t tried the module for its many other uses, this is a great opportunity to try it out!
This document contains proprietary information and is protected by copyright law.
Copyright © 2026 Red Gate Software Limited. All rights reserved
Tools in this post
Redgate Monitor
Real-time multi-platform performance monitoring, with alerts and diagnostics
You may also like

Blog
Redgate Flyway’s Product Updates – June 2026

Blog
SQL Prompt Product Updates – June 2026
Blog
Loading comments...