


How Redox quickly identify and resolve database performance issues
In the IT team at Redox, I wear two hats: Software Development Manager and DBA. I’m the only DBA in the team, so if anything goes wrong it’s my job to identify and fix it. As you might imagine, this can be challenging when being a DBA isn’t your full-time role.
Based in Sydney, Redox is one of the leading chemical and ingredients distributors in the world, with over 350 employees across our locations in Australia, New Zealand, Malaysia, and the US.
We have a small IT department with two teams: one focusing on the network and the other on software development, which is where the database work comes into the picture. All of our software is developed internally, including warehouse management, sales tools and customer tracking.
To support those applications, we have five SQL servers with around 20 databases across them. They’re all on-premises and of varying sizes, and some are set up in a different way to satisfy the particular regional requirements in our various geographical locations.
That can be quite complicated and in order to manage the databases and quickly identify and resolve any database performance issues, we use Redgate’s database monitoring solution, Redgate Monitor.
Alerts are essential, especially when time is limited
Redgate Monitor has become an important part of my normal working day in two ways. First thing in the morning I check its global dashboard to see if any alerts have come in overnight, and if the servers are performing as expected:
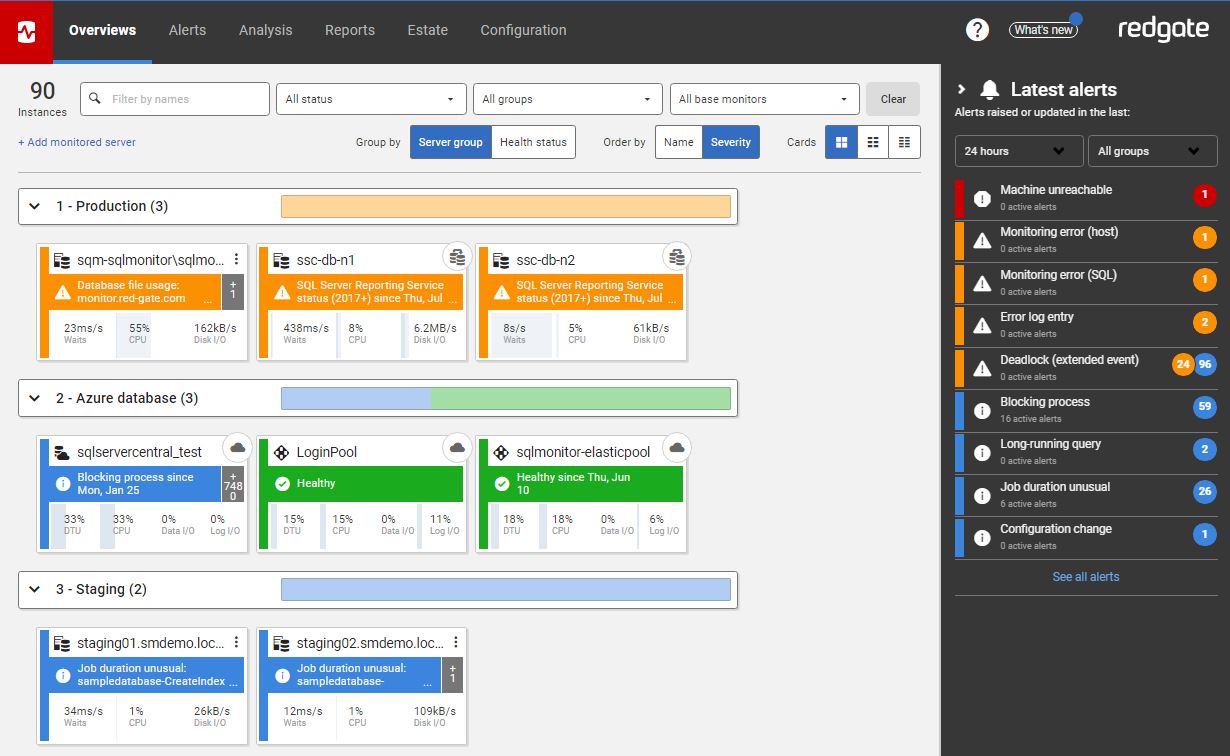
This is the dashboard from the online demo of Redgate Monitor and, as you can see, it’s traffic light system makes it really easy to spot any issues with any of the databases and instances being monitored.
Secondly, there are the alerts that Redgate Monitor provides, listed on the right of the dashboard. When monitoring databases isn’t your only job, being alerted when things go wrong is essential. It lets you get on top of an issue quickly and helps you resolve it before the business even notices.
A notable example of this is when Redgate Monitor alerted us that the data drive for our primary server was filling up. Luckily, the alerts started pouring in quickly and we were able to expand the drive before it was full. If it had maxed out the available space, it would have taken our system offline and stopped a couple of hundred employees from being able to work.
I love identifying a problem like that and fixing it before the phone starts ringing. Being able to be proactive and ahead of the game when things go wrong minimizes the impact on customers and users. It’s so much easier to be able to say ‘we’re on it’ rather than finding out issues from users.
Alongside the standard metrics that come out of the box with Redgate Monitor, we use custom metrics for our alerting and reporting. One good example is a metric that measures how many audit records were produced in the past week. Being able to graph this out on Monday morning and see if there have been any massive peaks or drops is really helpful.
We also have custom metrics in place to help with referential integrity. They’re able to tell us if something doesn’t look right and we can then notify the development team to check their code, which helps to prevent any issues further down the line.
It takes a while to set all the levels to what your systems need so you just get the alerts that matter, but it's worth the investment.
Getting to the root of the issue quickly
For me, identifying the cause of database performance issues is the biggest problem Redgate Monitor has solved.
When we have a performance issue, the first place I look is the wait stats history on the overview page for the server involved. That will tell me immediately what we’ve been waiting on that we don’t usually get impacted by, and the top ten queries that have been running for the past few minutes. Obviously, when there’s an alert for a long-running query or a blocking process, it makes it super simple for me. If it tells me that this one process is blocking 500 others, then I know where the problem is.
I also use Redgate Monitor’s analysis graph to find out database performance issues. For example, the other day something managed to clear most of our memory from cache. It was really easy to see what happened and then work back to find the query that used a lot of memory, and resolve the issue.
Reporting helps us meet requirements, and be proactive
With Redgate Monitor, we’re able to quickly spin up reports for different audiences. We produce separate reports for the management and software development teams with relevant metrics that help to show trends over time. I get a more detailed report each week which includes things like disk space, which helps me to determine if something needs to be done to prevent any issues.
We also use Redgate Monitor’s reports to help us meet industry quality standards. For example, in our industry, if customers are not buying from us, we need to contact them to find out why. With Redgate Monitor, we can schedule a report at the start of each month that shows how many customer surveys were sent out during the month, and how many responses we received.
Summary
Redgate Monitor is a product we love using. It tells us when something has gone wrong and it’s simple and quick to find what we’re looking for. For a team that doesn’t have a full time DBA, it’s priceless. I don’t know how I’d work without it.
This is a guest post from Greg Dodd, the Software Development Manager and Database Administrator at Redox. He enjoys finding IT solutions to business problems and working to ensure that Data and Applications are available and performing well.
If you’re new to Redgate Monitor and would like to see how it can help you monitor database performance issues, you can download a fully-functional 14-day free trial, or try our live online demo environment.
Tools in this post
Redgate Monitor
Real-time multi-platform performance monitoring, with alerts and diagnostics
You may also like

Blog
How to run a proof of concept that de-risks your monitoring decision

Blog
SQL Prompt Product Updates – April 2026

Blog
Loading comments...