Security and compliance
Ensure data security and compliance with monitoring and change traceability
Ensure data security and compliance with monitoring and change traceability
Monitor and understand your databases with full visibility into performance and change
Build, test, and deploy database changes with confidence
Simplify and speed up database development workflows
Prepare reliable data foundations for AI initiatives
Simplify and secure database modernization across platforms
Control costs and boost efficiency in database operations
Simplify and speed up cloud database transformation
Redgate Monitor helps you boost performance of your PostgreSQL databases and proactively avoid common issues with instant alerting, a comprehensive set of performance metrics, statistics, and built-in advice.
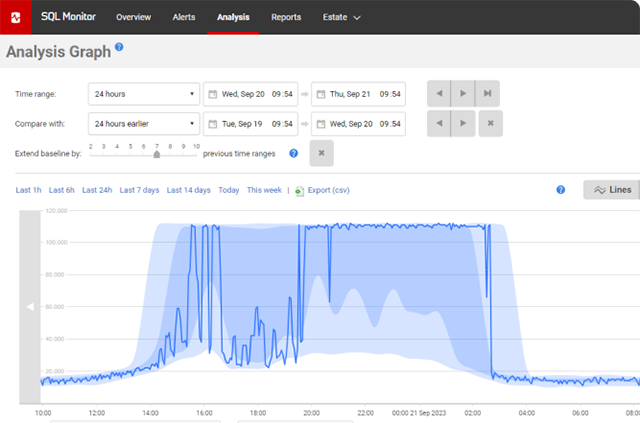
With Redgate Monitor you stay on top of all essential PostgreSQL performance metrics. Get both current and historic data of what is happening on your servers to quickly drill down into the root cause of problems. Proactively identify issues that could negatively impact your business and keep both internal and external customers happy.
“SQL Monitor lets us quickly know what the exact problem is so we can jump on it and fix it before the customer even notices.”
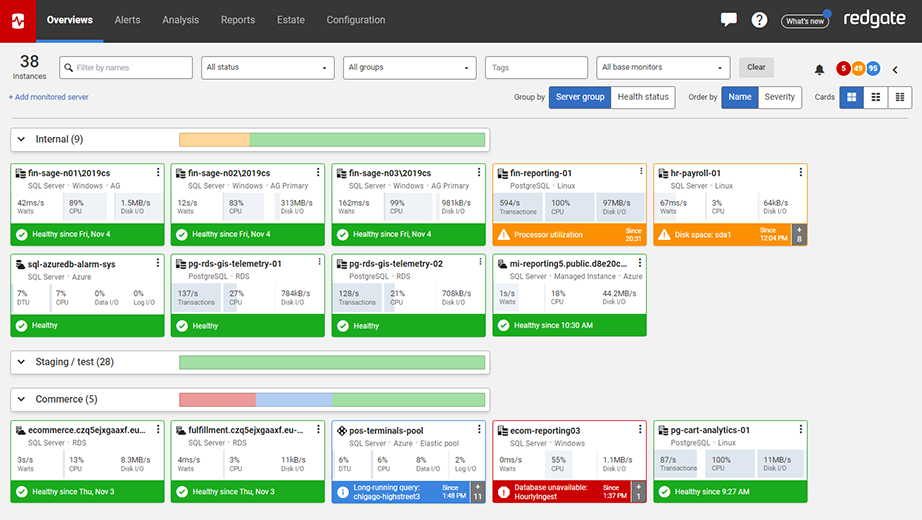
Get an at-a-glance view across your entire database environment. With Redgate Monitor, you can manage PostgreSQL instances right alongside SQL Server instances from the same interface.
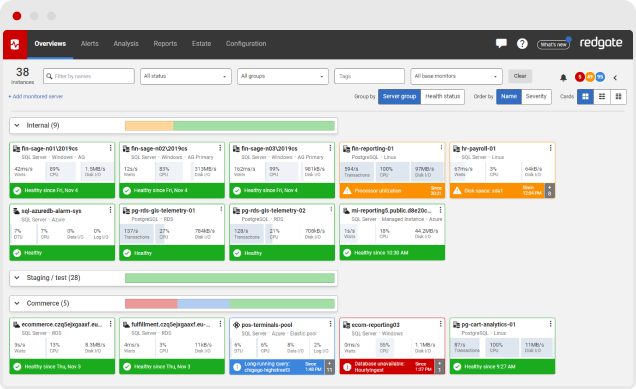
For metrics that are universal across database types, you’ll see them presented using standardized visualizations and logic. Enabling you to seamlessly support different environments without having to learn different systems or switching between applications.
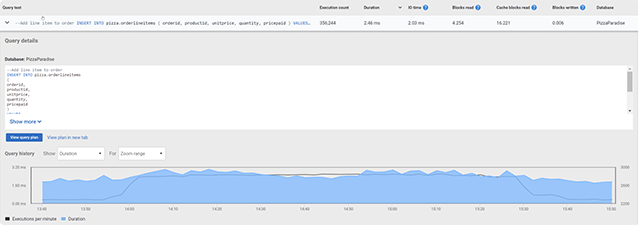
Don’t miss out on PostgreSQL problems with in-depth diagnostics to help with query tuning and performance issues. Whether it’s vacuuming, identifying expensive queries, database growth, connection limits, and more, Redgate Monitor has you covered.
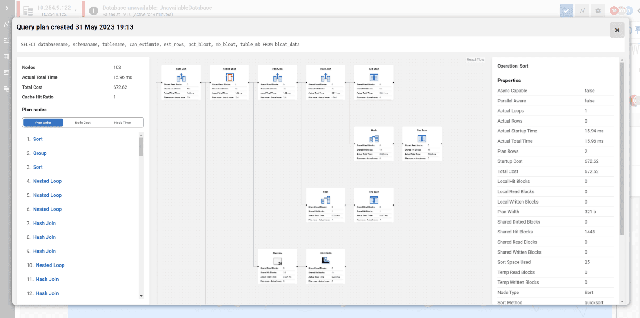
Redgate Monitor automatically tracks query performance statistics so you can quickly and easily identify issues and get actionable insights on the root causes.
Bottlenecks aren’t always obvious. Redgate Monitor helps you make informed decisions.
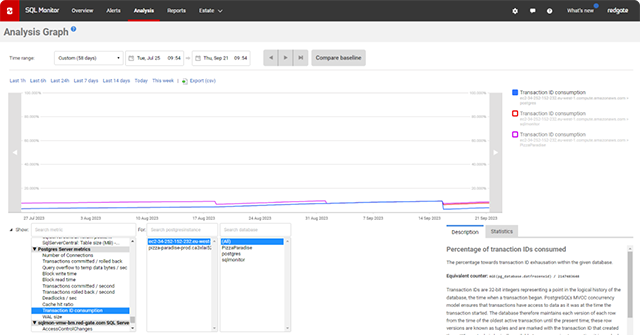
Improper vacuum maintenance is a risk to your PostgreSQL database performance and can even lead to catastrophic forced shutdown in extreme situations. With Redgate Monitor you’re able to spot signs of unhealthy vacuum performance and reveal areas of configuration improvements.
Learn more about Redgate Monitor, or reach out to a member of our Sales team to discuss how Redgate can help enable your business growth.
Redgate Monitor supports PosgreSQL V10+, on:

Whether you’re an experienced database professional, just starting your career or need to take care of databases on the side, Redgate Monitor gets you up and running quickly without sacrificing the depth of the diagnostic insights you need.

Redgate Monitor is built to scale with the ever-increasing growth in server estates and the complexity of how data is hosted. Once you start using Redgate Monitor, it will grow with your data and your needs.
Instead of just tracking issues, Redgate Monitor allows you to spot potential problems early, while you have time to plan the best response, rather than firefighting alerts as they occur.
Integration with deployment tools such as Redgate Flyway and the ability to provide developers access to the diagnostic data helps jointly understand the impact of deployments (e.g. on CPU) and improves collaboration between developers and DBAs.

We’ve specialized in database software for over 25 years and dedicate eight in-house development teams to continuously improve Redgate Monitor.
With various information and training resources and a big community of database professionals, we’re there to empower you get the most out of monitoring your servers.
Whether you want more details about Redgate Monitor, a demo or information on best practices – get in touch with us.

Redgate has specialized in database software for over 25 years. Our products are used by 92% of the Fortune 100. 200,000 customers rely on Redgate worldwide.

Redgate offers comprehensive documentation and a friendly, helpful support team. An average 87% of customers rate our support 'Excellent'.