Scaling Redgate Monitor to Large SQL Server Estates
Tony Davis describes the features and capabilities of Redgate Monitor that allow it to scale smoothly to monitor a growing estate of servers and databases, while still providing a single, simple dashboard that gives the team all of the essential SQL Server metrics and alerts, establishes baselines, and detects trends in behavior.
Most organizations are finding that the size and number of databases that need to be monitored is increasing, unlike the number of people available to do the work. Now that it is possible for the organization to scale out to cloud-hosted databases, the constraints of the available infrastructure have ceased to govern the growth of the database estate.
Redgate Monitor is designed to help you to cope with the demands of bigger databases and higher numbers of monitored SQL servers, because it supports multiple base monitors, and one base monitor will cope with up to 400 servers, with minimal overhead. Even for very large server estates, spread across different networks, the administration team still retain a simple picture of the overall health, performance characteristics, and security of the estate. This ensures they can still identify bottlenecks, check stress-points before they become problems, and assign priorities to problems.
Database problems rarely appear ‘out of a blue sky’. They generally make themselves known as symptoms, sometimes so slight as to be almost unnoticeable. Any good monitoring system can, of course, diagnose problems and alert the Ops staff, but can also analyze trends to predict future problems. This allows the team to shift from ‘firefighting’ issues as they occur, to being able to fix issues before they become the sort of problems that cause downtime, and the resulting ‘unplanned maintenance work’.
Following along
If you’ve not yet installed Redgate Monitor, you can take a tour of the Redgate Monitor web interface for SQLServerCentral.com, at http://monitor.red-gate.com. This is live-monitoring the SQLServerCentral.com SQL Server estate, issues and all, and you’ll be able to see in action all the features I describe in this article.
Lightweight monitoring
While the size and number of databases has grown, the size of the operations team generally hasn’t; the same team is expected to somehow scale their existing monitoring solution to cope with the extra demand. This is unfortunate for teams who’ve been using a combination of manual monitoring and custom-built automation, because these tools are often inherently high-overhead. They usually install intrusive Agents on the server, run frequent, complex data collection queries, set trace flags to capture ‘verbose output’, request ‘specialist’ metrics that are complex to collect.
By contrast, Redgate Monitor installs no agents and collects just a carefully curated set of diagnostics data for all the common causes of SQL Server-related problems. It resists the temptation to gather large volumes of data of only marginal value, that will simply overwhelm the team, at scale. Instead, it makes it very easy to add custom metrics to suite the requirements of each server and application.
This means that it a single monitoring service can collect and process monitoring data for big databases, and many servers, without adding appreciable overhead.
Distributed Monitoring
Since Redgate Monitor data collection is designed to be low-impact, you can add to the list of monitored databases without fear of overloading the system, even when the servers are in different data centers, or on different networks with distinct security protocols.
Redgate Monitor supports distributed monitoring via its multiple base monitor feature. Essentially, it means that it can support multiple base monitor stations to collect and process the data, one on each network domain. This will allow you to add servers to your estate, at each location, without needing to open ports to allows access to a remote monitoring service. This allows the team to scale out without introducing bandwidth, security and connection-related issues.
The monitoring data for each location can be sent to a single, web-based monitoring interface, so that the team retains a single view into what is happening across the entire estate. Each base monitor, in each of the three ‘domains’ shown in Figure 1, will typically scale to serve up to 400 monitored servers.
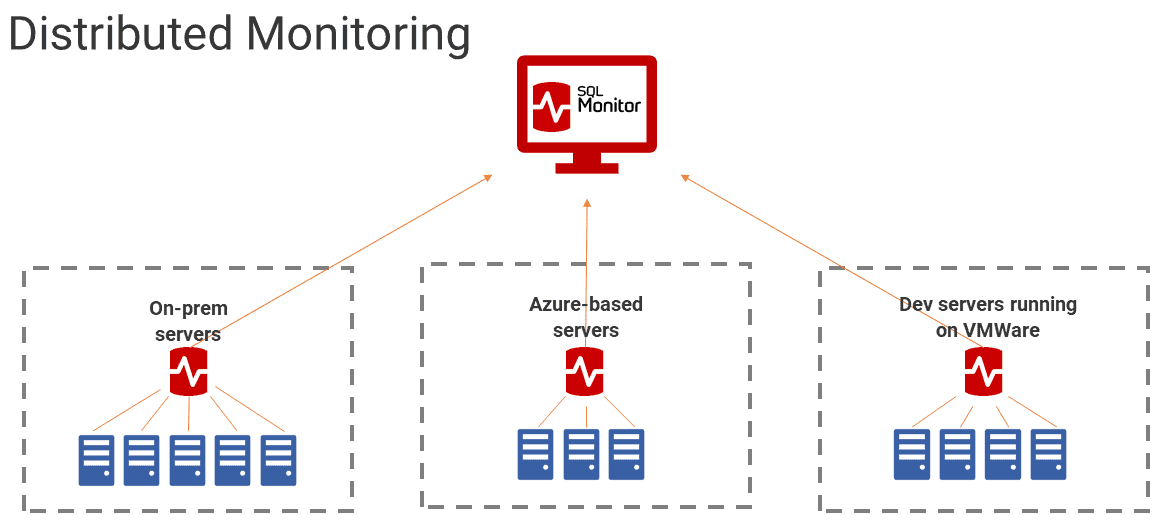
Figure 1: Distributed Monitoring with Redgate Monitor
Monitor Cloud-based instances and VMWare
Redgate Monitor makes it easy to add and monitor databases or servers running in the cloud, or on VMWare. It is as easy as adding any on-premise database server. Redgate Monitor 9 fully supports monitoring Azure SQL Database. You can read Grant Fritchey’s article for more details on this. It can also monitor Azure SQL Managed Instances (Preview) and Amazon EC2.
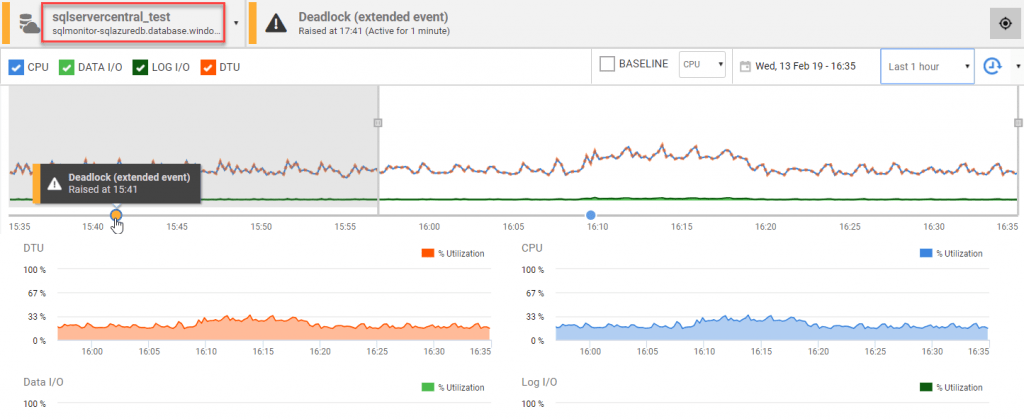
As an illustration of monitoring a cloud-based instance, Figure 2 shows the Overviews screen for an Azure SQL Database, showing a Deadlock event on the activity graph. Below it, you can see a DTU utilization metric, alongside the CPU Utilization metric, and then the data I/O and log I/O utilization metrics for the database. All these are expressed as a percentage of this database’s maximum allowable utilization. If a database reaches its maximum DTU quota, you’ll see query performance problems, with queries getting queued. Redgate Monitor allows you to track use of these resources and see quickly whether data I/O or log I/O is the constraint. It also provides built-in and configurable alerts on these metrics.
Figure 2: Monitoring Azure SQL Database
If you have servers running on VMWare, then simply enter details of the vCenter, or the ESXi host, if you’re running a standalone host, and Redgate Monitor will automatically detect any SQL Server instances controlled by it.
Adding and Grouping Servers
Redgate Monitor makes it very easy to import new SQL Servers into its care, regardless of platform, network or location. From the Configuration page of Redgate Monitor web interface, you can either add SQL Server instances individually, using +Add SQL Server, or you can bulk import a set of SQL Servers, on a given network, from a tab-separated text file.
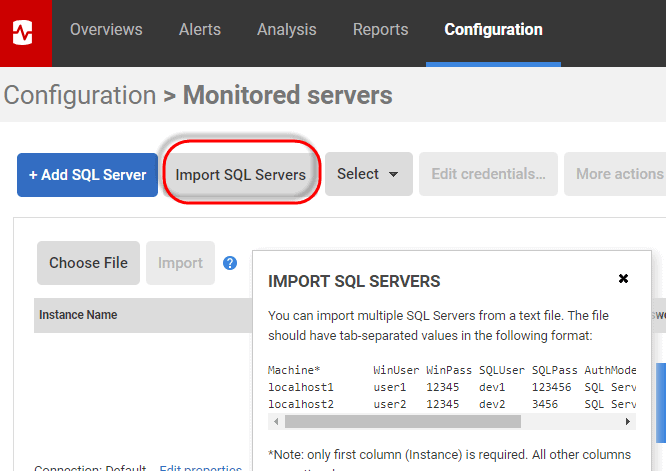
Figure 3: Importing SQL Servers
Redgate Monitor also makes it easy to categorize your servers into Groups that share a common set of properties or requirements for that group of SQL Server instances. For example, you might have common requirements for production servers, staging or test or development servers.
This makes management much easier, especially as the estate grows, since you’ll be able to filter the various views and summaries to show just one group, and you can also customize the alerts and settings, as required for that group.
Navigate to Redgate Monitor’s Configuration page (http://monitor.red-gate.com/configuration, or simply <Your_SQM_URL>/configuration, if you’re following along) to create your groups. Figure 4 shows the group used on sqlservercentral.com.
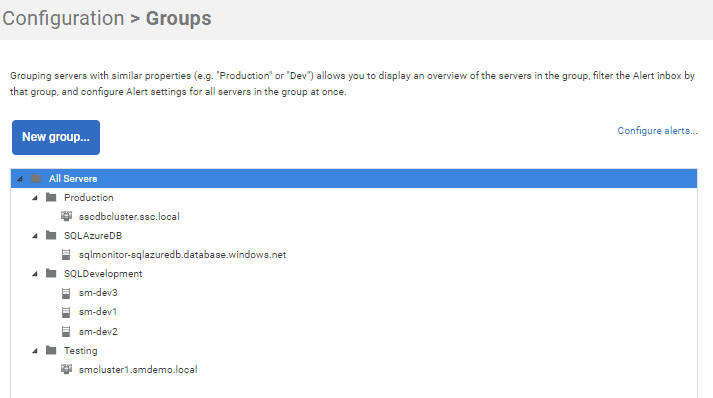
Figure 4: Creating Server Groups in Redgate Monitor
You can drag and drop existing servers into this new group, or you can add servers to the group manually from Configuration| Monitored-Servers.
You might choose to group your servers differently. You might decide to group according to the tier-level of support required by the business. Or, you might want to use the Grouping mechanism so that your server monitoring strategy reflects your organization’s data classification and protection policies. Having reviewed and classified the data you collect and store, you’ll know which servers and databases, across your estate, store commercially-sensitive data (CSD) or personally-identifiable information (PII), and so on, and which extra protection and monitoring mechanisms are required in each case.
A global dashboard for the server estate
If you’re a small team who must monitor a large estate, you need a monitoring dashboard that provides an easy-to-digest picture of activity and any issues, across all your monitored servers. Redgate Monitor’s Overview page, or Global Dashboard is the first screen you’ll see on starting up the tool, and it’s designed to provide this clear, bird’s-eye view, regardless of the size of your server estate.
It uses a tile-based display system in which each tile shows a monitored SQL Server instance or monitored Azure SQL Database. It displays servers by Group (displayed on the left) and a traffic-light color-coding system helps you spot issues, easily, as they happen in real time. If an issue arises on one of your instances that might compromise data integrity (such as a corruption issue), availability (e.g. an Availability Group isn’t sync’ing), or recoverability (e.g. failed backup job), you’ll know about it instantly because Redgate Monitor will raise a high-level alert and that instance’s tile will turn red. If important but non-critical warnings arise, the instance will be colored amber. Completely healthy servers will be green.
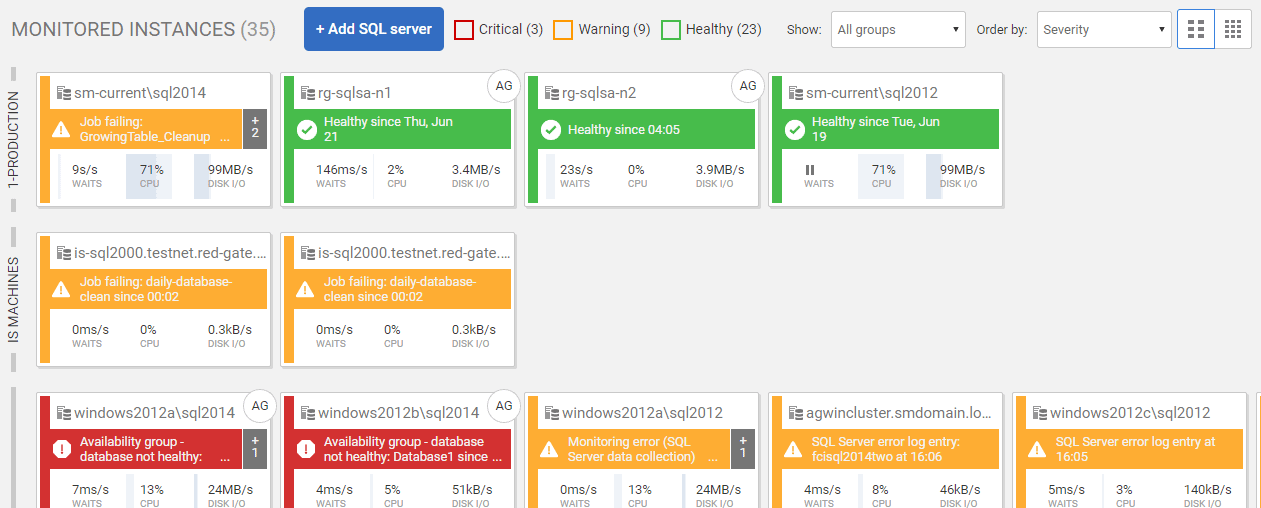
Figure 5: The global dashboard for your server estate
You can filter this view, for example viewing only instances on which critical alerts have been raised, or just the instances in a group, and you can order the instances by Severity status, or just by name. Figure 6 filters to show only the servers in the “PII” group. Medium level alerts, such as the Page verification or Job Failing alerts will require immediate attention, on a server containing sensitive or personal data.

Figure 6: Alerts raised on servers containing PII
The button at the top-right of Figure 6 activates the “small tile” view, which offers a useful “bird’s eye” view of the large estates.

Figure 7: The bird’s eye view of the estate
Estate-wide views and projection graphs
To move away from ‘firefighting’ and towards proactive optimization, your monitoring tool must allow you to predict the future value of a metric, based on the trend. If you are, for example, measuring changes on disk space usage over the entire estate, this will allow you to predict how much space you are likely to need in the months ahead.
Redgate Monitor 9 provides four estate-wide views and projections:
- Installed Versions: What SQL Server versions are running? Are the latest cumulative updates applied?
- Disk Usage: Will any storage volumes run out of space soon?
- Backups: Are all databases being backed up? Did all the scheduled backups complete successfully?
- SQL Agent Jobs: Are all other scheduled jobs running correctly?
Kathi Kellenberger describes each of these in her article, Using the Redgate Monitor Estate pages, so here I’ll only review briefly two of the pages.
Disk Usage
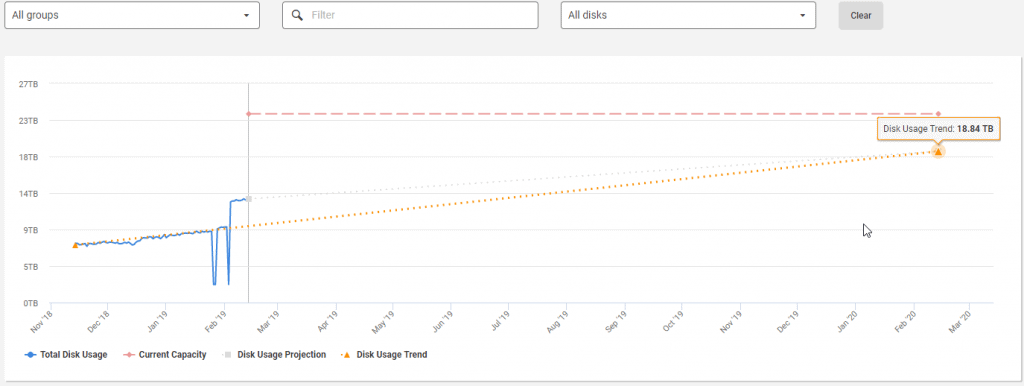
Figure 8 shows the data growth projection for the sqlservercentral.com SQL Server estate (Estate | Disk Usage), for disk capacity planning. By identifying trends in disk space usage, you can predict the need for additional resources before they ever become a problem.
Figure 8: Estate-wide disk usage and capacity projection
The graph shows the current total disk capacity, current total disk usage, and then shows the growth projection of the estate, over the coming year. The table below it lists data for individual disk volumes, starting with the one predicated to fill quickest. The warning triangle indicate volumes that will exceed their current capacity within the current projection.
Figure 9: Disk volume usage drill-down
The accuracy of these projections depends on the period for which you store historical monitoring data. By clicking on any of the disks, the team can see a detailed breakdown of space allocation on that disk, and investigate the which files, database-related or otherwise, are consuming the disk space. See Avoid running out of Disk Space ever again using Redgate Monitor for more details.
Installed Versions
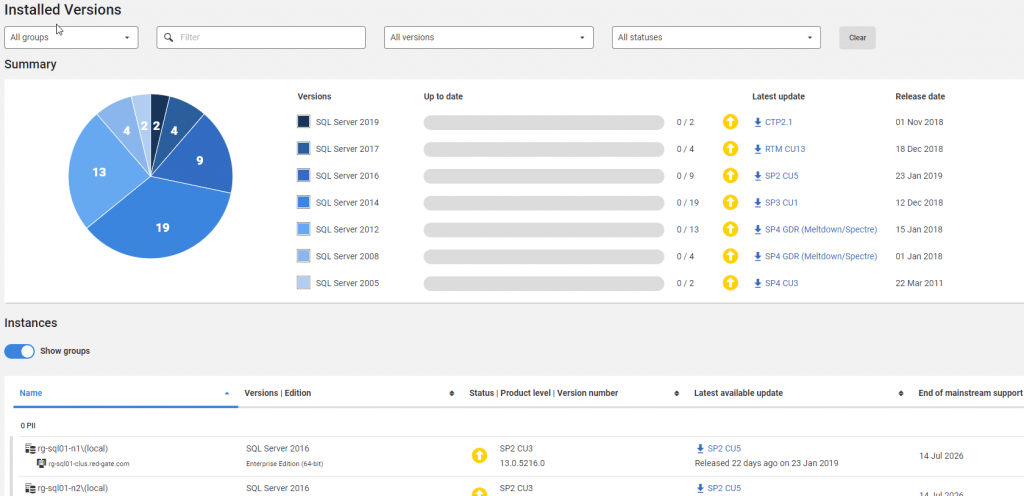
Any DBA needs to apply all necessary OS and SQL Server patches to ensure that their servers, and the data they store, are continuously protected. The Installed Versions estate wide view summarizes the versions and editions of SQL Server and Windows that are deployed on each of your instances, along with cumulative update and service pack information. When you’re monitoring a sizable number of servers, this will help you identify quickly any machines that aren’t up-to-date.
Figure 10: SQL Server versions, editions and patching levels
In Figure 10, you can see an example of an estate that has previously been poorly maintained in terms of patching and security, with every instance requiring some form of update some of which include very important security patches, including one, SQL Server 2012 SP4 GDR that fixes the Meltdown/Spectre vulnerability.
Diagnostic data in digestible form
DBAs love deep levels of detail, and with Redgate Monitor you can drill into the detail as far as you want, right down, for example, to the execution plans, and any associated wait events, for individual queries. However, this must never be at the cost keeping a weather-eye on the whole system. Whatever the level of detail, Redgate Monitor continues to collect and present the diagnostic data, so the overall monitoring strategy scales, without overwhelming the team with detail, or noise.
Redgate Monitor works hard to make the volume of diagnostic data ‘digestible’ even for very large numbers of servers and databases, with various visualizations, roll ups, groupings, and summaries of the data, to help your top spot issues quickly, and focus your tuning efforts profitably.
Let’s say a server’s CPU is “pegged”. Redgate Monitor’s Overviews page will immediately reveal the top 10 server processes and user processes, by CPU, over that period. Which processes hogged most CPU in that time slice. Do you recognize them? What databases were they accessing? In Figure 11, we can see several user-processes, what they were doing, and what database they were accessing. We know immediately where to drill in to find out what’s going on.
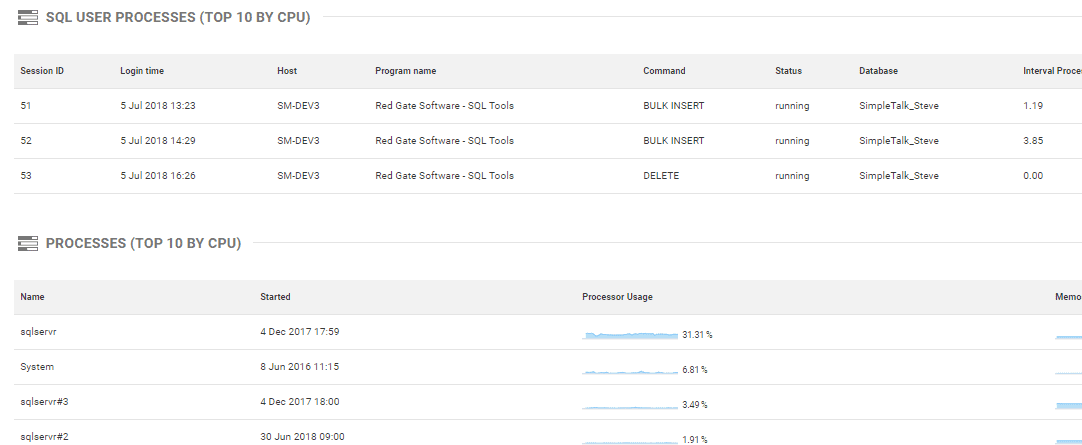
Figure 11: Top 10 server and user processes
Similarly, you’ll see quick views of the expensive queries running over that period (up to the top 50), top waits types experienced on the server and details of any blocking processes.
As you drill down, you’ll be able to view, for example, the Query History, i.e. how an expensive query has been performing over time, with any plan changes that could have affected query performance highlighted. You can also view execution plans and detailed performance metrics for individual queries. If blocking is occurring, you’ll see clear visualizations of the blocking chain.
From these high-level representations and summaries, you can drill into the details quickly and intuitively. This will give the team a fast response time to the issues that are raised, even at scale.
What changed? Analysis and baseline comparison
As the database estate grows, it is more and more important to quickly see if anything changed at around the time an issue was reported. I’ve often spoken to long-time DBAs who recall fondly the days when they both built and then maintained a small handful of SQL Servers. They would know each of these machines well, and spot in the blink of an eye, any resource usage pattern that deviated from ‘normal’.
This is impossible for a large and diverse server estate, so you need your monitoring tool to allow you to bridge the familiarity gap. If a user reports that the performance on their application was “slower than normal” that morning, your monitoring tool must allow you to answer several key questions very quickly. Was it slow? And if so, what changed? Were there any unusual patterns in CPU, IO or memory use or that period? What caused it? Was the number of user connections also abnormally high over the same period? Was there a deployment, planned or otherwise? Did someone in operations change a server setting?
These are hard questions to answer, unless you know what “normal” looks like; in other words, you can compare the resource usage patterns over the period the issue occurred, with baselines for the same period yesterday, for example, or for previous 7 equivalent periods.
With Redgate Monitor, you can use the Analysis screen to build and display graphs of various metrics over different time periods, and then the Compare baseline and Extend Baseline features to build up a picture of whether the server was experiencing unusual activity levels, or whether the resource spike is part of worrying trend, or whether it’s just “normal” behavior for that set of metrics during that period.
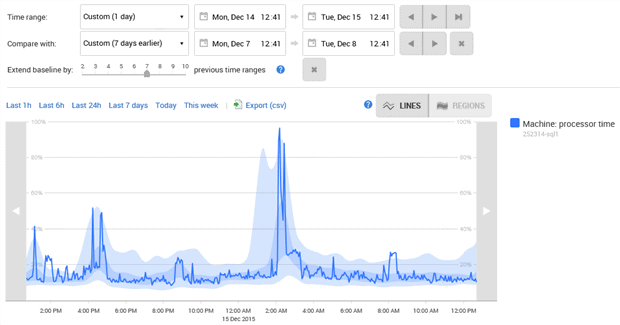
Figure 12: Using baselines
These features make it much easier to understand the impact of a deployment, either of a security patch, or of a set of application or database changes. On the server overview graphs, Redgate Monitor will also mark the occurrence of database deployments, although currently only those made by other tools in the SQL Toolbelt.
Scalable alerting
A monitoring system can easily break down when so many alerts are sent that the recipients are overwhelmed by them. As the estate grows, and alerts flood in, the team instinctively ‘protect’ themselves, by arranging that these alerts are diverted to a separate folder rather than going to their inbox. Of course, once that happens, the alerts tend to be quietly ignored.
A monitoring system can suffer one of two faults with alerts: on one hand it can be over-configured, raising too many alerts, and overwhelming the users with information. On the other hand, it can be under-implemented, missing important alerts, or raising alerts that don’t provide enough useful information to pinpoint the problem quickly and act.
With Redgate Monitor you can start small, covering just the essential alerts for your SQL Server instances, along with built-in alert thresholds that are easily configured. By using granular tuning, you can tweak the alerting strategy for different groups, servers, instances, databases, or even down to an individual job level. Each alert provides all the diagnostic data you need in order to act.
By grouping alerts, you can make the management of alerts much easier, when expanding the system. Fig 13 shows the Alert Inbox for a SQL Server instance, where rather than needing to review 438 individual alerts in the inbox, Redgate Monitor has grouped them, so we can see recurrences of the same problem, such as the same long running query, or the same blocking chain.
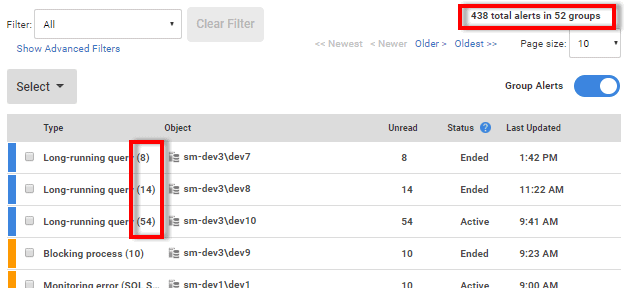
Figure 13: Grouped alerts
Redgate Monitor aims to make “just enough noise” that the right person or team is made aware of the issue, promptly, and can act on the information provided with the alert. Integration via SNMP into tools such as Slack, SCOM or other ticketing systems makes this easier, as well as offering visibility into certain issues to the wider business or IT teams.
Easily adapt the monitoring strategy
Teams that use Redgate Monitor soon get to understand what metrics expose most effectively the issues that commonly affect their systems, and what constitutes sensible threshold levels for any alerts. Redgate Monitor then allows them to adapt their monitoring and alerting strategy to cater for specific large estate requirements regarding security, performance, availability and so on. With Redgate Monitor, you can create a custom metric using any T-SQL command. To get you started, the sqlmonitormetrics.red-gate.com website provides some custom metrics contributed by users, as well as by the Redgate Monitor development teams.
For example, if you need to implement different security monitoring for certain servers, according to the data they store, you might choose to use one of the custom metrics in the GDPR, or Security or Auditing categories. On these servers, you should know exactly the number of Principals with sysadmin login, and set an alert if the count goes above this number. For servers that require strict auditing of activity, you can use a custom metric that will query the resulting audit files and return a count of the number of queries against the classified table, and you’ll be able to set an alert if there are sudden spikes in this number. You can create metrics that mine information from the default trace to monitor for events such as a login being added to a server role, or a database user being added, or from the SQL Server error log to track the number of Failed SQL Server logins to a server.
In the Security section, you’ll find custom metrics to monitor changes in permissions, users roles and logins, unauthorized changes to configuration settings, database drift and suspicious errors typical of a SQL Injection attack. If you’re interested installing any of these, these Product Learning articles describe in detail how they work.
Summary
The relative ease with which new cloud-based, containerized or virtual machine-based SQL Servers can be provisioned means that many estates are growing quickly. DBAs are increasingly finding that they can only manage their workload with the assistance of automated monitoring of the whole range of instances and databases in their care. One database-monitoring system must fit all and be expandable to monitor a burgeoning estate of databases.
Redgate Monitor has evolved to take on the drudgery of collecting the essential metrics, scanning logs, establishing baselines and detecting trends, leaving the DBA to do just the skilled work. It is lightweight in the burden it puts on what is monitored, and it can support multiple base stations to collect and process the data, so it can meet increasing or fluctuating demands for operational work to support a large SQL Server estate.
Tools in this post
Redgate Monitor
Real-time multi-platform performance monitoring, with alerts and diagnostics
