Product articles Redgate Monitor

Why Redgate Monitor is the ultimate solution for your database monitoring requirements
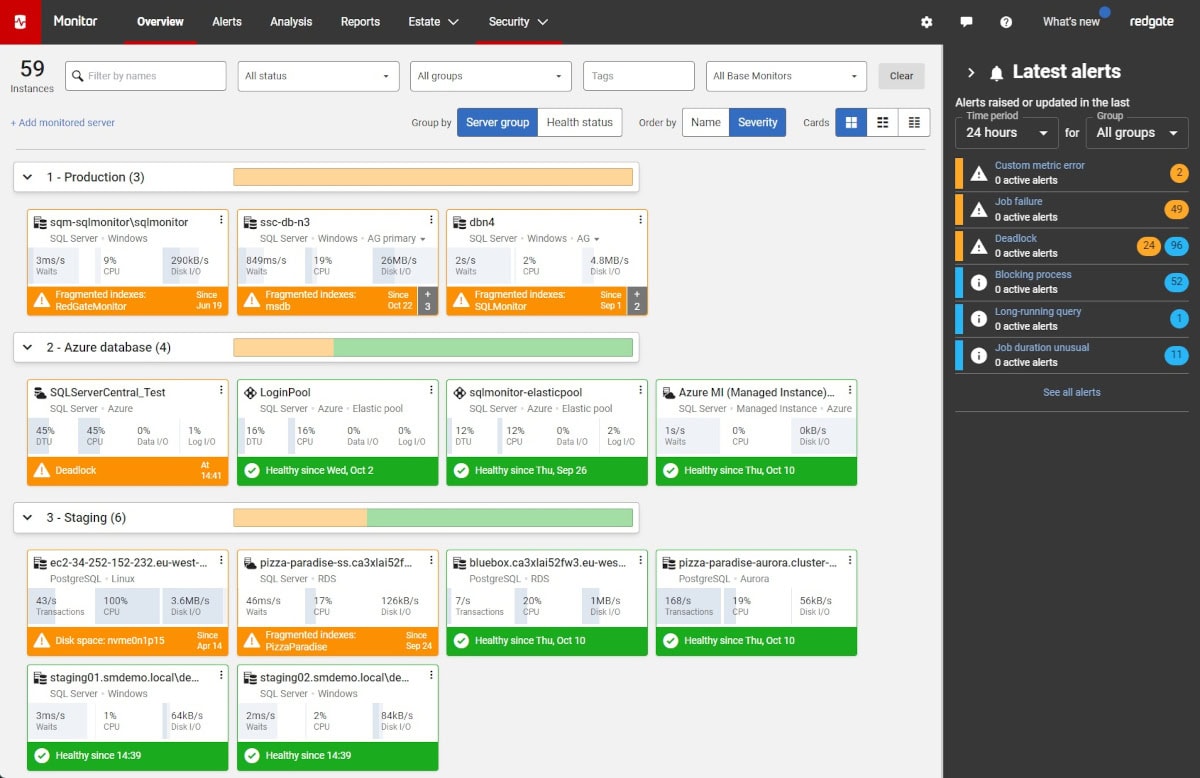
In today’s fast-moving digital landscape, ensuring the health and performance of your databases is more critical than ever. Redgate Monitor stands out as a leading solution designed to help you manage your entire database estate with ease and efficiency. Comprehensive monitoring capabilities Redgate Monitor offers a single pane of glass view of all your servers, Read more
Monitoring your Servers and Databases: SCOM and Redgate Monitor
With simple integration, SCOM and Redgate Monitor combine breadth and depth, infrastructure-wide observability plus SQL Server insight. The result is faster incident response, smarter use of DBA time, and monitoring that scales with growth and new technologies. Read moreCut SQL Server Licensing and Cloud Costs by Monitoring CPU Overallocation
Avoid paying for unused CPU power, on-prem or in the cloud. This guide shows how to use Redgate Monitor to identify overprovisioned SQL Server VMs, reduce licensing and compute costs, and ensure your workloads still run smoothly. Read moreQuery Executions in Redgate Monitor
Query Executions in Redgate Monitor captures individual query executions for long-running queries, providing deeper insight into database workload and resource usage. This helps DBAs diagnose performance issues with greater accuracy. Read moreDynamic Alerting on Processor (CPU) utilization
This article explores dynamic alerting, what it means, why it matters for DBAs, and how it works in Redgate Monitor. Learn how machine learning-driven thresholds increase alert relevance, helping teams focus on real performance issues while saving DBAs time. Read moreMonitoring Database Security and Compliance alongside Performance
Managing database security, compliance, and performance across a complex estate is no easy task. Redgate Monitor Enterprise brings all the data you need into one place. This article explores how it helps DBAs track user permissions, ensure configuration compliance, create custom reports, and implement resilient high-availability monitoring. Read moreUnderstanding PostgreSQL’s Cache Hit Ratio
This article explores PostgreSQL's buffer cache hit ratio (BCHR), a metric tracked by Redgate Monitor to help you assess the health and performance of your databases. By correctly interpreting this ratio and using it with other relevant memory and IO metrics, you can identify potential bottlenecks in query execution before they impact users. Read moreBetter Database Incident Management with Redgate Monitor
This article demonstrates how Redgate Monitor helps teams manage database incidents efficiently, by providing the right data to the right people, at each stage of a tiered incident response system. With fewer distractions from routine issues, specialist staff can focus on core tasks while teams resolve problems faster and prevent future disruptions. Read moreCurrent Activity for PostgreSQL in Redgate Monitor
Current Activity for PostgreSQL in Redgate Monitor provides a real-time view of queries currently running on your PostgreSQL instances. It will allow you to identify quickly any queries that are currently causing blocking and resource contention issues on an instance. Read moreRedgate Hub
-

Product Articles
Tips and how-to guides for Redgate products
-

University
Easy to follow video courses
-

Events
Join us online, or get sponsored
-

Forums
Ask, discuss, and solve questions about Redgate's tools
-

Community
Develop your skills and meet Redgate Advocates and Friends
-

Simple Talk
In-depth articles and opinion from Redgate's technical journal