Using Redgate Monitor Groups in PowerShell
Not only are Redgate Monitor Groups probably the neatest and most maintainable way of ensuring that all your SQL Servers have the best possible configuration of alerts, but they represent a powerful way of categorizing your SQL Server estate. In this article, I'll show how to use the Redgate Monitor PowerShell API to export these groups, save their settings onto a configuration management system, or compare groups of settings to see the differences between them.
Placing your SQL Servers into Groups forces you to think about the sort of alerting and notification that you need for different categories of SQL Server machines or clusters, and so provide a natural and obvious way of organizing the entire estate into manageable divisions. This categorization will vary considerably between organizations, but Redgate Monitor presents a versatile system to manage it. In this article, I hope to give you a hint of the potential of this API.
The value of Groups for organizing monitored objects
When you set up a whole lot of SQL Servers to be monitored, you are likely to have a few variations in the way that you set up the alerts. Production servers, for example, will probably be on different host machines but you will want a standard way to assign to them the same alert settings. Conversely, those servers in the development area, used for all sorts of stress tests, don’t need many alerts, and you’ll only want to be bothered for certain issues, such as Backup.
Although it is possible to configure the alerts separately for each server, via the Redgate Monitor web interface, you’d soon tire of the task. Instead, we create Groups of servers that are likely to require the same alerts and thresholds, and the same notifications and email addresses. By using Redgate Monitor Groups and assigning whatever you are monitoring to an appropriate Group, you can more easily apply similar alert configuration settings to SQL Servers.
You can add machines or clusters to a Group (but not, currently individual instances). Once you have assigned your servers to a group, you can use it as a filter for the Global Overview page and Alert Inbox. You can also configure alert settings at the group level. Everything in that group inherits these settings unless they have been specifically customized at a lower level.
You can move one group into another so that it becomes a subgroup. These subgroups can be nested to whatever depth you need. Each subgroup inherits all alert settings from the group above, but you can over-ride the inherited value for that subgroup so that each group in the hierarchy can be customized separately. An obvious use for this would be to assign a different contact address, for the alert recipient, for different subgroups of production servers. You would just create as many subgroups as you need and tweak the notification settings for the subgroup. You then move the server between subgroups according to who is to receive the alerts
Using the Redgate Monitor PowerShell API with Groups
The Redgate Monitor PowerShell API currently allows you both to send messages about SQL Server changes to Redgate Monitor, and perform “bulk configuration” of alerts. The intent of the latter is to make it much easier to implement and then fine-tune an alerting strategy for a large set of monitored servers, such as all servers and instances in a Redgate Monitor Group. We can also now script any type of alert, and their notifications, for any type of monitored object (Machine, SQL Instance, Cluster, Availability Group, Azure SQL Server, Azure SQL Database, Job and Azure Elastic Pool). So, for example, you can script out which alerts be enabled for any machine in a Group, their threshold settings, and who should be notified of each type of alert, and where to send alerts for each severity level.
Of course, this also means that one can read these alert settings into PowerShell, for reporting, and save them to disk, under version control. That way, it is easier to track changes, and have a record of the way that the tool is set up in case of mishap or disaster. In this article, we’ll look at how you report the alert settings from groups, as well to compare settings between two groups.
If you haven’t done so, you’ll need to install the PowerShell module. I covered the process in my Tagging SQL Server Changes article, but briefly:
- Download the Zipped Redgate Monitor PowerShell module from Redgate Monitor’s Configuration pane.
- Start PowerShell in Admin mode, determine where your module paths using
$Env:PSModulePathand select either the first path (personal) or second path (all users). - In this directory for PowerShell modules, create a subdirectory called RedgateSQM and copy into it the module file. Then unzip it into the directory
- In a new PowerShell window, not in administrator mode, make sure that you can import the module without error, using
Import-moduleRedgateSQM
Save group alert settings to disk
The following PowerShell script will save all the alert settings and notifications for your groups and subgroups to disk, as JSON files, in GitHub. You’ll need to fill in, as parameters to the Connect-SqlMonitor cmdlet, the URL address to the base monitor and the authtoken you’ve gotten from the Redgate Monitor user interface. You’ll also need to specify in $pathToAlertSettingFiles the part to the directory where you wish to store your files. In my case, this will be a source control directory.
|
1 2 3 4 5 6 7 8 9 10 11 12 13 14 15 16 17 18 19 20 21 22 23 24 25 26 27 28 29 30 31 32 |
Import-module RedgateSQM Connect-SqlMonitor -ServerUrl 'https://MySQLMonitorURL' -AuthToken "MyAuthToken" <# fill in params! #> $pathToAlertSettingFiles='MyPath\settings' <# fill in valid absolute path #> $oldverbose = $VerbosePreference #$VerbosePreference = "continue" <# firstly, we need to get all the 'monitoredObject' objects corresponding to each group #> $Groups = Get-SqlMonitorMainGroups| <# get the first-level main groups and stream through pipeline #> select @{ label = 'Group'; expression = { $_ } }, @{ label = 'checked'; expression = {$false} }; <# we have added an extra attribute because we need it to get the subgroups #> $UncheckedGroups=$groups <# none of them have been checked #> while ($UncheckedGroups.count -gt 0) <# we need to check each group in case it has a subgroup #> {$Groups.ForEach({ $_.checked=$true}); <# flag the original collection as having been checked#> $Groups+=$UncheckedGroups|foreach {Get-SqlMonitorSubGroups -Group $_.Group}| select @{ label = 'Group'; expression = { $_ } }, @{ label = 'checked'; expression = {$false} }; <# check every unchecked group for subgrops and add them to the list of groups #> $UncheckedGroups=$groups|where checked -eq $false <# and add the new groups to the unchecked list#> } <# end of the loop gathering all the subgroups #> $Groups.group| foreach{ <# process each group #> $Group=$_; <# save the monitoredObject object which will be used within a subsequent pipeline #> $MyAlertSettings = @(); if ($group.GetType().BaseType.Name -eq 'MonitoredObject') { <# we go through all the alertType settings, gathering the settings for the current group #> $MyAlertSettings += $AlertTypes.GetEnumerator() | sort-object name -Unique| foreach{ $AlertType = $_; Get-SqlMonitorAlertSettings -monitoredobject $Group -AlertType $_.value -ErrorAction Continue }| select @{ label = 'AlertType'; expression = { $AlertType } },<# record the alert type #> @{ label = 'Settings'; expression = { $_ } };<#and all the alert settings we've collected#> @{'Group'= @{'Name'=$group.name;'BaseMonitor'=$group.basemonitor.name;};'Alerts'=$MyAlertSettings } | convertTo-json -Depth 4 >"$pathToAlertSettingFiles\SQLMonitorGroupSettings$($Group.Name).json" } } |
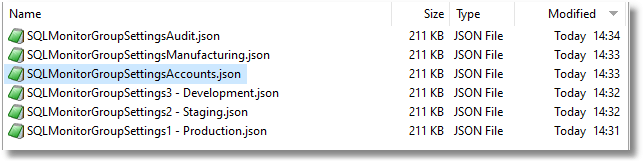
This will take some time to execute, but when it is finished you should see something like this (I added a few subgroups for testing purposes) ….
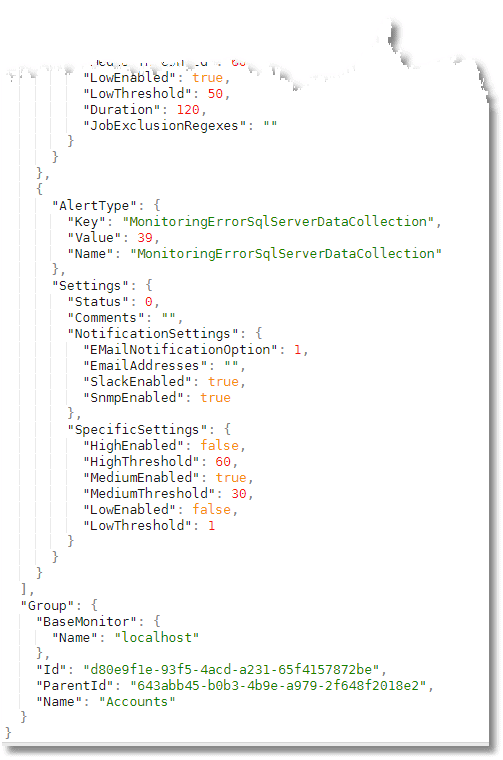
And here is a sample of the contents of a file:
This is, I reckon, the simplest way of saving the settings.
Getting the alert settings for an instance
You can, of course, get the alert settings for any monitored object (MonitoredObject), meaning anything that can be monitored by Redgate Monitor. Here, as an example is code for saving the alert settings for each instance. The initial lines connecting to the Redgate Monitor base monitor, and so on, are the same as above.
This code will take a very long time if you have a lot of instances. If you have more than ten instances, you’ll need to run a version with filters, which I show after this one:
|
1 2 3 4 5 6 7 8 9 10 11 12 |
Get-SqlMonitorMachine | Get-SqlMonitorInstance | #get all monitored instances foreach{ <# for each monitored insatance, get all the appropriate alert settings #> $instance=$_ $MyAlertSettings = @() <# we go through all the alertType settings, gathering the settings for the current instance #> $MyAlertSettings += $InstanceAlertTypes.GetEnumerator() | foreach{ $AlertType = $_; Get-SqlMonitorAlertSettings -monitoredobject $instance -AlertType $_.value -ErrorAction Continue }| select @{ label = 'AlertType'; expression = { $AlertType } },<# record the alert type #> @{ label = 'Settings'; expression = { $_ } };<#and all the alert settings we've collected#> @{'Instance'= $Instance;'Alerts'=$MyAlertSettings } | convertTo-json -Depth 4 >"$pathToAlertSettingFiles\SQLMonitorInstanceSettings$($Instance.Name).json" } |
And this is the version if you have a lot of machines. You will need to tweak the filters to suit! This collects the settings for the default SQL Server instance on all the machines beginning with ‘A’:
|
1 2 3 4 5 6 7 8 9 10 11 12 |
Get-SqlMonitorMachine |WHERE name -like 'A*'| Get-SqlMonitorInstance | where Name -like '(local)'| #get all monitored instances foreach{ <# for each monitored insatance, get all the appropriate alert settings #> $instance=$_ $MyAlertSettings = @() <# we go through all the alertType settings, gathering the settings for the current instance #> $MyAlertSettings += $InstanceAlertTypes.GetEnumerator() | foreach{ $AlertType = $_; Get-SqlMonitorAlertSettings -monitoredobject $instance -AlertType $_.value -ErrorAction Continue }| select @{ label = 'AlertType'; expression = { $AlertType } },<# record the alert type #> @{ label = 'Settings'; expression = { $_ } };<#and all the alert settings we've collected#> @{'Instance'= $Instance;'Alerts'=$MyAlertSettings } | convertTo-json -Depth 4 >"$pathToAlertSettingFiles\SQLMonitorInstanceSettings$($Instance.Name).json" } |
Aha! I hear you say. That collection of alerts is different. For a Group, you used the $AlertTypes and now, for an instance, we use $InstanceAlertTypes. OK. The Module RedgateSQM provides many collections of alerts, each of which are appropriate for a different monitored object. With Groups, all the alert types are necessary because you can put a cluster, instance, Job, Elastic pool or whatever in a group.
It is probably time to map out these monitored objects and give some sort of indication of the types of alert that are relevant to each type of monitored object.
The Redgate Monitor MonitoredObjects
Each of these monitored objects has its own object type, so in PowerShell you must get them from their parent MonitoredObject. This means that the base monitor is always the starting point. From the Base monitor, you can fetch collections of groups, clusters, machines and Azure SQL Servers. From one of these four types of MonitoredObject, you can get the instances, disks, elastic pools and availability groups. You get the jobs and databases from the instance.

Getting the database alert settings
It looks like a long pipeline to get the alert settings for each database but, in fact, if you just want every database, you simply provide no parameters at all. In this code, you can save the alerts for every database to disk. Notice that we need to use the $DatabaseAlertType list of alert types. If you try to use a different list, you’ll get an error when you specify an alert that is not associated with a database.
|
1 2 3 4 5 6 7 8 9 10 11 12 |
<# Get all Database settings for every monitored database and save to disk #> Get-SqlMonitorDatabase -pv Database| #get all monitored databases foreach{ $MyAlertSettings = @() $MyAlertSettings += $DatabaseAlertTypes.GetEnumerator() | foreach{ $AlertType = $_; Get-SqlMonitorAlertSettings -monitoredobject $Database -AlertType $_.value}| select @{ label = 'AlertType'; expression = { $AlertType } }, @{ label = 'Settings'; expression = { $_ } }; @{'database'= $Database;'Alerts'=$MyAlertSettings } | convertTo-json -Depth 4 >"$pathToAlertSettingFiles\SQLMonitorDatabaseSettings$($Database.Name).json" } |
Comparing the settings between two groups
With the PowerShell module it is relatively easy to compare the settings for the alerts of two different groups. With a few alterations, you can do the same trick with any two objects of the same MonitoredObject type, such as two instances or two clusters.
The easiest way of doing this on an ad-hoc basis is probably to compare the JSON representation of two different groups (or whatever) with a Diff tool or differencing file-viewer. However, if this becomes a routine, then it is best automated. Here is a PowerShell script that does it for you. Remember that you must specify, in the first line, the two Redgate Monitor groups you wish to compare. You must have the module loaded and be connected to the base station.
|
1 2 3 4 5 6 7 8 9 10 11 12 13 14 15 16 17 18 19 20 21 22 23 24 25 26 27 28 29 30 31 32 33 34 35 36 37 38 39 40 41 42 43 44 45 |
cls <# in this first line, list the two Redgate Monitor groups you wish to compare #> $Groups = Get-SqlMonitorMainGroups | where { $_.name -in '1 - Production', '3 - Development' } if ($Groups.Count -ne 2) { throw 'We couldn''t find both groups to compare them' } $Reference = $Groups[0] $comparison = $groups[1] <# save the monitoredObject objects #> <# we go through all the alertType settings, gathering and comparing the settings for them #> $AlertTypes.GetEnumerator() | <# for each alert type #> foreach{ $AlertType = $_; $AlertTypeName = $_.Name; <# for convenience and diagnostics #> $ReferenceAlerts = Get-SqlMonitorAlertSettings -monitoredobject $Reference -AlertType $_.value $Comparisonlerts = Get-SqlMonitorAlertSettings -monitoredobject $Comparison -AlertType $_.value <# make a general check to see if there is any difference. #> if (($ReferenceAlerts | Convertto-json) -ne ($Comparisonlerts | ConvertTo-json)) { <# if there is a difference detected #> $ErrorMessage = "$alerttypeName had a difference" <# prepare an information message #> $ReferenceValues = $ReferenceAlerts.psobject.Properties | foreach{ <# get all the refrerence values in a list #> if ($_.TypeNameOfValue -in 'NotificationSettings', 'SpecificAlertSettings') { $_.Value.psobject.Properties } <# break objects into their values #> else { $_ } } $ComparisonValues = $Comparisonlerts.psobject.Properties | foreach{ <# get all the comparison values in a list #> if ($_.TypeNameOfValue -in 'NotificationSettings', 'SpecificAlertSettings') { $_.Value.psobject.Properties } else { $_ } } <# Now we can just walk through them and compare values #> (0..$ReferenceValues.Count) | foreach{ if ($ReferenceValues[$_].TypeNameOfValue -eq 'System.String[]') { <# These are a problem becausae of false positivesd #> $lside = $ReferenceValues[$_].Value; $rside = $ComparisonValues[$_].Value; $truth = ("$rside".Trim() -ne "$lside".Trim()) }<# simple values are easy #> else { $truth = ($ReferenceValues[$_].Value -ne $ComparisonValues[$_].Value) } if ($truth) { $ErrorMessage += "`n`t value of $($ReferenceValues[$_].Name ) ($($ReferenceValues[$_].Value)) is different from $($ComparisonValues[$_].Name ) ($($ComparisonValues[$_].Value)) " } } Write-warning $ErrorMessage } } |
This gives the following result on my system:
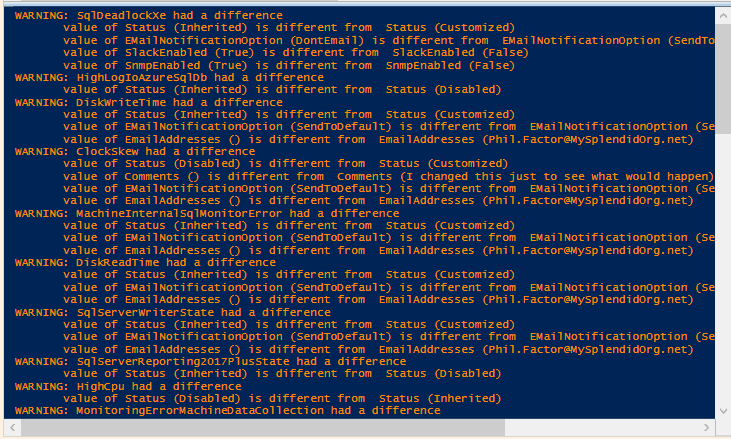
I’ve sent it to the Warning output stream just for my own convenience. You’d probably want to write this to a file. You’ll see that I’ve just listed the values that have changed and the name of the variable for the alert type that has changed.
Conclusions
The PowerShell module for Redgate Monitor is already useful but has a great deal of potential for extending the use of Redgate Monitor. Probably, the most immediate use for the PowerShell module is to suspend monitoring on a server or instance while it is being maintained or updated. However, there are other useful features. I’ve already written about Annotations, which are driven by the PowerShell module. I already find the use of PowerShell for investigating the alerting system to be useful. Not only can I save settings to source control, but I can also check on the differences in settings. It is also possible to update notification settings and change alert settings and their comments.
There is plenty more in PowerShell. It is already possible to add new monitored objects, such as SQL Servers automatically, check on their status, suspend them and remove them from the list. Naturally, I’d like to do a whole lot more because I’m an enthusiast for automating boring database jobs.
Tools in this post
Redgate Monitor
Real-time multi-platform performance monitoring, with alerts and diagnostics
You may also like
-

Article
Seeing the Bigger Picture: What technical leaders can learn from evolving monitoring needs
A preview of leadership insights shaped by real-world experience Estate-wide clarity for leaders who still need technical depth As data estates grow, the role of technical leaders changes. Visibility becomes harder. Communication becomes more important. Decisions have broader consequences. Many leaders start their careers focused on the technical details. Over time, they become responsible for
-
Article
Better Database Incident Management with Redgate Monitor
This article demonstrates how Redgate Monitor helps teams manage database incidents efficiently, by providing the right data to the right people, at each stage of a tiered incident response system. With fewer distractions from routine issues, specialist staff can focus on core tasks while teams resolve problems faster and prevent future disruptions.
-
Article
Troubleshooting Blocking in SQL Server using Redgate Monitor
Redgate Monitor tells us immediately when significant blocking occurs, and where, during busy periods, and provides the full blocking chain, in an easy-to-digest graphical format, so we can diagnose and resolve the blocking quickly.
-

Article
Layers of Trust: How to Protect Financial Data from the Inside Out
This article was featured in Financial IT Winter Edition 2025. Read the full magazine here. Prior to working for a software company, I spent most of my career working for financial organizations. I have lots of friends who still do. Talking with one the other day, the question came up, what keeps you up at
-
Livestream
What's new in database monitoring
Database estates are increasingly complex. Their size and scale, diverse database technologies, increasing security and regulatory requirements, the rise of the cloud…The list goes on. Redgate is at the forefront of recognizing and delivering solutions to these challenges, with 6 dedicated development teams working tirelessly to streamline your database monitoring processes. We invite you to


