Monitoring your Servers and Databases with New Relic Infrastructure and Redgate Monitor
New Relic Infrastructure is a capable server monitoring tool but adding Integrations provides only 'bare bones' monitoring for SQL Server. Grant Fritchey argues that to "instrument" a complex system such as SQL Server, effectively, you also need a tool that is built specifically for this purpose.
New Relic Infrastructure will ‘instrument’ your servers and operating systems, meaning that it should provide enough information about all the important server components and processes to enable you to review their performance and, when necessary, determine the sequence of events that led to a problem or failure.
Via its array of Integrations (Agents), you can extend New Relic Infrastructure to monitor SQL Server, plus a range of other database systems. This has obvious appeal if you’re in a situation where you need to monitor Couchbase as well as Cassandra and SQL Server, because New Relic can provide a good mechanism for collecting all that data in a single location.
So, given this, do you also still need a dedicated monitoring tool for SQL Server, such as Redgate Monitor? As a DBA, I’d argue that you do. The MSSQL Integration for New Relic Infrastructure is, on its own, insufficient. You’ll know if the server and instance are online or offline, and some general behavior of the system, but the necessary details to understand system behavior and troubleshoot when that behavior goes wrong aren’t there. You can add some of them through the creation of custom metrics, but this adds quite a bit of work to the implementation of the tool.
Conversely, a dedicated SQL Server tool will not only alert you to issues, but also provide all the deeper, supporting information that will allow a DBA to track down the source of a complex performance issue and resolve it quickly. If should also present this data in a way that is intuitive and accessible so that it provides the right level of detail to allow a first responder to decide how to act when problems arise, or who to inform. With a large server estate, some or most of the time, the people doing the first line monitoring won’t have deep domain expertise.
If a SQL monitoring tool provides all the necessary data to understand the cause of a problem, in a way that is easy to understand, then it is also one that extends easily beyond production. Your developers can use the data too to monitor their development and test servers, and suddenly you have a DevOps collaboration tool, and a route to the best form of proactive monitoring, which is detecting and stopping problems before they even get to production.
How New Relic Infrastructure works
I’ll sketch only briefly how New Relic Infrastructure works; you can read the documentation for the details. It is agent-driven software for collecting metrics, event data, and log data for your server infrastructure and its services, so that you can quickly review and diagnose the cause of any problems. Rather than store the collected data in local databases, it sends it up to the ‘new relic cloud’ for analysis. It has a Web UI (https://infrastructure.newrelic.com/) for consuming and managing the data you collect. You can aggregate the data, calculate averages, and display the various reports and graphs in its dashboard. It will establish baselines for each metric, for normal behavior, and can send alerts on deviation. You can apply tags to the collected data, for filtering, and the event data can be queried using New Relic Insights.
The New Relic Infrastructure agent collects data describing the state, health and performance of your servers, processes, storage, and network. It will also collect event data relating to changes in ‘inventory’ on the server, such as a package or setting being modified, a service stopping or starting, a user session connecting, and so on. In theory, this means you can correlate server load and resource use metrics (CPU, IO, memory and so on) directly with system load and system changes at that time. Similarly, New Relic collects information from your various sources of log data, which you can view alongside the rest of your collected data.
The agent collects a standard, default set of server-level diagnostics, although you can also create custom events, add custom attributes to existing events and so on. Each event contains key-value pairs called attributes, which are reported as metrics such as cpuPercent, memoryUsedBytes, diskUsedPercent and so on. For each event, it samples the data periodically, packages it into an event object and sends it to the New Relic collector.
However, to monitor a complex service, such as SQL Server, requires a more specialized set of metrics. To extend New Relic Infrastructure’s base set of server metrics, you use the appropriate on-host integration. In short, you install an additional agent that will collect a pre-defined set of metrics for that service, which you’ll be able to view, filter and analyze in the UI dashboard, alongside your server metrics and other data. You can also add cloud integrations which require no local installation, and simply connect you cloud account (e.g. for Amazon Web Services) with your New Relic account.
Monitoring SQL Server with New Relic Integrations
To get started monitoring a SQL Server instance with New Relic, you need to install an additional agent, the MSSQL monitoring integration agent, on your server. You’ll need to create a SQL Server login and user on the host instance, which New Relic will use to access the databases to be monitored, retrieve instance-level diagnostics (such as from Dynamic Management Objects) and so on. This login does not require sa privileges and the previous link provides a set-up script.
Next, install the Agent. As with all New Relic agents, its behavior is controlled and fine-tuned through a simple YAML file, so you just need to reconfigure the YAML to point it to your instance (again, the docs provide an example). The Agent also needs a connection back to your New Relic account, through a GUID supplied from your New Relic server. Frankly, with just a little bit of YAML editing, after downloading the appropriate agents, you can quickly and easily get some core level of SQL Server monitoring set up and running in New Relic.
With the agent installed, the YAML configured, and an appropriate login in place, when you restart the infrastructure agent, New Relic starts capturing SQL Server metrics. It’s quite easy. From there, you’re managing most of the behavior directly through the web interface.
The information captured is displayed on a dashboard at https://infrastructure.newrelic.com/. Navigate to the Third-party services page and find the MSSQL Integration. Once there, you’ll see something that looks like this:

From there you can explore the data captured. You can either view graphical summaries in the MSSQL dashboard, or you can explore the MSSQL data captured in more detail using New Relic Insights. You can also create alerts based on the metrics captured.
SQL Server Metrics
The MSSQL integration agent collects more than 35 different metrics within SQL Server, including a range of instance metrics, a few database metrics, and two wait metrics. Server-wide configuration settings are captured from sp_configure and the sys.configurations table and stored for your use in custom dashboards or alerts.
Instance metrics
The MSSQLInstanceSample event type collects data from a range of instance-level metrics, which you’ll recognize as originating from various of the Windows and SQL Server Perfmon counters, the ones that New Relic has determined that you need to understand the behavior of your SQL Server instance, and include metrics for disk space availability, memory utilization, compilations and recompilations, and so on.
As soon as you open the MSSQL dashboard, you’ll see the graphs displaying the recent recorded values for all the instance-level metrics:
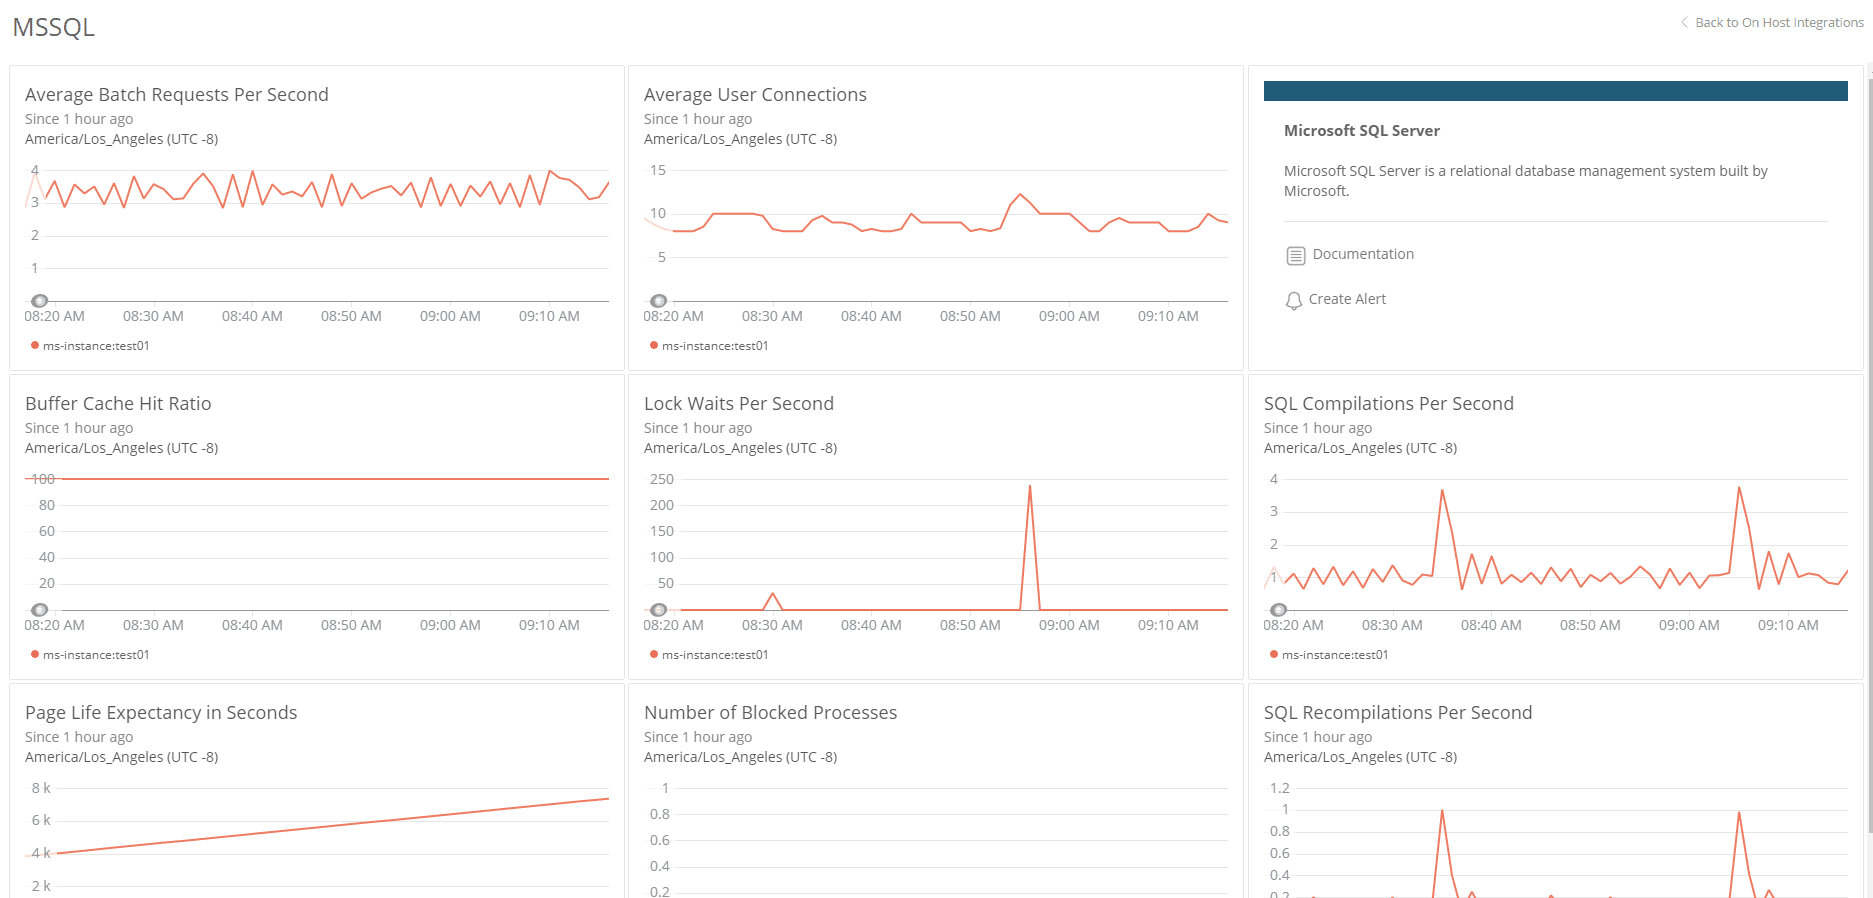
By default, it shows the current time, going back an hour, but you can customize this to show, for example, the last 24 hrs.
You can highlight a moment in time by moving your mouse over the dashboard and the dashboard coordinates around that moment nicely so you can compare the behavior of a set of metrics, at a given point in time. In the following screen, I’m looking at Average User Connections and Lock Waits Per Second. This is a nice feature since correlation between metrics is important.
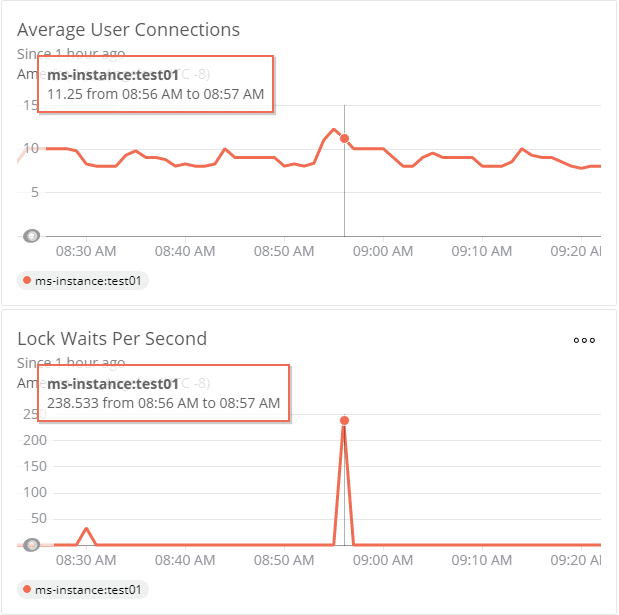
By default, it shows the current time, going back an hour, but you can customize this using a ‘Time Picker’ at the top of the dashboard. This will automatically update the dashboard to show the data for each of the metrics, across the defined range.
Database and wait metrics
The MSSQLInstanceSample event type collects a small group of metrics focused on general behaviors of the database. from the size of the database buffer pool, to the transaction log growth to the total size of the database in pages.
The MSSQLWaitSample event type collections only two metrics, which as the frequency and duration for each wait type. The instance metrics include the total wait time, in milliseconds, experienced on the instance, per second, so you can keep an eye on irregular wait activity, and then drill into the details of the wait types, as required, using the Data Explorer.
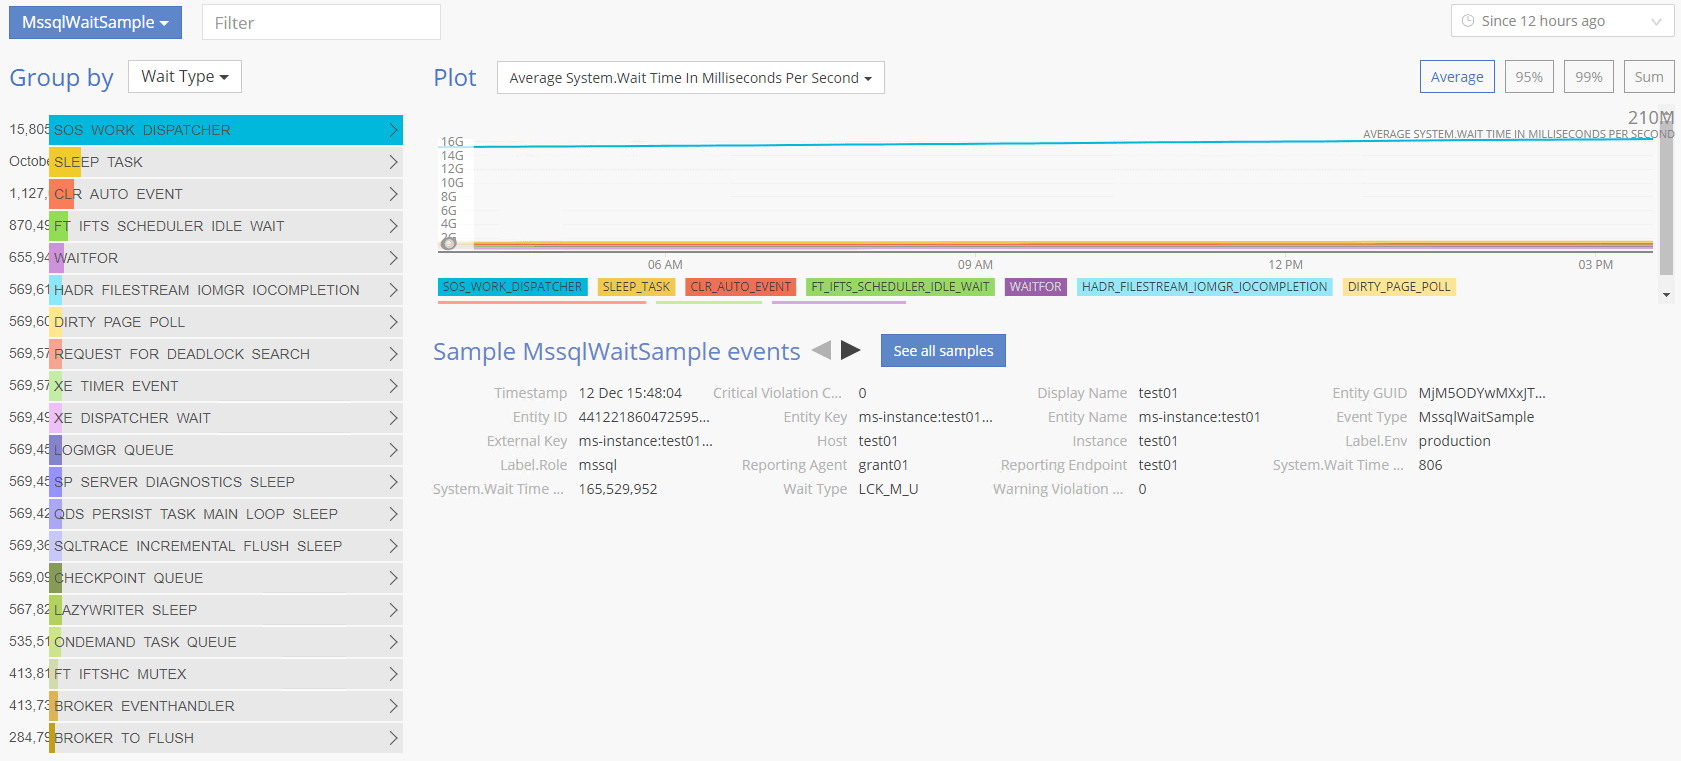
However, there isn’t a way to correlate a given wait to a given query, or vice versa. In order to make this fully functional, you’d need to add a bunch of filters to remove the wait types that either aren’t useful, in general, or may not be immediately applicable to whatever you’re attempting to track.
Exploring and querying the metrics (Insights)
If you open the Insights window and navigate to the Data Explorer, you can explore and query all the event data captured within each of the three event types (instance, database, wait). Here, for example, I’ve chosen the MssqlInstanceSample event type, to view all the events that collect instance-level metrics:
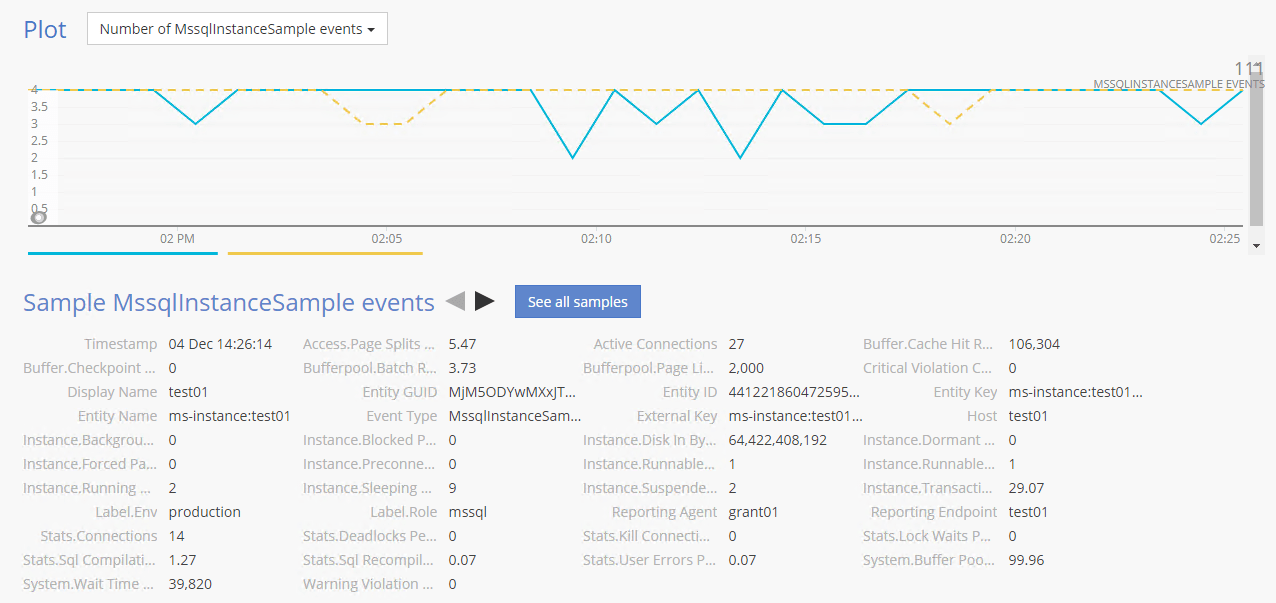
You can drill down simply by clicking on a given metric. Here, I’ve picked the Average Instance.Runnable Tasks to get an indication of load on the system:

You can see the average number of runnable tasks recorded over the last 30 minutes. A nice touch is that you also see a comparison to the week prior, helping to establish some indication of normal behavior. You can control the time frame, averages, and even grouping.
You can query this information and using NRQL, or New Relic Query Language. With this, you can even take the counters and metrics captured by New Relic and build your own customized dashboards.
Creating Alerts
New Relic provide a reasonably versatile tool (accessed via Set Alerts from the Third-Party services page) for creating alerts, setting threshold values, configuring alert delivery options and so on. However, out of the box, you don’t get any pre-defined alert conditions for any of these SQL Server metrics, you must create them as you require them.
In the following screen, I’m starting the process of create an alert condition for Page Splits Per Second. If I accept the defaults, this alert will fire if there are more than twenty page-splits per second, for more than 1 minute. These are the default values provided based on the instance I am currently monitoring. With more instances, you may see different default values.
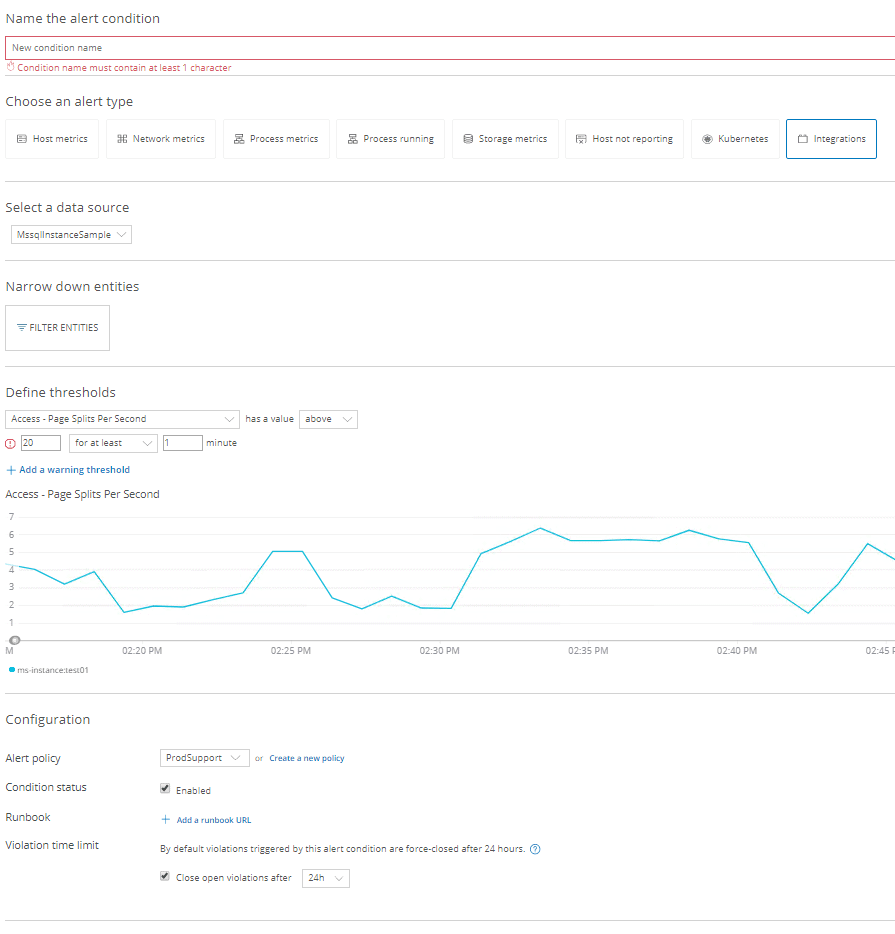
I’m not going to walk through the whole process of configuring a new alert condition, rather just point out a few nice features:
- Narrow down entities– in this section you can set a filter so that the alert only fires when the alert condition is violated for a specific entity, such as a server, instance or database.
- Define thresholds – you define threshold conditions, which if violated will trigger a “critical” alert and, optionally, a “warning”. The screen helpfully displays the last hour of collected values for the metric.
- Alert configuration – you set up policies specifying who gets notified of which alerts, and how. You can link to runbook, perhaps with routine diagnosis instructions for this alert. You can also specify that an open alert violation is closed after a set period.
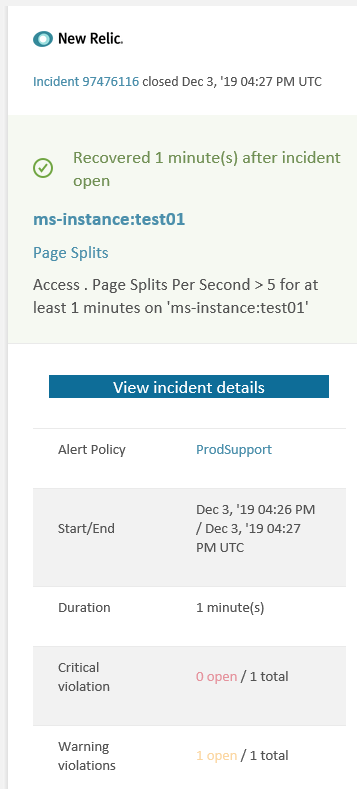
Here’s an example of a Page Splits alert popping into my inbox, in a neat summary form:
Limitations of SQL Server Monitoring with New Relic
The MSSQL agent collects quite a limited set of SQL Server metrics, but arguably it covers many of the most useful, high level, ones. With the New Relic dashboard, and its ability to drill into the diagnostic data with Insights and NRQL, you’ll get a reasonable view of the high-level health, performance and behavior of your SQL Server instances and databases.
However, what you don’t get though are the details. The dashboard might allow a “first responder”, who lacks detailed domain knowledge, to decide who needs to be informed of an issue. However, the person whose task it is to investigate and resolve the issue, quickly, will probably need to gather additional data manually, such as from SQL Server Dynamic Management Objects or Extended Events, in order to determine the likely cause.
Correlation and Corroboration is hard
Let’s say that as a DBA, New Relic alerts me to a period of high page latch waits. I might want to correlate this with the behavior of disk IO metrics over the same period, and perhaps with certain buffer pool-related metrics, such as Page Life Expectancy and others.
The New Relic dashboard sets out graphs of the various metrics required and allows you to review behavior across a range of metrics at a given point in time, it requires quite a bit of navigating around. I can’t isolate a fraction of any given 24-hour period for additional analysis, so it’s not easy to isolate the set of behaviors I want to review, over a specific and often narrow timeframe.
I’ll also want to compare this set of metrics to their respective baselines, to see how far they are “off normal”. New Relic does a decent job of dealing with a baseline of behavior for a given metric. It just doesn’t allow for the drill down and easy correlation between that metric and others. Once I’m certain there is a problem, I’ll want to drill straight down into actual server activity of that period.
Lack of drilldown on performance diagnostics
Perhaps the biggest issue I’ve found, as a DBA, when using New Relic is that the level of detail that I often need for troubleshooting and analysis, is missing from the New Relic data.
For example, let’s say users are reporting slow response times and the New Relic dashboard shows several blocked processes over that period. You probably also created an alert condition to warn you of this problem.

This is fine, but what you don’t get, because there are no details and there is no drill down, is any information about that the blocking process. What is the blocking chain? What process was causing the block and what was it doing? Similarly, for deadlocks, you get to see the number of deadlocked queries, but not the queries that were deadlocked, the deadlock graphs and so on; you’ll need to hunt down further information from other places, such as the system_health extended event session.
When trying to pinpoint he case of waits, the story is similar, again. Which query or queries were causing the most waits over a period of poor performance? It’s difficult to know this just from the SQL Server diagnostics reported, by default, to in the New Relic Dashboard.
Customizable, but not easily
Extending New Relic’s SQL Server monitoring with the additional custom metrics you need to better understand common performance issues, or address security concerns, is possible, but not necessarily straightforward.
I found the documentation on exactly how to get this done, specifically within SQL Server, somewhat sparse. The mechanisms involve using the Event API and a programming language such as Node.JS to generate the appropriate JSON document that you can then add to the metrics gathered. In this way, you could build custom collection mechanisms using the standard DMVs, WMI queries, and even Extended Events, but it’s going to be a lot of work to begin to add these, especially if you need a lot of custom metrics.
Limited monitoring for disks and scheduled processes
While you have metrics to track information such as the Space Available on your databases, this information in the dashboards is always an average. In other words, you can’t easily track how much space is available in a single file, or in a data file or a log file. For this, you’re back to building a custom metric. Further, there is no information gathered about the SQL Server Agent. If you’re interested in tracking the length of times that jobs ran, you’re once more required to build out custom metrics.
Advantages of a dedicated SQL Server monitoring tool (Redgate Monitor)
A specialized SQL Server monitoring tool such as Redgate Monitor is designed specifically to help pinpoint the stress points and bottlenecks in the often-complex performance patterns that databases exhibit when under load and give you a clear contextual understanding of what was happening within a database, when a problem started. Put simply, the tool has a much deeper understanding of the SQL Server system.
Visualization, correlation, trends and baselines
The New Relic dashboard can show you correlation between multiple metrics at a moment in time. This makes it possible to understand when, for example, you have high I/O and a high number of waits. However, what you don’t get is the easy ability to view, through a single pane of glass, the behavior of multiple metrics combined with the details of the underlying queries and other processes that are running around that time.
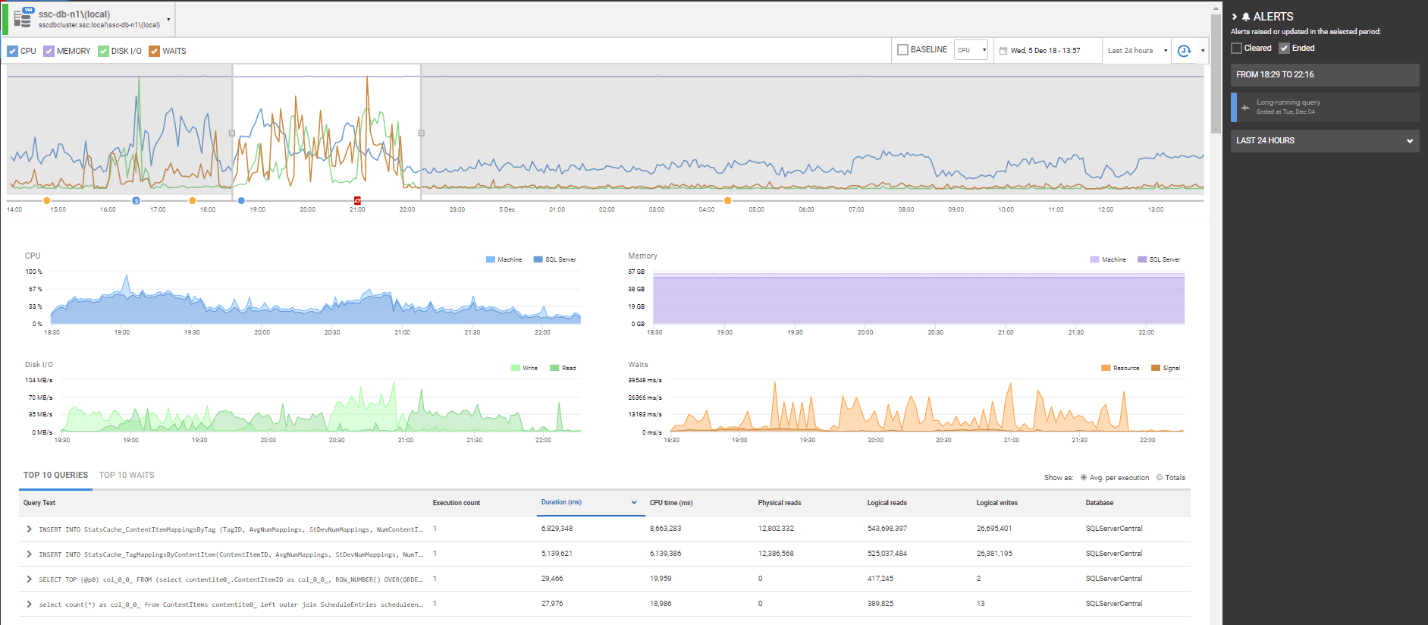
We can see alerts within the context of overall activity on the affected server, and these alerts provide the essential information required to describe the problem. This means that a “first responder” doesn’t necessarily need specialized knowledge of the monitoring tool, or of SQL Server, in order to either respond, and close the alert, in simple cases, or to ensure that the right person or team is made aware of the issue, promptly.
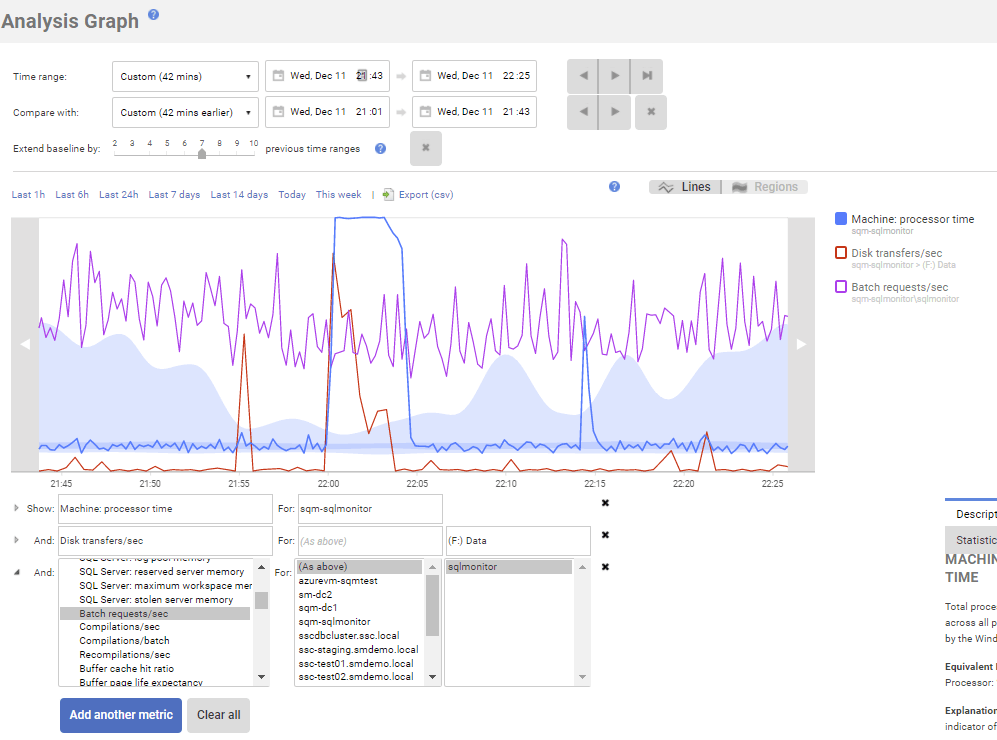
I can isolate a set of behaviors over a specific period and see all the associated values at that moment in time. For example, I can quickly and easily focus on that period around 22:00, where we see high I/O, high waits, and high CPU:
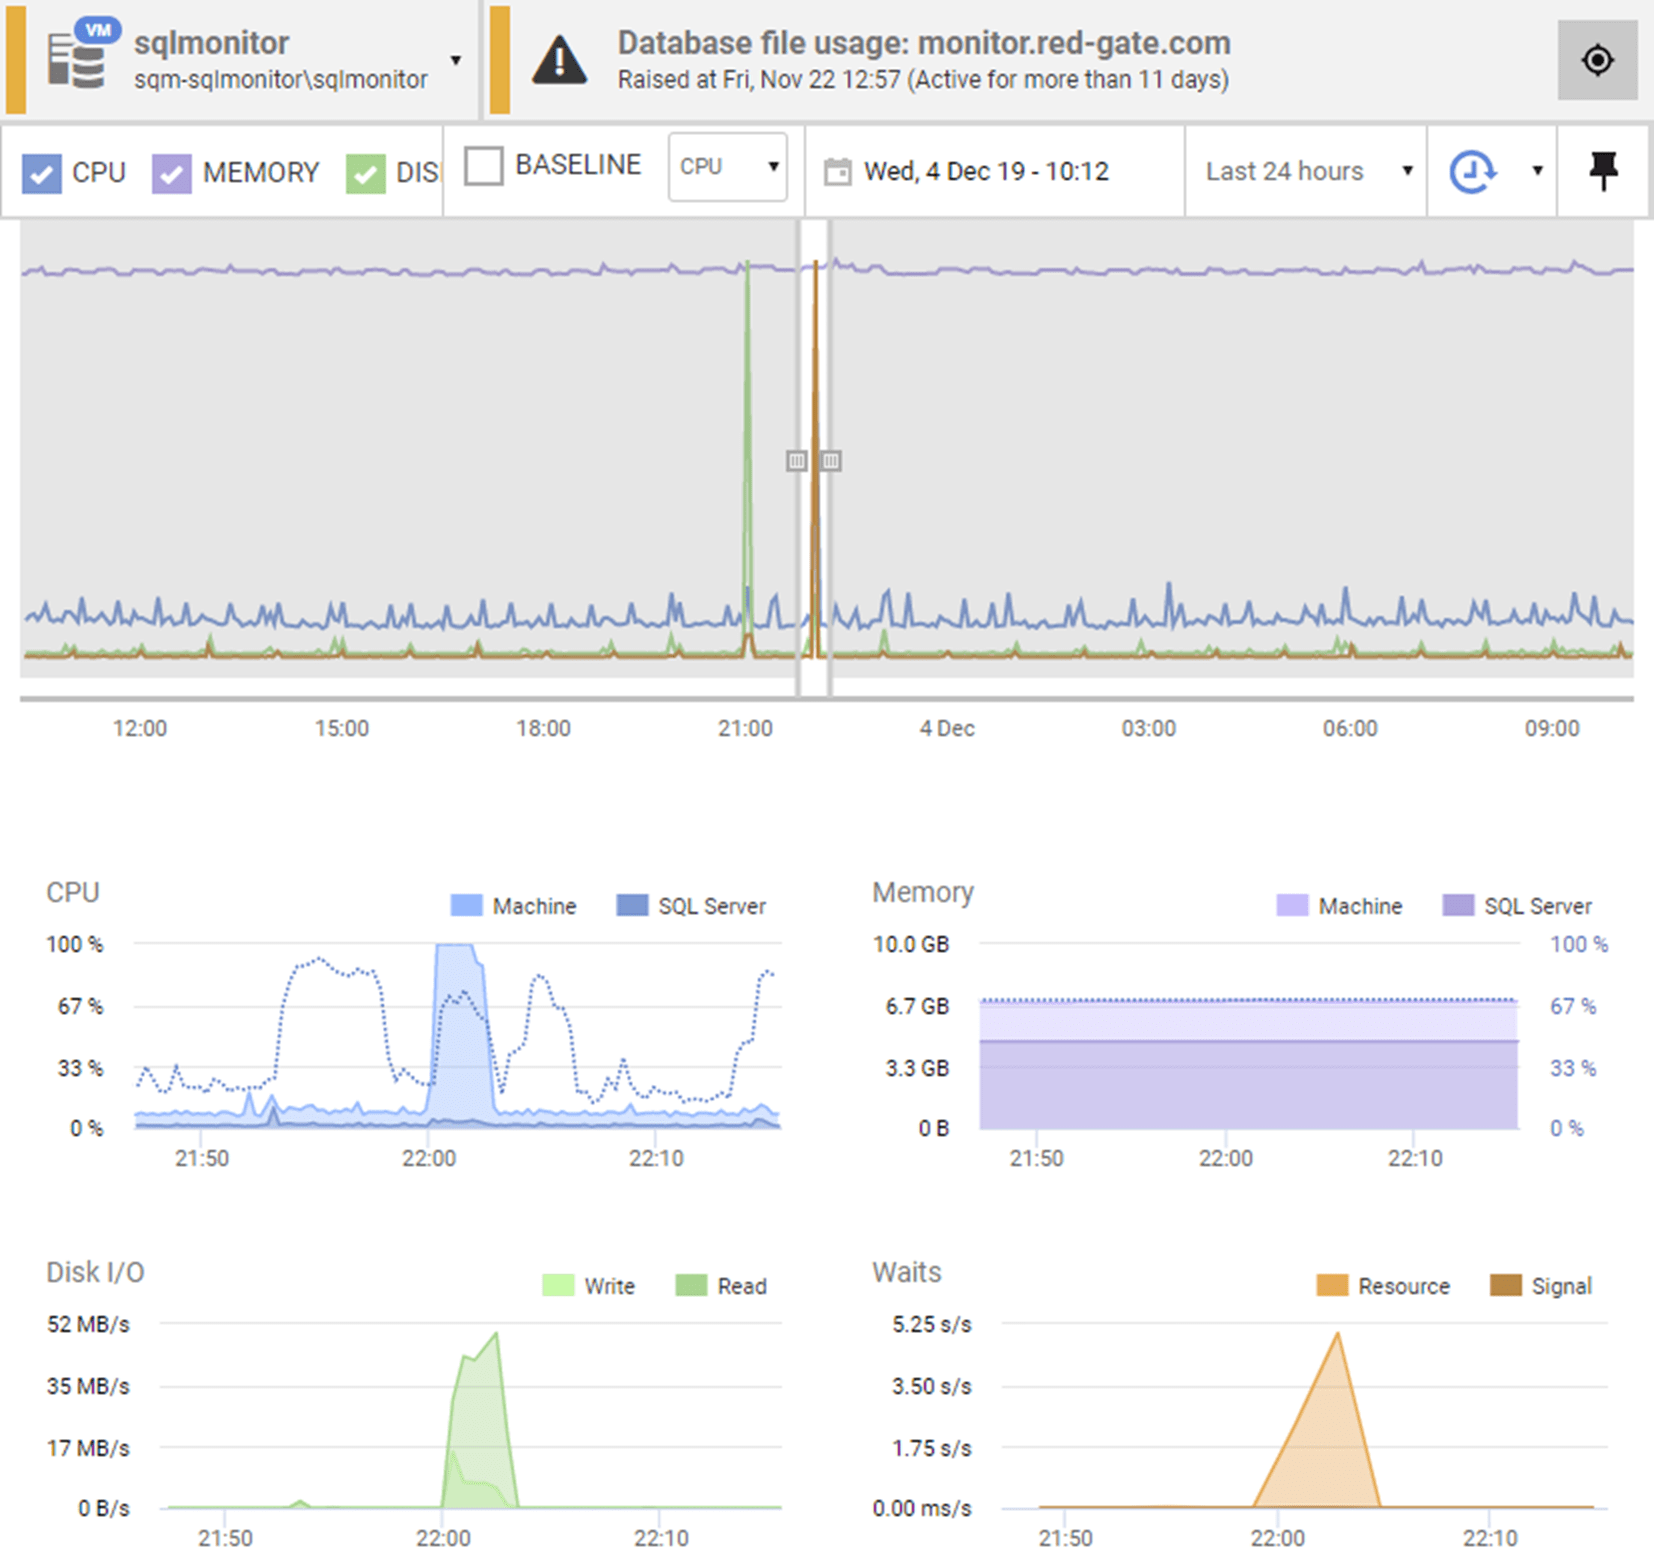
To understand any service that responds to demand, such as a database or web server, I also need to see baselines. Demand is never consistent and in order to understand problems and help with future capacity and infrastructure planning, you need to compare current performance with past performance.
Drilling further in Redgate Monitor, we can correlate data from multiple metrics, lay it against a baseline and to identify workload behaviors. We can quickly zoom into a specific point in time, and all diagnostic data will be aggregated, contextually, providing efficient root cause analysis capabilities.
Drilldown diagnostics
Where a tool customized for SQL Server really shines is in the detail. The data that Redgate Monitor collects is exactly the data that a DBA needs to track use of critical resources, and to diagnose the cause of any abnormal or undesirable conditions and properties, as well as specific errors, on any of the monitored servers, instances and databases. It provides all the detailed diagnostics that New Relic, without additional configuration, does not. I’ll offer just a coupler of examples of what I mean
Identifying long-running-queries and waits
We can very quickly find out which were the most expensive queries being executed over a period of anomalous behavior
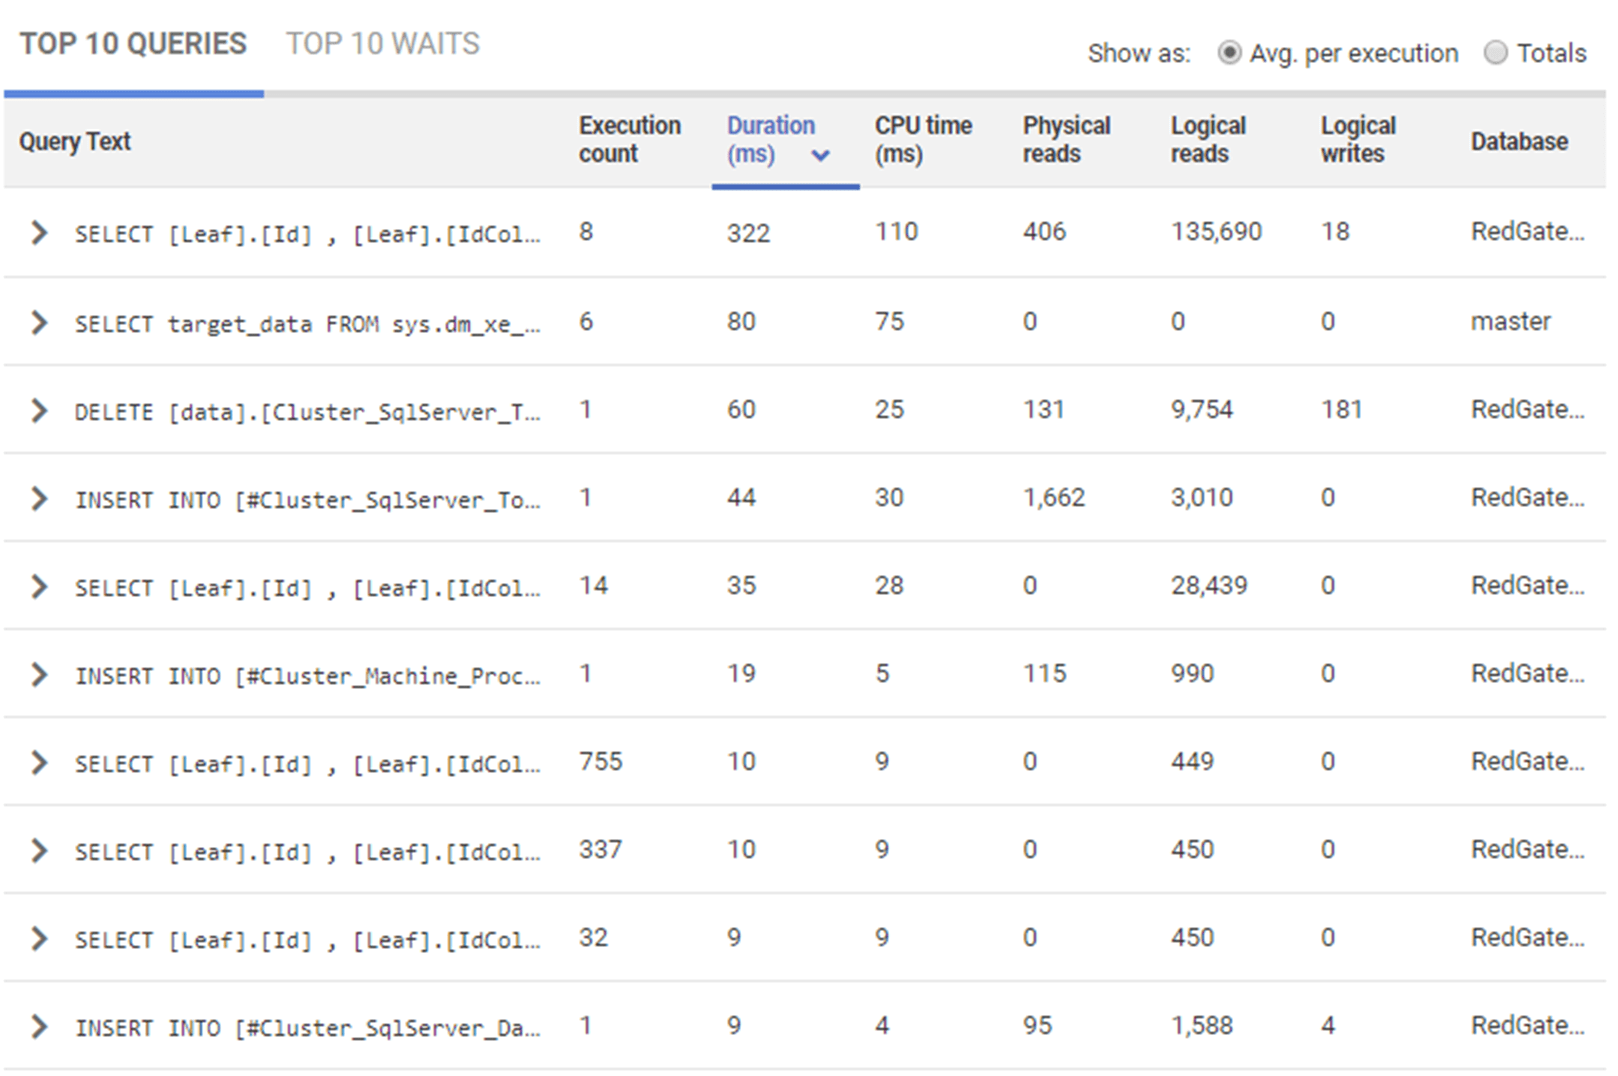
You can quickly resort this data (by default order by duration), and by clicking into a query you can:
- Drill down to query execution statistics and Query Plans
- Visualize Query plan changes
On the next tab you get to see the prominent causes of waits of that period, in this case revealing that a backup process was using up I/O and CPU at the same time as some queries with rather heavy load are running.
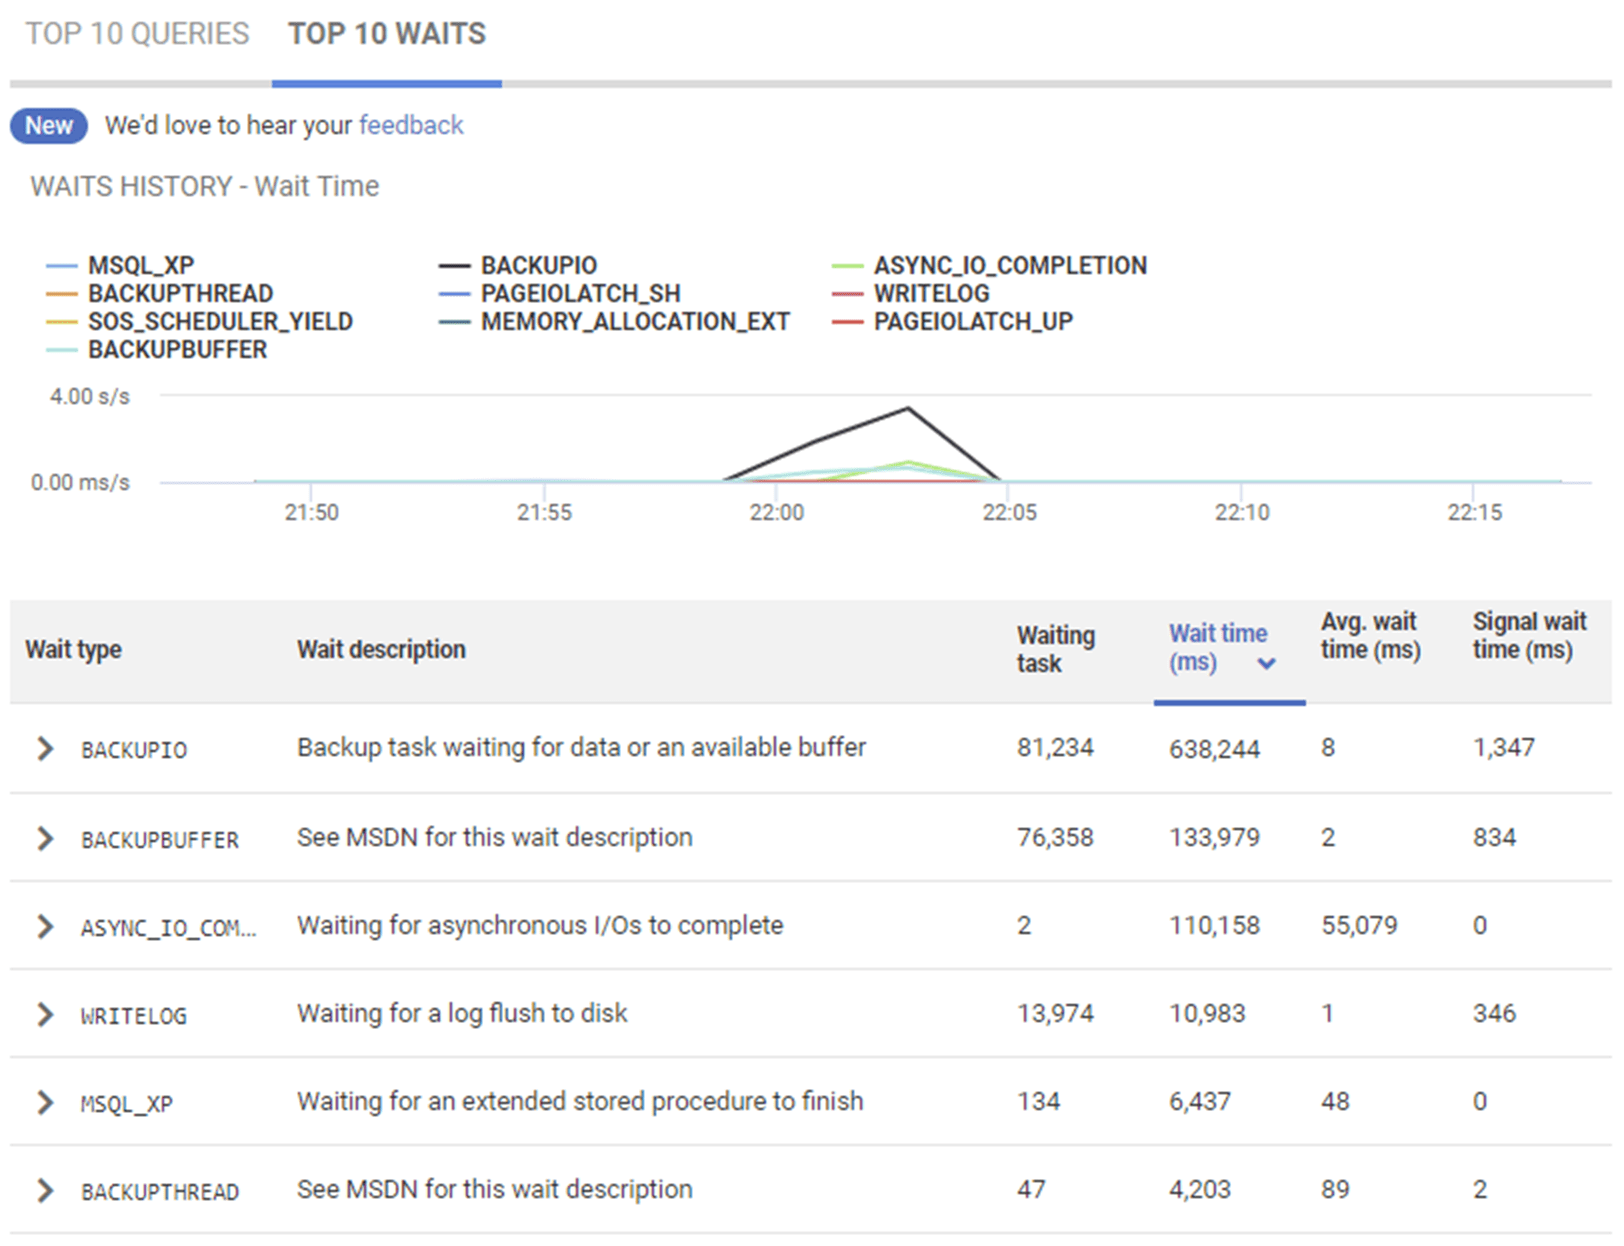
If you click on one of these wait types, you’ll also see a detailed description of it, and advice on likely causes.
SQL Server domain knowledge
Another place where having a tool dedicated to SQL Server, like Redgate Monitor, will help is with domain knowledge of how SQL Server works. With New Relic, you get to see when blocking occurred over a 24hr period.
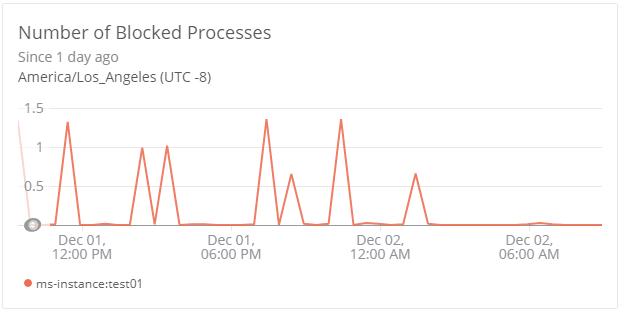
With a tool like Redgate Monitor, you get instant knowledge of the blocking and blocked queries.
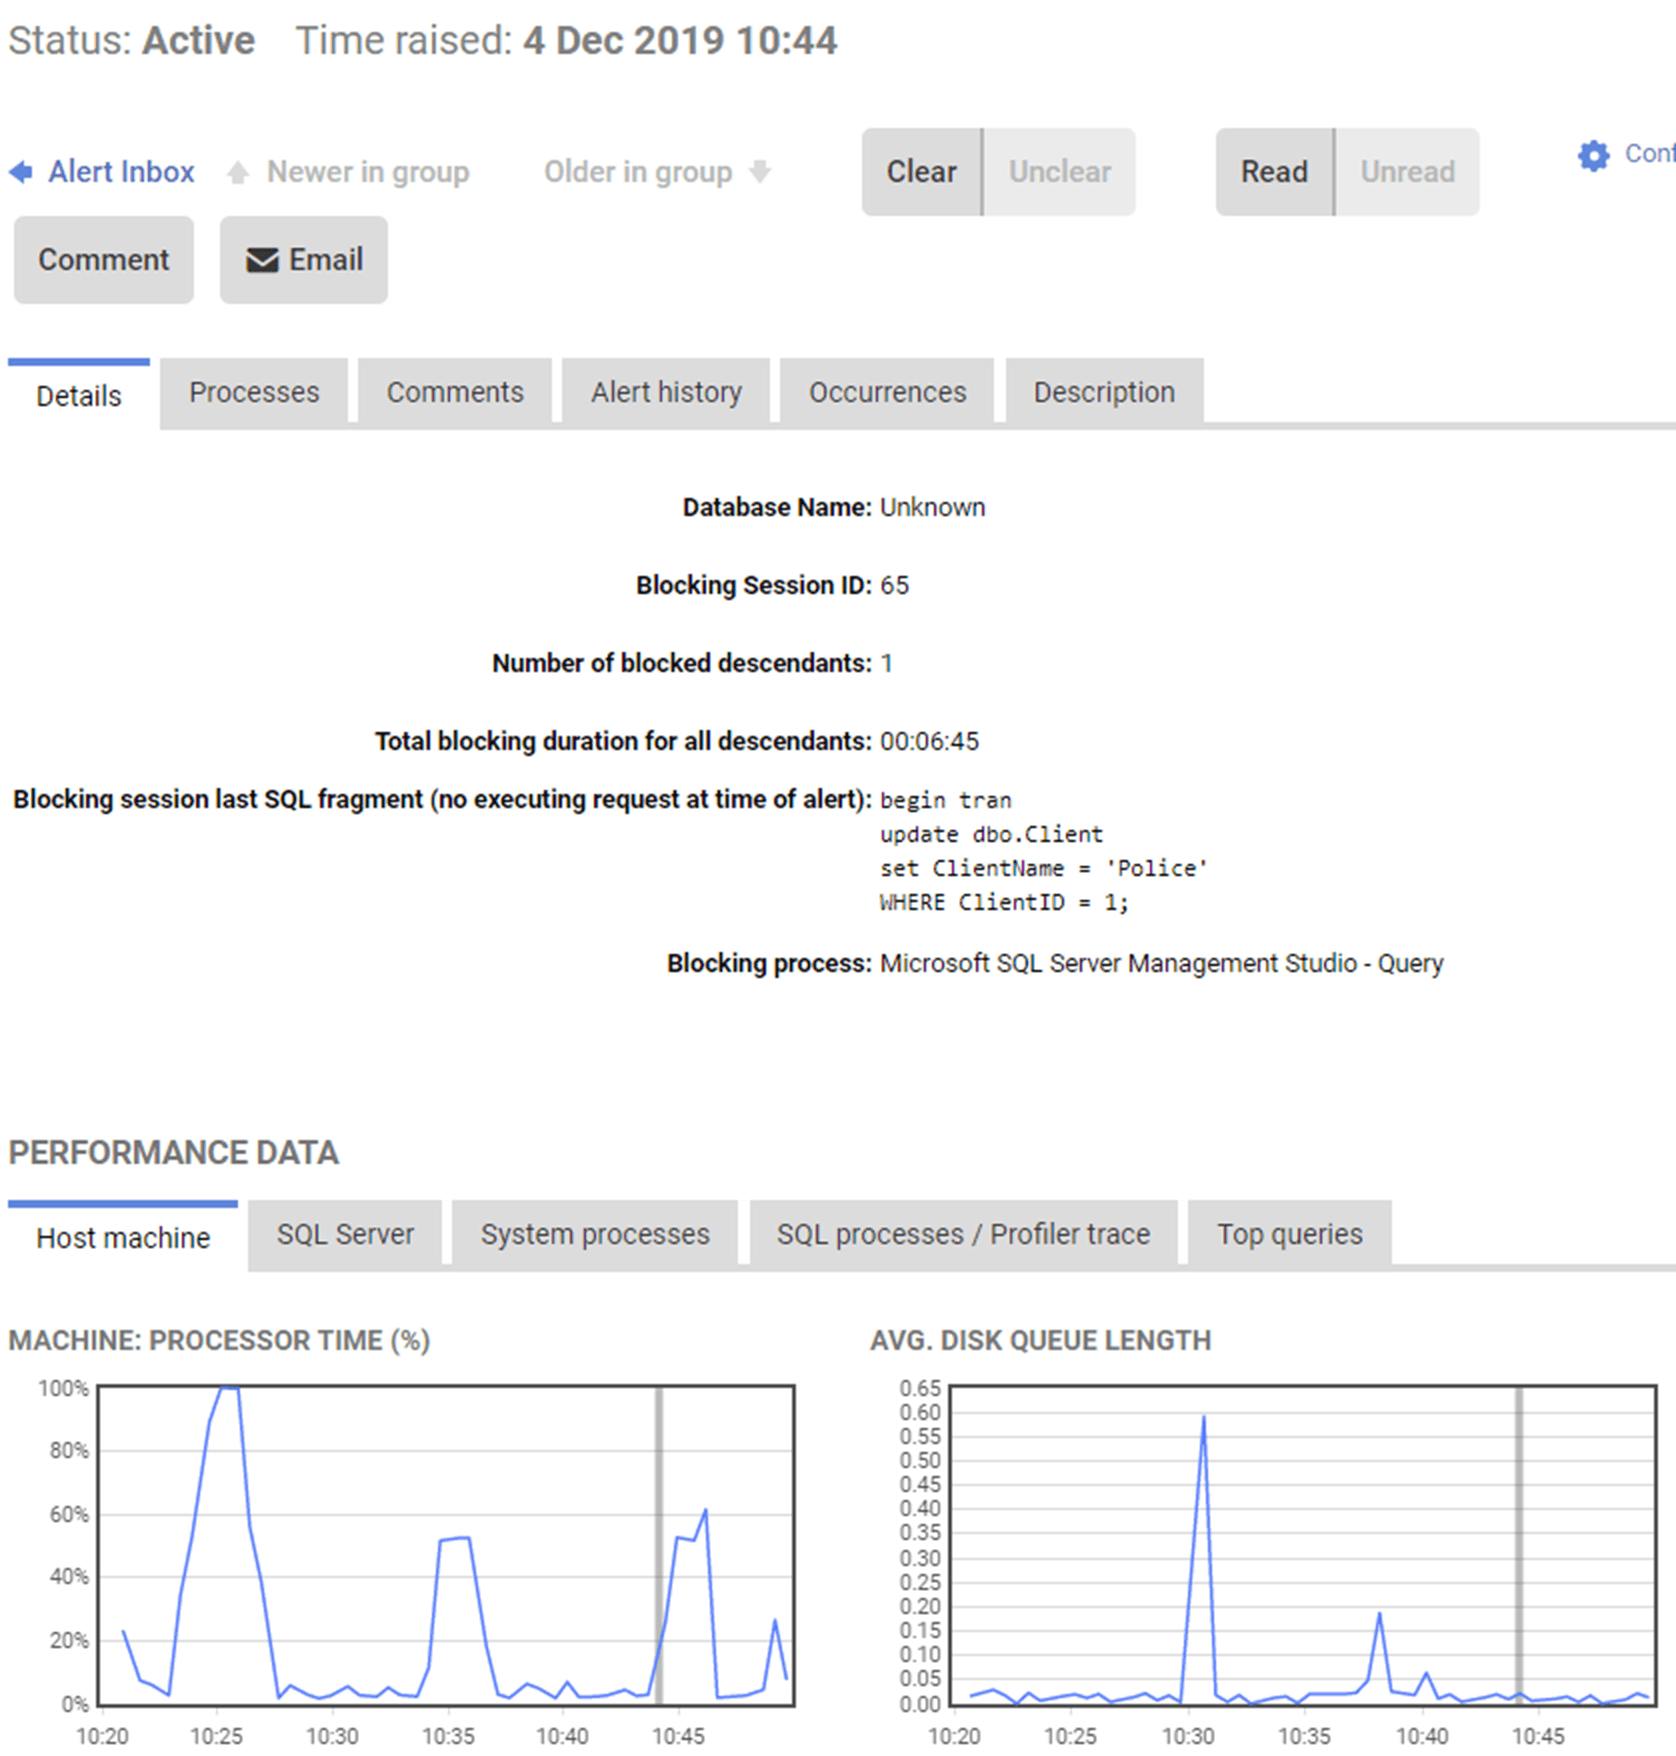
You can then retrieve the full blocking chain, in easy graphical format, and use it to diagnose and resolve the blocking quickly.
Similarly, for deadlocks, Redgate Monitor presents the Extended Events deadlock graph in the alert details, plus details of the sessions and queries that were running at the time it occurred.
SQL Server Guidance
New Relic does a good job at capturing some of the right information. For example, they have a good metric in Page Splits Per Second on the dashboard:

Here’s the same metric from Redgate Monitor on the same server over the same time range (believe it or not):
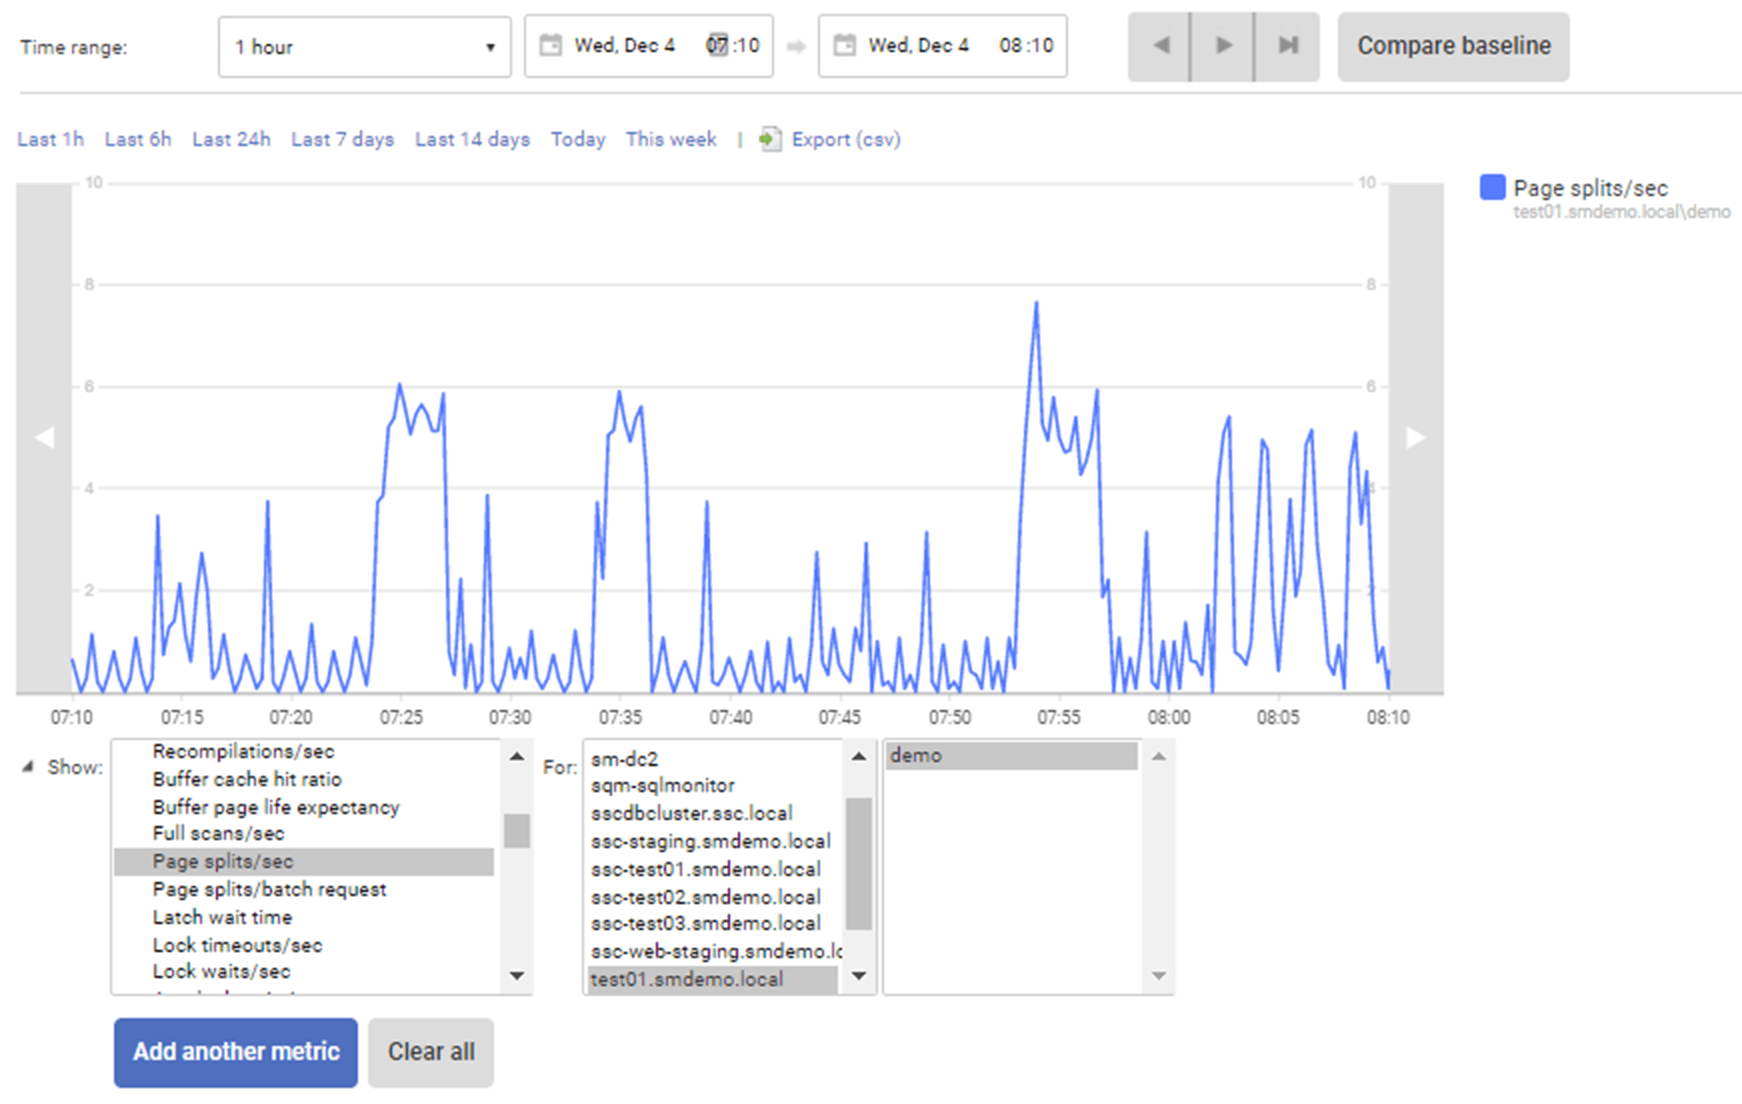
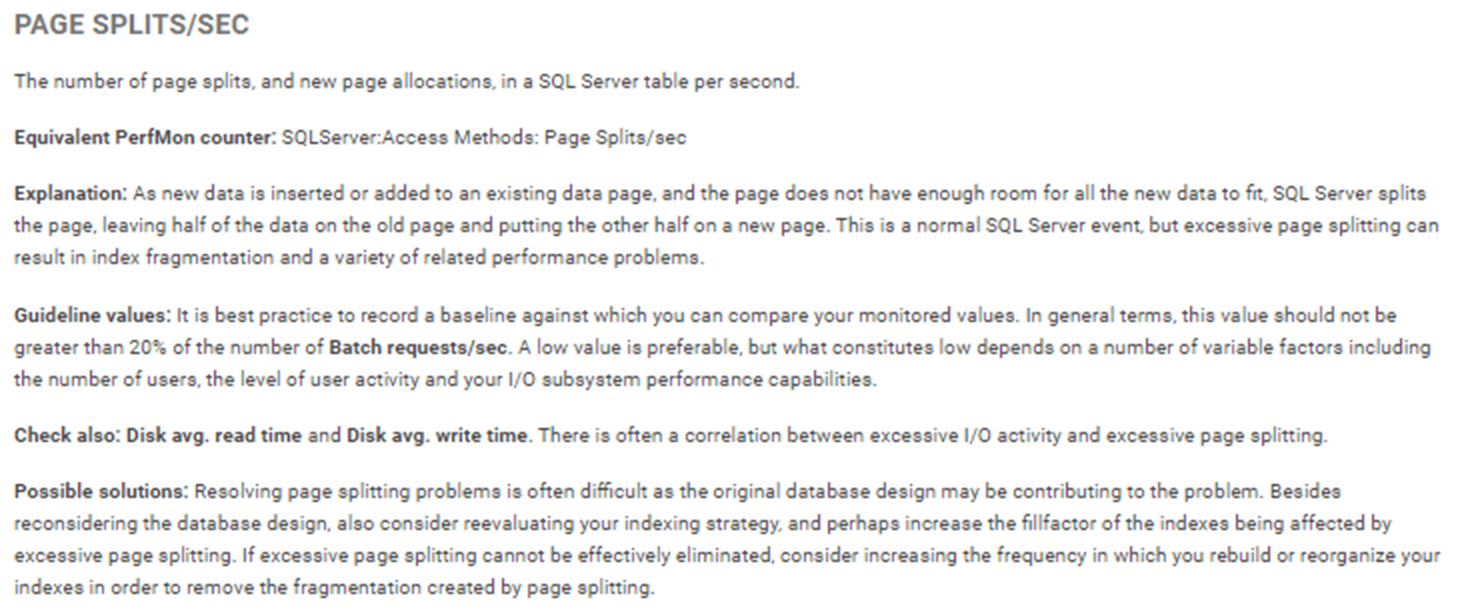
I know that these don’t precisely correlate (you can see similarities in the curves). However, the point is, what exactly is Page Splits Per Second? Why do you care? Are there any other metrics you need to be looking at? A dedicated tool will offer, in-tool, a good set of documentation, guidance, and suggestions:
Central management database and disk growth, backup and scheduled jobs
New Relic Infrastructure has built-in disk space metrics, and with MSSQL integrations, you also get metrics showing the average pages available on a given database. So, we could look at the space available within a given disk and compare that to the preceding week:

A tool like Redgate Monitor, by contrast, offers versatile database growth management. It provides detailed database and disk growth tracking data and analyses trends in this data to predict accurately when either a disk volume will run out of free space, or a database file will need to grow.
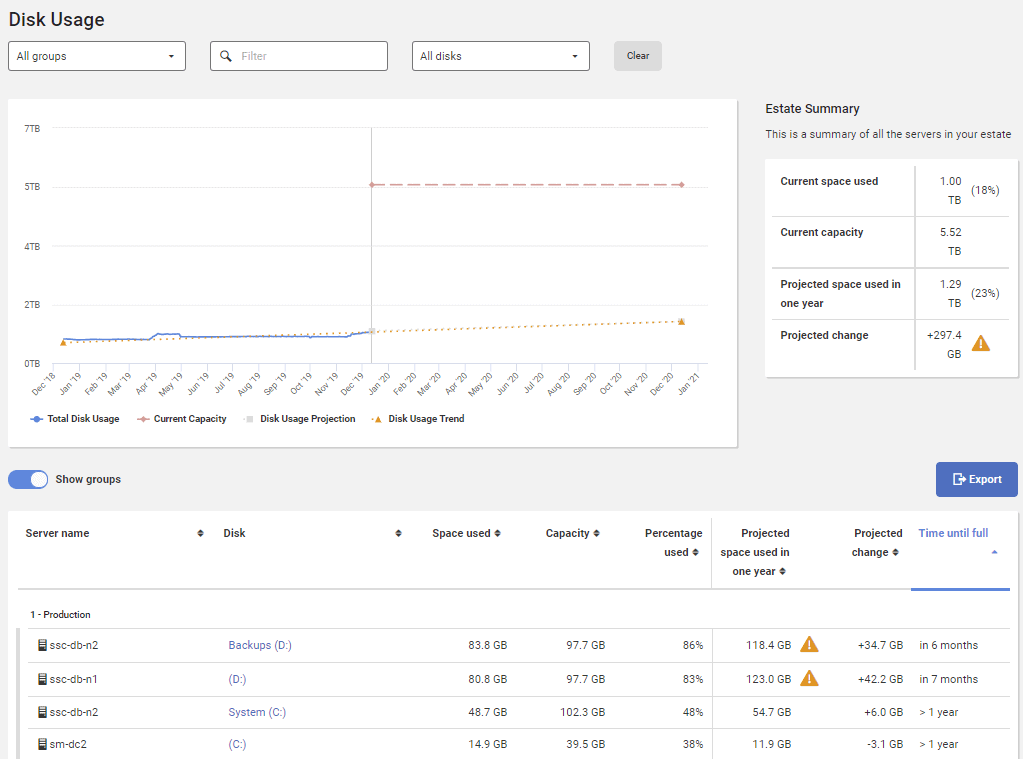
For monitoring backups and other jobs, a tool like Redgate Monitor that is completely SQL Agent-aware. It will alert you if an error was generated by a job, and will track how long jobs take to run, so that it can alert you if behavior of a job deviates substantially from normal.
A dedicated tool like Redgate Monitor provides in-depth Backup monitoring, reflecting the fact that backup management remains a critical aspect of every DBAs job. This means that you get a lot more than just an alert when a backup fails. It also tracks what kind of backups are being run on each database, the size of these backups, and how long has it been since a backup was run. It uses this knowledge to provide a high-level view of your current potential exposure to data loss, if disaster struck and you needed to perform an emergency restore operation to get any database back online, which you can map to your Recovery Time Objectives and Recovery Point Objectives.
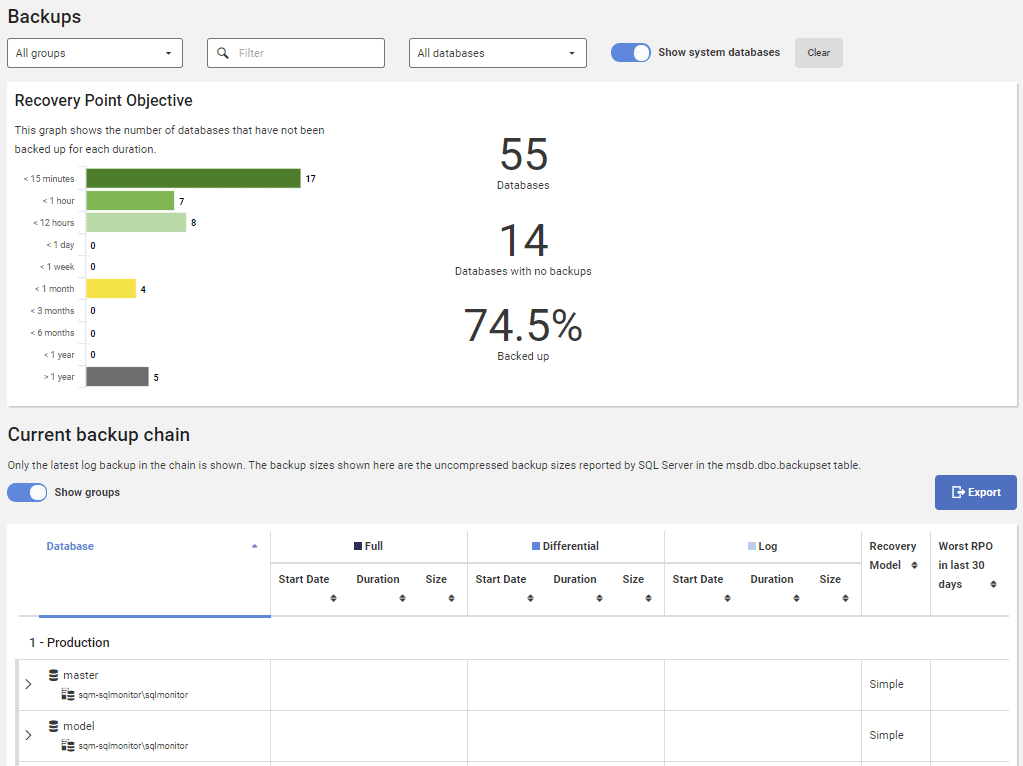
Again, a dedicated and targeted SQL Server monitoring tool provides information specifically tailored to meet the needs of someone tasked with managing a SQL Server instance, or even an estate of SQL Servers.
Expanding and adapting the SQL Server monitoring strategy
With Redgate Monitor, you get a tool that is designed to cope with monitoring many SQL Server machines, instance and databases, installed on diverse platforms:
- Redgate Monitor is agentless; it installs nothing at all on the SQL Server instances from which it collects data.
- Scaling out the number of servers to monitor is easy, since Redgate Monitor supports multiple base monitors, and still collates all the collected data in single web console.
- Expanding and adapting the monitoring strategy for each server is easy, using custom metrics You can add any metric that you can define with a SQL query that returns an integer value.
- It has pre-configured, but easily adjustable, alerts for all the common causes of SQL Server-related problems. It automatically groups alerts, so that instead of receiving hundreds of individual alerts in the inbox, you see groups of alerts as they relate to of the same problem, such as the same long running query.
Redgate Monitor and New Relic?
My argument is not that New Relic Infrastructure does a bad job. It is a capable server monitoring tool with nice data analytical capabilities. My argument is that by extending New Relic to monitor SQL Server, you simply don’t get all the necessary information, correlation, drilldown and guidance necessary to understand what is happening on your servers and what you need to do about it. The level of customization required to implement enough additional monitoring through, or around, New Relic, adds considerable overhead to the monitoring of your servers. Not only will you have to build custom data collection and reporting, but you’ll have to maintain this through various upgrades and patches of all the systems involved.
A tool like New Relic offers a lot of functionality across a wide swathe of products, which is a strength, but can also become a weakness when it comes time to drill down to the details of a specific product. In the case of SQL Server, it is useful to know, at a high level that your servers are healthy. However, when there are problems and you need to understand what’s causing those problems and why, the details matter. Redgate Monitor provides the level of detail you need to solve your problems. Further, Redgate Monitor is built with full knowledge of the behaviors of SQL Server so that they’re built into the tool and the information it provides. All this built-in SQL Server knowledge is fed back to you as guidance that it makes it easier to understand what’s happening on your systems. For all these reasons, I would always recommend using a tool like Redgate Monitor in combination with a tool like New Relic. You just can’t live without the necessary detail.
Tools in this post
Redgate Monitor
Real-time multi-platform performance monitoring, with alerts and diagnostics


