Troubleshooting Blocking in SQL Server using Redgate Monitor
Redgate Monitor tells us immediately when significant blocking occurs, and where, during busy periods, and provides the full blocking chain, in an easy-to-digest graphical format, so we can diagnose and resolve the blocking quickly.
A call comes in to the DBA from Help Desk. There is an urgent problem with a reporting application; unhappy users say that their screens are “frozen”, and not because of an overactive A/C vent. Some have reported seeing a timeout issue related to SQL. Is it a blocking problem?
As a DBA, if blocking problems catch you off-guard, you’ll need to do some reactive investigative work, to piece together a picture of what processes are, or were, blocked, what sessions caused the blocking, what SQL was running, what locks were involved and so on.
Ideally, though, you’ll have SQL Server monitoring in place, and will have received an alert, providing all the required diagnostic data, so that you’d resolved the issue before Help Desk even picked up the phone.
What causes blocking?
In a busy database, many user transactions compete for simultaneous access to the same tables and indexes. Generally, SQL Server mediates access to these shared resources by acquiring various types of lock. Blocking occurs when one or more sessions request a lock on a resource, such as a row, page or table, but SQL Server cannot grant that lock because another session already holds a non-compatible lock on that resource.
Assuming use of the default isolation level (READ COMMITTED), let’s say that session A runs a transaction that modifies a few rows in a table. SQL Server acquires Exclusive (X) locks on those rows. This lock mode is incompatible with other lock modes, so if a second session, B, wishes to read those same rows, which requires acquisition of a Shared (S) mode lock, it will be blocked until the transaction holding the X lock commits or rolls back.
Locking, and the blocking it causes, is usually fleeting and is a perfectly normal and desirable operational characteristic of a database. It ensures, for example, that a transaction doesn’t read data that is in flux (i.e. it prevents “dirty reads”), and that two transactions can’t change the same row of data, which could lead to data corruption. However, when blocking occurs for extended time periods, it can impact the performance of many user processes.
In severe cases, multiple sessions can be blocked, at various points of a long blocking chain. The responsiveness of SQL Server degrades dramatically, and this situation is often mistaken for a deadlock.
The big difference is that a deadlock causes a specific error, and one of the transactions will be rolled back. With blocking, however severe, no error is raised. The session at the head of a blocking chain will not be waiting for a lock. It may be waiting for a latch, or a memory allocation, or IO, but the blocking chain will clear as soon as the resource becomes available and the head blocker can complete its work.
Investigating historical blocking issues
Let’s say that you’re investigating what caused blocking, after the issue has resolved itself, or are performing a more-general investigation on a database where extensive periods of blocking are an ongoing issue. For example, perhaps the aggregated wait statistics in the sys.dm_os_wait_stats Dynamic Management View (DMV) reveal large accumulated wait times related to locking waits.

Figure 1
One way we can investigate the possible cause is to use the index usage statistics in the sys.dm_db_index_operational_stats DMV to look for indexes that have high accumulated locking waits, as demonstrated for example by Jason Strate.

Figure 2
If we’re also seeing high historical level of waits such as PAGEIOLATCH_SH (as in Figure 1), then this indicates that sessions are experiencing delays in obtaining a latch for a buffer page. Does this mean that the root cause of the blocking is session waiting to perform I/O i.e. a disk I/O bottleneck? Maybe, but it could equally well be a reporting query that access the table using that index regularly reads gigabytes of data from that table.
In other words, while these DMVs might reveal one or more tables and indexes that are ‘locking’ hotspots, it’s not necessarily easily to find out why without a lot of further investigation.
Diagnosing current blocking
If we’re made aware of a potential blocking problem while it is still occurring, then SQL Server provides a wealth of information to help us investigate and resolve the problem.
We’ll review briefly the information available to diagnose current blocking using the DMVs, or PerfMon, and then move on to the most common technique, which is to capture using blocked process report, ideally using Extended Events (but SQL Trace if that’s not possible).
Adam Machanic’s sp_whoisactive is also a very popular tool for investigating ongoing blocking issues, but I won’t cover it in this article.
Investigating waiting tasks using the DMVs
If a request is active, but waiting to acquire a resource in order to proceed, it will appear in with the sys.dm_os_waiting_tasks DMV. This view will tell us the type of wait, the resource on which the request is waiting for access, and more. If blocking is the source of our problem, we’d expect to see waits to acquire locks on rows, pages, tables and so on.
There are plenty of different ways to query this DMV, joining to other DMVs for details of the blocked and blocking sessions and the queries being executed. I adapted the query provided in Listing 1 of SQL Server Performance Tuning using Wait Statistics: A Beginner’s Guide (free PDF download). Figure 3 shows some sample output.

Figure 3
The wait type for locks has the form LCK_M_<lock type>, so for example LCK_M_SCH_M is a wait to acquire an SCH_M (Schema Modification) lock. Figure 1 shows a blocking chain involving four sessions (IDs 79, 80 and 74 and 78). At the head of the chain is session 79, which is blocking session 80, which in turn is blocking session 74, which is blocking 78.
Session 79 is the only session that is not waiting to acquire a lock. It is running a transaction against the SalesOrderHeader table. Typically, this might be a transaction that for whatever reason that is taking a long time to modify data, or perhaps has experience an unexpected error that caused the batch to abort but left the transaction open (uncommitted).
The locks held by session 79 are blocking session 80 from acquiring the lock that it needs in order to modify the clustered index on SalesOrderHeader (in this case, to perform an online index rebuild). At the bottom of the chain, session 78 is blocked, waiting for session 74 to complete its work, so that it can acquire a shared read lock on the SalesOrderHeader table, in order to read the required rows.
If we need further details on the types of locks held by each session in the chain, on which resources, as well as locks that sessions are waiting to acquire, we can use the sys.dm_tran_locks DMV, supplying the session IDs acquired previously. DMVs such as sys.dm_tran_active_transactions DMV will provide a list of all transactions that are active at the time the query is executed; sys.dm_exec_sessions will reveal the owner of any blocking sessions, and so on.
PerfMon
A tool such as Performance Monitor (PerfMon) provides some counters for monitoring for cases of excessive locking and blocking. For example, SQLServer:General Statistics object will show the number of blocked processes detected; the SQL Server: Locks object can provide Avg Wait Time (ms), Lock Waits/sec and more. However, again, these only provide an indication of a possible problem.
Monitoring for blocking using the blocked process report
If blocking is causing issues, we can run an Extended Events event session, to log occurrences of blocking that exceed a specific time threshold, and capture the blocked_process_report event.
By default, the “blocked process threshold” is zero, meaning that SQL Server won’t generate the blocked process reports. We need to configure by the “blocked process threshold” to a specific value (in seconds) using the sp_configure option. For example, if we set it to 15 seconds, then the event will fire three times if a session is blocked for 45 seconds. Erin Stellato shows how to configure the threshold then define an extended event session to capture the report.
In Figure 4, the event has fired 6 times. Each of the three blocked processes in the chain fired the event after being blocked for 15 seconds, and then again 15 seconds later.
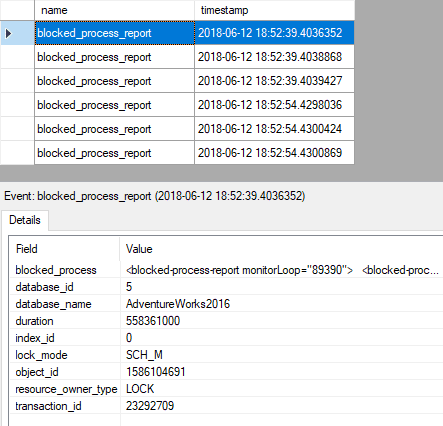
Figure 4
To open the first blocked process report, simply double-click on value column for this field, in the lower pane. Listing 1 shows the truncated output for one of the reports, showing the online index rebuild (spid 80) blocked by an uncommitted transaction (spid 79) on SalesOrderHeader.
|
1 2 3 4 5 6 7 8 9 10 11 12 13 14 15 16 17 18 19 20 21 22 23 24 25 26 27 28 29 30 31 32 33 |
<blocked-process-report monitorLoop="89390"> <blocked-process> <process id="process1f2cd7c7c28" taskpriority="0" logused="168" waitresource="OBJECT: 5:1586104691:0 " waittime="558361" ownerId="23292709" transactionname="ALTER INDEX" lasttranstarted="2018-06-12T18:43:20.853" XDES="0x1f27aa04490" lockMode="Sch-M" schedulerid="1" kpid="1928" status="suspended" spid="80" sbid="0" ecid="0" priority="0" trancount="1" lastbatchstarted="2018-06-<em>…output truncated…</em>"> <executionStack> <frame line="1" stmtend="194" sqlhandle="0x01000500cb55c82e705e3880f201000000000000000000000000000000000000000000000000000000000000" /> </executionStack> <inputbuf> ALTER INDEX PK_SalesOrderHeader_SalesOrderID ON Sales.SalesOrderHeader REBUILD WITH (ONLINE = ON); </inputbuf> </process> </blocked-process> <blocking-process> <process status="sleeping" spid="79" sbid="0" ecid="0" priority="0" trancount="1" lastbatchstarted="2018-06-12T18:43:12.377" lastbatchcompleted="2018-06- <em>…output truncated…</em>"> <executionStack /> <inputbuf> BEGIN TRANSACTION SELECT FirstName , LastName , SUM(soh.TotalDue) AS TotalDue , MAX(OrderDate) AS LastOrder FROM Sales.SalesOrderHeader AS soh WITH (REPEATABLEREAD) INNER JOIN Sales.Customer AS c ON soh.CustomerID = c.CustomerID INNER JOIN Person.Person AS p ON c.PersonID = p.BusinessEntityID WHERE soh.OrderDate >= '2014/05/01' GROUP BY c.CustomerID , FirstName , LastName ; --COMMIT TRANSACTION; </inputbuf> </process> </blocking-process> </blocked-process-report> |
Listing 1
The next blocked process report in the list show very similar output, but this time the index rebuild is the blocking process (spid 80), and the blocked process (spid 74) is another query on the SalesOrderHreader table. In the final report spid 74 is the blocker and spid 78 is blocked.
While the blocked process report provides all the information we need to troubleshoot cases of blocking, it’s hardly in an easy-to-digest format, and you’ll often find an overwhelming number of reports generated, because a single blocking chain can generate multiple reports, if it exceeds the value for the threshold multiple times.
Monitoring and troubleshooting blocking using Redgate Monitor
Ideally, we need to set up a less-reactive monitoring solution; one that alerts us to severe blocking immediately, as it occurs, provides enough information to diagnose and resolve it quickly, but allows us to see what sort of blocking occurs, and where, during busy periods. This allows us to act, before it gets severe enough to start causing performance degradation and alerts.
Blocking process alerts
Redgate Monitor raises the blocking process alert against any SQL process that has been blocking one or more other processes for longer than a specified duration. By default, it raises a Low severity alert when blocking exceeds 1 minute, but as with any alert in Redgate Monitor, we can adjust the threshold and set multiple levels of alerts for different thresholds. We’re also likely to see Long-running query alerts relating to any blocked-process queries.
The Blocking process alert in Figure 4 relates to the head blocker in our chain, session 79. It has three blocked descendants. The session isn’t executing any SQL; it is simply a transaction that has failed to commit, and is still holding locks on the target table.
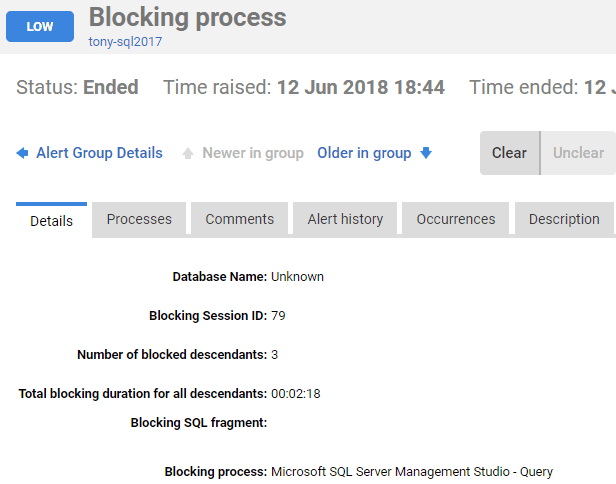
Figure 5
Switch from the Details tab to the Processes tab, and you’ll see the blocking process at the top followed by the complete chain of blocked processes.
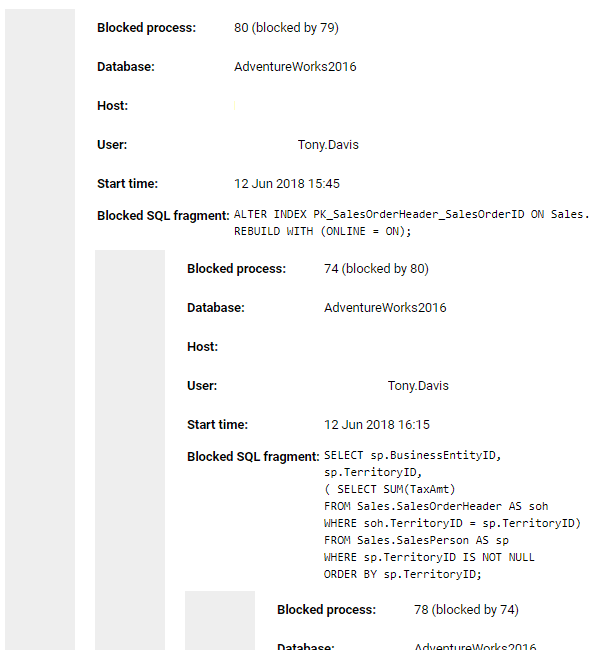
Figure 6
You now have the details of the application and user that issued the blocking statement, and can investigate why the transaction apparently ‘hung’ without committing. To resolve the blocking you may be able to simply kill the offending process, like in this case.
In the Performance Data section of the alert page, on the Top queries tab, we see any queries that ran around the time of the alert, revealing the query that session 79 was running, which failed to commit, with its plan handle.
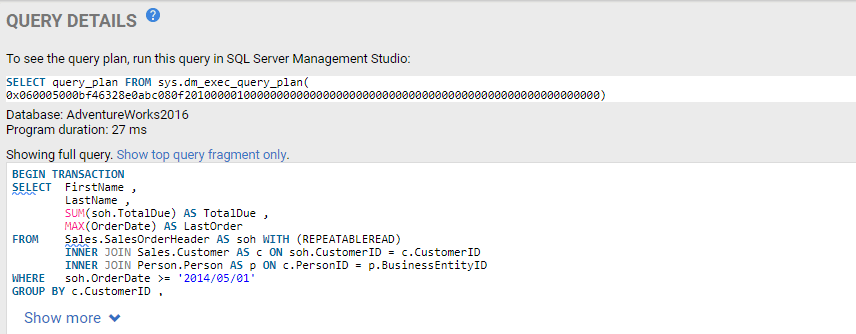
Figure 7
Redgate Monitor also provides as contextual information’s all sorts of snapshots, aggregations and summaries of resource usage on the server around the time of the alert. In this case, we can see the spike in lock waits around the time of the alert (the green line at around 19:20).

Figure 8
Blocking processes (Top 10 by time)
On the Overviews page of the Redgate Monitor interface, we can use the resource usage timeline at the top to select a window of high activity on the server, and investigate any blocking that may have been occurring over that period.
In Figure 9, I’ve moved the sliding window to focus on the period of activity around the time we received the blocking process alerts. We can see spikes in Disk I/O and Waits around that time, as well as a bump in memory use. Below that the Blocking Processes (Top 10 by time) view has captured the blocking process.
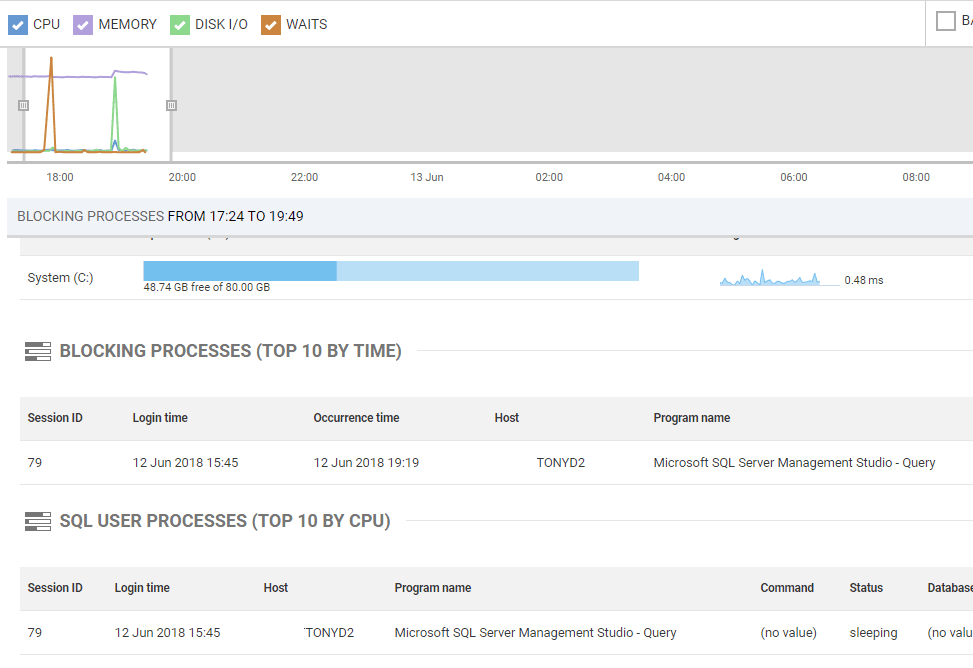
Figure 9
If you click on one of the blocking processes, you’ll see the full blocking chain, along with the details of which application issued the process, what resource it was waiting to acquire, the SQL text it was executing, and more.
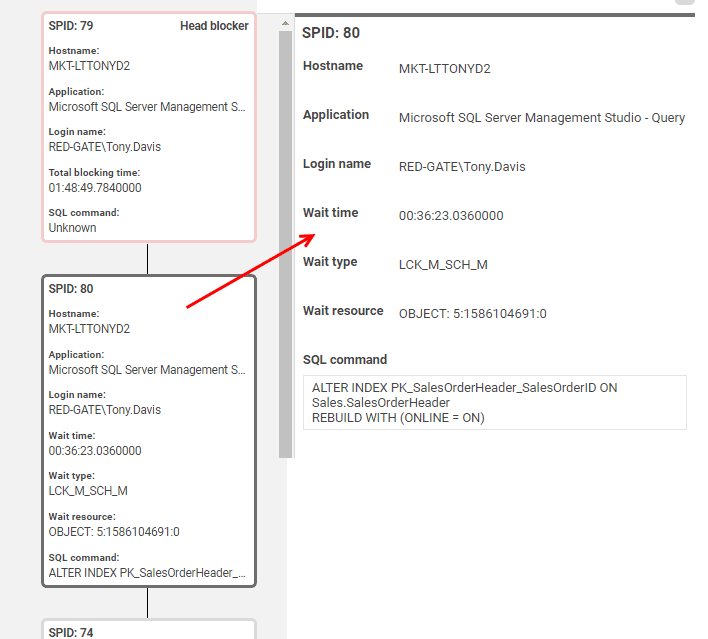
Figure 10
Resolving blocking
Very often, resolving blocking issue requires tuning inefficient queries and data modifications that run longer than necessary, and therefore cause blocking. Sometimes, queries run within transactions, when there is no real need for them to do so. Transactions need to be kept as short as possible, without compromising transactional integrity. Sometimes indexes will help. In our example, session 79’s query had to scan the entire SalesOrderHeader table, due to a lack of appropriate index on the search column (Orderdate). This means it likely read more data than was necessary, took longer to run, and so held locks longer than it needed to.
There are other possible issues to look out for. Figure 8 shows that session 79’s query ran under the REPEATABLE READ isolation level. Aside from finding out why the transaction failed to commit, we could investigate whether the query truly requires this restrictive isolation level, where locks are held until the transaction commits. By rewriting to use the default READ COMMITTED isolation level, S locks would be released after statement completion, meaning that the index build would not be blocked, once the query had completed. Alternatively, we might consider using one of the snapshot-based isolation levels, such as READ_COMMITTED_SNAPSHOT. It prevents any read phenomena, and in this level, transactions don’t take S locks when reading data, so don’t block other processes. Kalen Delaney’s SQL Server Concurrency eBook (free download) provides a lot more details on the advantages, and possible drawbacks, of snapshot-based isolation levels.
A final option, in this specific example, might be to use WAIT_AT_LOW_PRIORITY option (SQL Server 2014 and later) for the online index rebuild. This would allow some waiting sessions to skip past it in the queue, if the index rebuild itself was blocked. In this example, using this option, session 74 would not be blocked, since it could skip past and acquire the S lock it needed on the SalesOrderHeader table, since this lock mode is compatible with the S lock held by session 79.
Summary
Locking and blocking is a normal and required activity in SQL Server. However, if we execute long, complex transactions that read lots of data, and take a long time to execute, then locks will be held for extended periods, and blocking can become a problem. Likewise, if our databases lacks proper design characteristics, such as keys, constraints and indexes, or if our transactions use restrictive transaction isolation levels (such as REPEATABLE READ or SERIALIZABLE).
If blocking becomes severe, database performance grinds to a halt, and as a DBA we need to act very quickly, before an icy atmosphere develops among users.
Tools in this post
Redgate Monitor
Real-time multi-platform performance monitoring, with alerts and diagnostics

