The four best features to look out for in Redgate Monitor
I’m a Data Architect and I’ve been working with data and databases for years at companies like LA Fitness, Dell and now Kingston Technology in Fountain Valley, California. Over all of that time, I’ve used Redgate Monitor. I loved it from the beginning and the latest updates to the global overview dashboard and other features have stepped it up another few notches.
I was recently asked by Redgate what my favorite Redgate Monitor feature is, so I thought I’d share my experience of using it, and why I find it valuable. That’s because I don’t have one favorite feature: I have four.
Firstly, a little about Kingston to set the scene. We’re a big company with more than 3,000 people in the US, UK, Ireland, Taiwan and China. You might know us from the solid state drives, memory modules and flash drives we develop and manufacture.
We don’t just develop technology, however – we use it to support the company’s business. We have an IT department at the headquarters in Fountain Valley, and each of our other sites have their own IT department as well. We set a lot of the standards here and build the structure to push out to them.
It’s a complicated business because we use and develop a lot of applications and databases. So in California, we have four scrum teams with full stack developers, all in charge of their own applications that connect to many different databases. The applications and databases are developed side-by-side and there’s a common workstream for both of them.
Our DBA team of four DBAs and one manager assist with anything the teams need here, and we also have further DBAs in Europe and APAC to help their development teams. All of the sites have their own databases, and in Fountain Valley we have a data warehouse along with around 70 servers, with each server having maybe 20 to 30 databases for the different development, test and production environments.
All of that makes it quite a complex SQL Server estate and the biggest thing I care about is performance. If something is running slow, if there’s a problem or an issue, we need to go and take a look, dig around and find out what’s going on in order to resolve it.
There’s a checklist we go through each day at 7am that includes running through any email alerts that have come through from Redgate Monitor, and looking at any outstanding alerts. So perhaps I notice on a Monday that the indexing wasn’t done on the weekend. I look further into that, and review everything else that is going on with our servers.
That’s where Redgate Monitor comes into its own, thanks to the four favorite features I mentioned which make my life a lot easier. I’ll explain each of them in turn, using screenshots from the online demo of Redgate Monitor, which shows a live feed of how SQLServerCentral, the largest education and community site for SQL Server, is being monitored.
The analysis graph
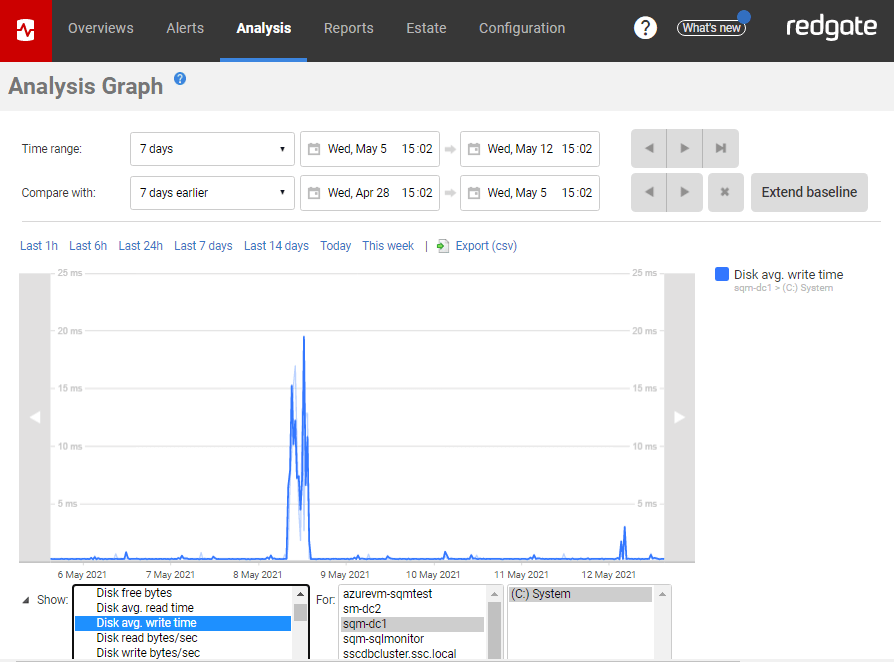
My number one Redgate Monitor feature is the analysis graph which lets you look into alerts a lot further and deeper. You grab the server you want to look at and all the different metrics are in there that you can pull out one by one for whatever you need. There’s a lot, and you can change the timeframe which is useful because you can see the history by a range of different periods, from one hour to 14 days.
So if something happened over the weekend, like maybe a deployment was made, you can dig into it. If it did cause an issue, you can go to the team responsible and show them the graph. When you have data like that to show other teams, it’s really useful.
I also like that fact that if I’m not too familiar with something, it has a description panel that explains it. I use that for some of the newer DBAs, often telling them that if they don’t know what the analysis graph means, if they’ve never used a particular metric before, the little description will give them a better idea of what they’re working on.
The deadlock graph
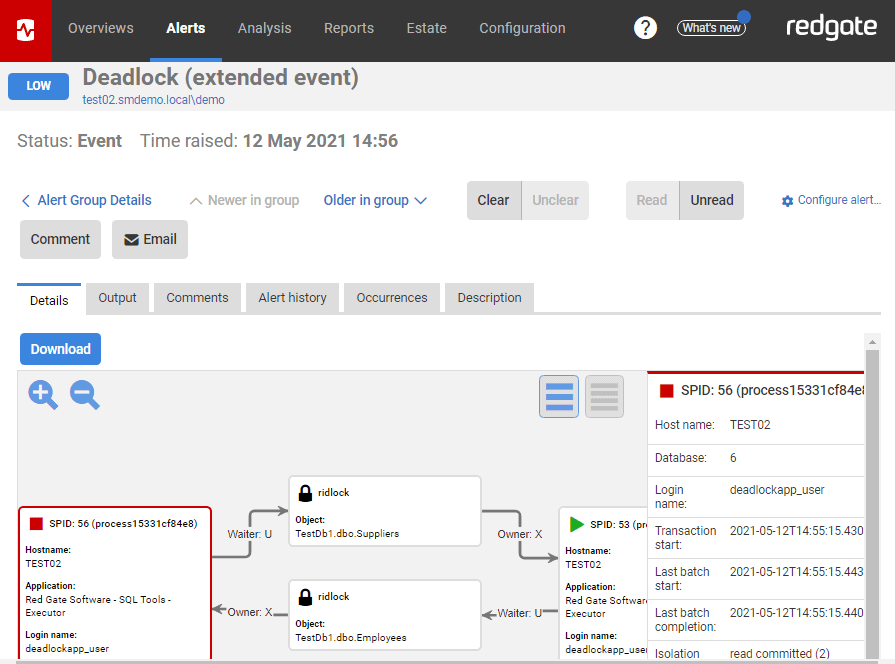
The deadlock graph provides a similar kind of capability and is really good because you can see the alert history, the occurrences, a description and the output. The graphical part is pretty good and you can download it and view it some more, which helps to pinpoint what’s being affected.
So if someone added a new process or something, we can see if we need to move some stuff around or whatever. You can see the top queries and it also has a part where you can turn on the profiler trace for more information
It’s not just the DBAs who use Redgate Monitor, by the way. I’ve granted access to the developers so they can troubleshoot when they get a deadlock or something and take a look at the graphs and that type of stuff. They like that they can go on it – and I like it too, because I don’t have to provide them the information all the time.
The estate tab
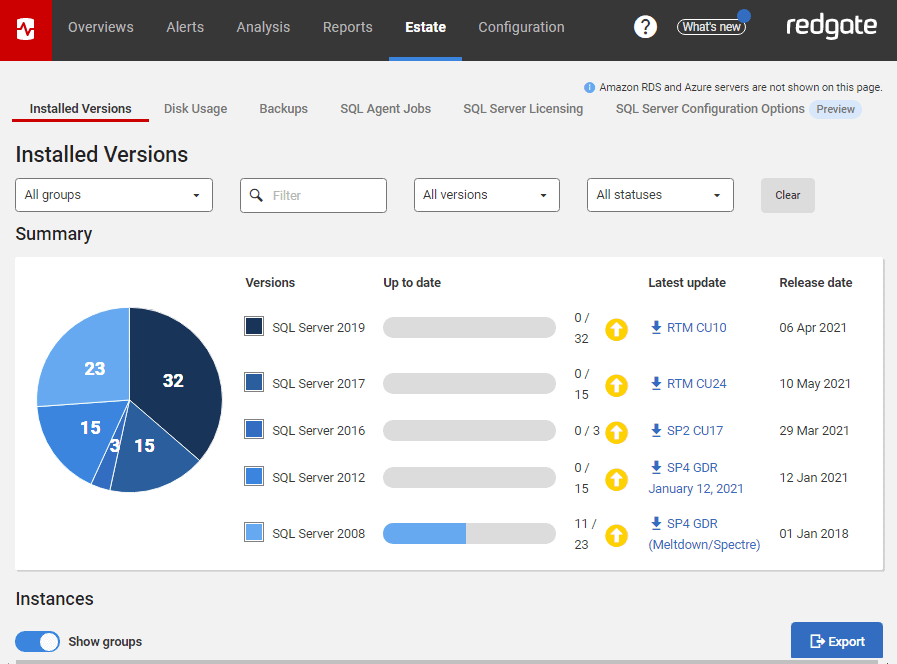
I like the estate tab a lot, which helps with things like patches and updates. We have four different versions of SQL Server and it will tell me if I need to patch one version but the other three are good. I look at this all the time because I’m in charge of the patching so it’s very useful for me because we have so many servers and it shows them all in a graphical way.
With 70 servers to manage, the estates tab also helps with planning in terms of resource issues, space issues, and capacity issues as well. There are lots of other alerts available, but I’ve fine-tuned Redgate Monitor to give us only the alerts we need for our estate. Like all tools, it’s good to have more alerts than you need and then you can just pick those you want to filter out the noise.
The reports
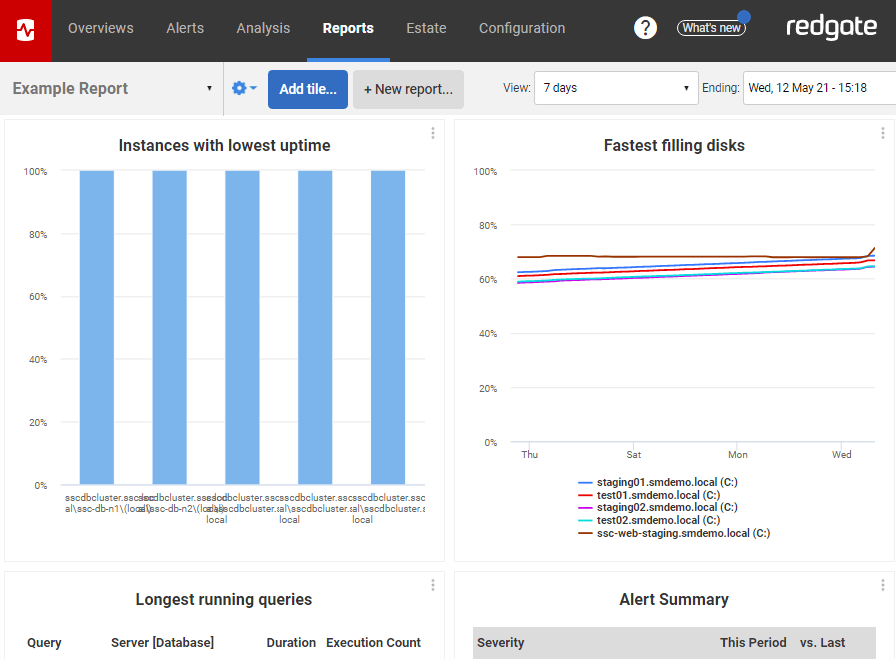
Finally, I love the custom reports which help us stay proactive on the areas we’ve identified as hot spots we need to work on. We also pull out the standard reports every Wednesday but we’ve modified them a little to also help us identify long-running or inefficient processes.
When they occur, we can take that report and go back to the developers and say “Hey, take a look at this, here’s the latest report – can you go into your server and fix this?” I really like that because I can show them and demonstrate I didn’t make it up.
Summary
As you can probably tell, I’m a big fan of Redgate Monitor. I’ve used it for many years and over those years more and more features have been added. It’s become the complete SQL Server monitoring tool that helps us keep on top of a big estate and make sure that it performs at its best.




Loading comments...