Security and compliance
Ensure data security and compliance with data masking, monitoring, and change traceability
Ensure data security and compliance with data masking, monitoring, and change traceability
Monitor and understand your databases with full visibility into performance and change
Build, test, and deploy database changes with confidence
Simplify and speed up database development workflows
Prepare reliable data foundations for AI initiatives
Simplify and secure database modernization across platforms
Control costs and boost efficiency in database operations
Simplify and speed up cloud database transformation
I recall one afternoon when the phone rang, instantly shattering the peace and calm of my DBA cubicle. It was a developer, in a panic having accidently deleted some data. Could we perform a quick restore? I navigated to the backup location, only to find that the most recent backup was from the previous week. It turned out that SQL Server Agent backup job had been blocked for several days and had never completed. It was still running in fact!
We managed to restore their data eventually, but it was clear we had a deeper problem. We'd had a similar issue only the previous week, when a nightly load process ran long, causing resource contention. I was pretty proud of our automated database maintenance regime. It was solid, jobs very rarely failed, and we always received prompt error alerts if they did. However, I was beginning to realize that this alone was not enough. While our agent jobs almost always completed successfully, there was clearly a lot variability in their duration of which we had been unaware.
We need to know not only when jobs failed, but also when they displayed uncharacteristic behavior. In short, we had to find a way to track SQL Server Agent job duration over time, and be alerted to anomalies.
SQL Server Agent is a built-in scheduling engine for SQL Server. It puts control over automation into the hands of DBAs, most of whom use it to automate a variety of SQL Server maintenance operations. It's fairly easy to set up SQL Server Agent, and to create jobs and schedules. There's an entire Stairways Series to get you going, if you need help.
Assuming you have it all up and running, however, how do you then track the behavior of your jobs? There are several ways to do this, using either the SQL Server Management Studio (SSMS) graphical user interface, or T-SQL queries. Let's explore them.
The most obvious tool to try is the Job Activity Monitor, found inside the SQL Server Agent folder, in SSMS.
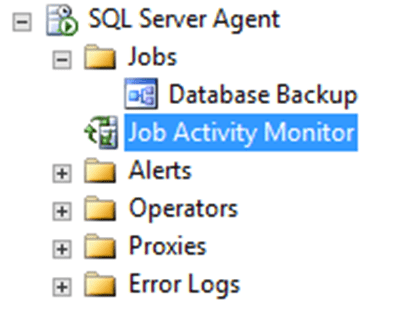
Figure 1 – opening Job Activity Monitor in SQL Server Management Studio
Double click this, and you can see the status of all the jobs defined on your system. You can apply filters to search for jobs by job name, or status, when they last ran, or are scheduled to run next, and so on. This will let you see if a job is running and if it has run successfully. However, it doesn't tell you anything about the behavior of that job over time. Is this job running longer than usual? It's hard to tell from here. That's why you'll go to the Log File Viewer.
To open the Log File Viewer window, right click on any job within SQL Server Agent and select View History from the context menu. This is a generic window used to view logs for SQL Server Agent itself, the jobs within Agent, and SQL Mail. Again, you can filter for a particular job or even search the job history.
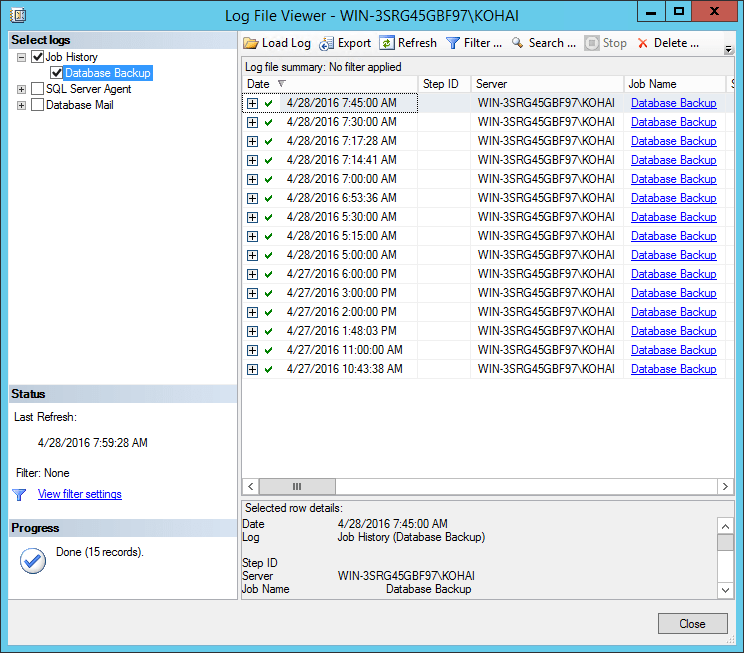
Figure 2 – history of database backups in the Log File Viewer
To find out if a job has been running unusually long, simply scroll and then browse through the Duration of the job over time. Figure 3 shows a sub-set of the history of my backup job.
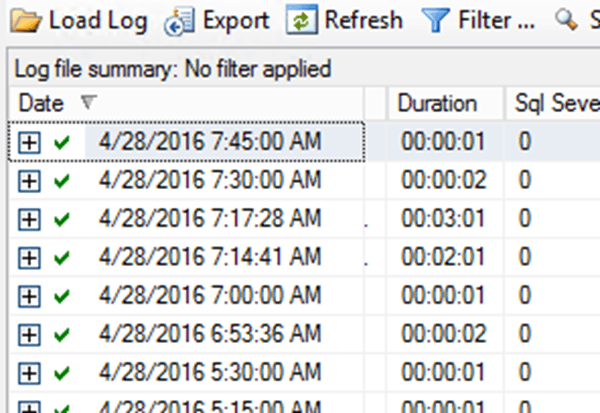
Figure 3 – checking the duration of backup jobs in the Log File Viewer
It reveals that while the job generally completes in one or two seconds, on a couple of occasions, the job ran for 2 or even 3 minutes. This is a pretty radical deviation from the normal behavior.
The problem we have here is that scrolling around in the window and trying to track down this information is time consuming. Instead of using the GUI, it might be easier to track down the data using T-SQL
The history of SQL Server Agent jobs is stored in the msdb system database. Listing 1 shows a query that retrieves the information and puts it in the order of duration.
USE msdb;SELECT j.name , jh.sql_severity , jh.run_duration , jh.run_date , jh.run_timeFROM dbo.sysjobs AS jJOIN dbo.sysjobhistory AS jhON jh.job_id = j.job_idORDER BY jh.run_duration DESC;
Listing 1 – a query to sort the history of SQL Server Agent jobs by duration
The data returned from the query looks as shown in Figure 4.
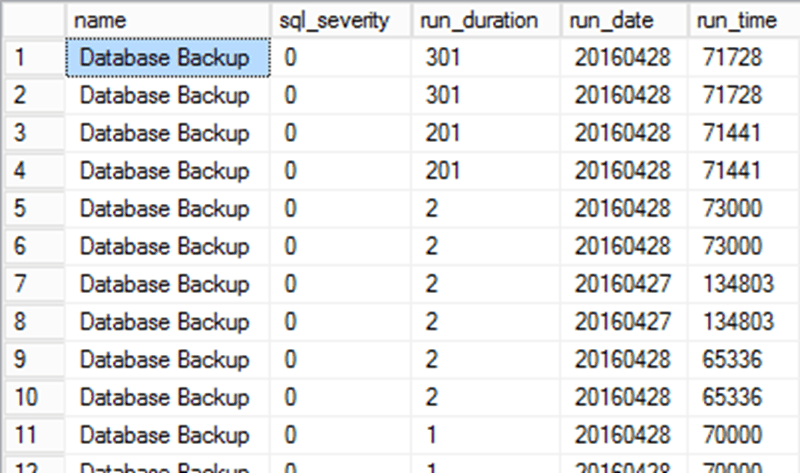
Figure 4 – a history of database backup jobs, sorted by duration
We can now see the longest job durations, and when they occurred, very easily. Of course, another issue has come up. The data in dbo.sysjobhistory for run_date and run_time is stored as strings, so to make this data useful you'd need to do a CAST and CONVERT.
While this technique makes it easier to investigate job durations, retrospectively, we still haven't addressed the fundamental issue that because this is just a deviation in the standard behavior, rather than an error, our alerting system doesn't currently raise an alert to let us know as soon as these deviations occur. This is where a tool like Redgate Monitor can help.
With Redgate Monitor enabled and running on my server, when the long running Agent job occurred, an alert was fired:
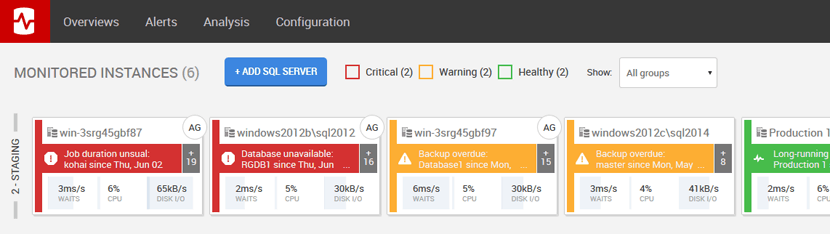
Figure 5 – uncleared alerts in the Redgate Monitor overview
Clicking on that alert we get more detail:
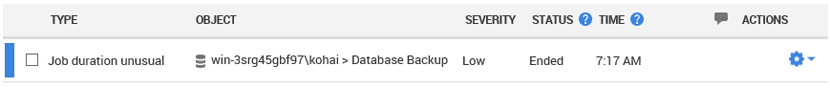
Figure 6 – a 'Job duration unusual' alert in Redgate Monitor
We can see that the alert is called 'Job duration unusual'. It's currently configured as a Low severity alert. If I click on the alert itself, I can get even more detail:
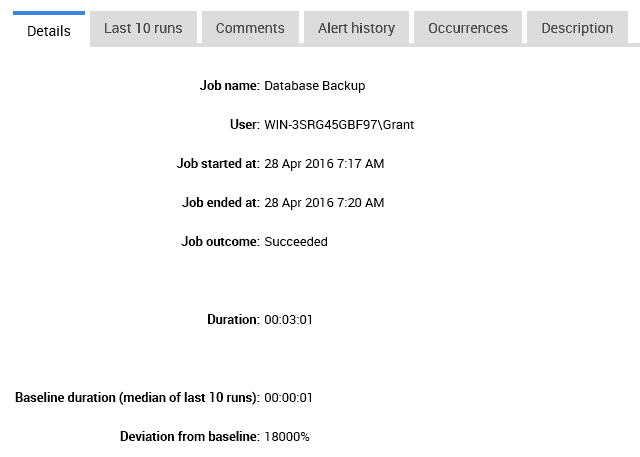
Figure 7 – details of the job that had an unusual duration
We get a lot more information than was easily available within the information from SQL Agent. We can see that the dates and times are actually dates and times. We get the duration of the run and we get the baseline, which is the median of the last 10 runs, in this case, 1 second. We also get the deviation from the baseline, 18000%, a not insignificant number.
We can even take further control over what level of alert is fired, and under what conditions, by customizing the default settings for the alert:
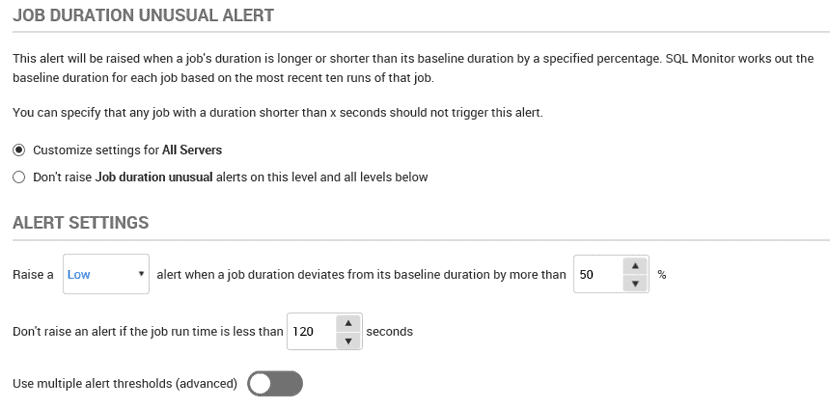
Figure 8 – customizing the settings for a 'Job duration unusual' alert
We can see in the description of the alert that Redgate Monitor calculate a baseline duration for each job, based on the mean duration over the last ten executions of the job. By default, it raises a Low level alert if a job deviates from the baseline duration by more than 50%, but won't raise any alerts from jobs that run in under 2 minutes.
However, in the Alert Settings section, we can customize this behavior. We can control the severity of the alert, changing it from Low to Medium or High as required. We can also specify the size of deviation that needs to occur in order to fire the alert, as well as a minimum threshold duration below which no alerts will be raised.
That's not all. If we switch to multiple alert thresholds, we can set multiple levels of alerts for varying deviations from the baseline duration.
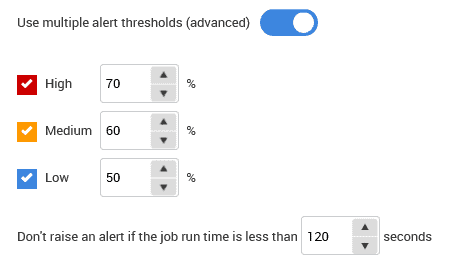
Figure 9 – setting alert thresholds in Redgate Monitor
As DBAs, we need to understand the behavior of the jobs within our system, and we need to be warned immediately of behavior that strays significantly from what's normal. It is no fun to get that surprise phone call informing you that an important process has run too long and is causing problems for the business.
By ensuring we receive alerts not only when jobs fail, but also when they show irregular behavior, and by taking granular control over why and when these alerts are raised, we can gain much tighter control over job activity on our servers, and minimize nasty surprises.
Whether you want more details about Redgate Monitor, a demo or information on best practices – get in touch with us.

Redgate has specialized in database software for over 25 years. Our products are used by 92% of the Fortune 100. 200,000 customers rely on Redgate worldwide.

Redgate offers comprehensive documentation and a friendly, helpful support team. An average 87% of customers rate our support 'Excellent'.


