Monitoring Azure SQL Database with Redgate Monitor
Grant Fritchey explains the Azure-tailored metrics and alerts that you need to diagnose performance problems with your Azure SQL Databases, and let you know which resource (CPU, data IO or log IO) is the bottleneck.
Azure SQL Database is a ‘cloud database’, but it is just a normal SQL Server database under the covers, and so many of the metrics and alerts that you need for monitoring Azure SQL performance are the same as those you need for any other SQL Server instance. The difference with Azure SQL DB monitoring is that you’re now dealing with a SQL Server database on a cloud-hosted, co-tenanted Azure machine over which you have no responsibility, or access. You don’t, for example, have access to the underlying storage, or to the VM that is hosting the Azure SQL Database. This means that some metrics are irrelevant or off-limits. For example, there is no equivalent database metric for a server characteristic such as disk space, or machine processor time, and Azure SQL Database does not even support SQL Agent jobs.
However, you still need to collect and monitor Azure-tailored metrics that will tell you how the database is consuming resources such as storage space, and CPU, as well as a few “unique” metrics you wouldn’t normally require. For example, Azure SQL Database will have “compute resource” constraints, as measured by the number of DTUs, or the vCore quota, available with your chosen performance and storage tier. This requires a few special types of metrics and associated alerts so that you’re informed immediately of performance problems with your Azure SQL Databases, and can understand quickly if it’s a compute resource problem, and which resource is the constraint. If it is, you’ll also the diagnostic data, such as details of expensive processes and queries, their execution statistics and query plans, and associated wait statistics profile. This will allow you to decide if it’s a problem that you can solve with tuning and indexing, or if you need to go to a higher service tier.
Redgate Monitor aims to provide all the required standard performance metrics, specialized metrics and supporting diagnostic data, regardless of where your SQL Server databases are hosted. You can use it to monitor all your databases, regardless of whether they are on local physical servers or virtual machines, or in the Azure cloud. This article will show you how to integrate your monitoring strategy to take account of what’s required for monitoring cloud databases like Azure SQL Database. I do not cover other Azure-based SQL Server hosting options that are simpler to integrate, such as Azure SQL Managed Instances or SQL Server running in an Azure VM.
Why use a monitoring tool?
If you use only Azure SQL Database, then you have the option of using the built-in monitoring that is supplied in the Azure Portal to obtain the overview of your entire Azure SQL Server estate, and to see it within the context of your overall Azure resources. If, for example, you have mixed types of Azure-hosted databases, including MySQL MongoDB or PostgreSQL you can also include these in your Azure Monitoring.
However, this versatility comes at a cost. Only a limited number of database metrics are gathered for you automatically by the Azure system. Alerts require much more of your work to set up. It is going to require you spending lots of your time, your most precious commodity, to make it complete. This means there are advantages to using a tool like Redgate Monitor, which does all this work for you, even if you do have an “all-Azure” estate.
If, as is more common, you have a hybrid SQL Server estate, with some servers and services in the cloud and some local, then if you’re using the Azure Poral monitoring, you would still need to separately monitor all your non-Azure database estate.
Instead, you need a single monitoring tool that integrates the supervision of your on-premise and your Azure servers and databases, and so provides an overall landscape with a common set of metrics and alerts. If, for example, an Azure SQL Database is unavailable, then Redgate Monitor will let you know about it immediately, just as it would for any monitored instance. It also has built-in all the performance metrics and alerts you need to monitor expensive queries, blocking, deadlocking, and so on, on your Azure SQL Databases. Of course, you still have the Azure Monitor tools, and others, to assist if you need to drill deeper into a problem to which Redgate Monitor has alerted you.
Resource allocation for Azure SQL Databases
Broadly, and briefly, the Azure service provisions the various compute resources for each Azure SQL database according to your service tier, and within that the service level, which determines your compute size and in the DTU-based model boils down to the number of DTUs you purchased (I’ll cover the vCore model in a later article).
A DTU is a blended measure of CPU, memory, and data I/O and transaction log I/O in a ratio determined by an OLTP benchmark workload designed to be typical of real-world OLTP workloads“.
The compute size sets the maximum number of available DTUs, which sets the upper limits on the individual computing resources (CPU, data IO and log IO) available to each database, as well as the maximum number of worker thread requests per database, and the maximum number of supported sessions. There will also be limits on the allocated storage space per pool.
If a database uses up its DTU allocation, you’ll need to know which resource is the constraint.
Monitoring Azure SQL Databases
Under the covers, Azure SQL Database is just a SQL Server database and so you will have the same concerns about monitoring performance, behaviors, errors and the like. As such, to a large degree Redgate Monitor looks and behaves with Azure SQL Database largely the same way as it does with SQL Server running on your local hardware or within a virtual machine. However, you will also see differences, and you’ll also have special monitoring concerns depending on exactly how you have set up your Azure SQL Databases, what purchasing model and service tier you’ve chosen, and so on.
This article does not attempt to offer any advice on how to migrate to Azure SQL Database, nor on what options you should choose. I’ve merely set up four Azure SQL Databases to reflect some of the available options and models:
Standalonedb– this is, as you might assume from the name, a single Azure SQL Database and is in the Basic Tier and charged by DTURedgatePool– an elastic pool with three databases which are in a higher performance tier and billed by vCore.Firstshareddbandsecondshareddb– are two single database on the same logical server which are in a higher tier and billed by DTU again.
However, I’m only going to focus on monitoring stand-alone Azure SQL databases in this article. For details about monitoring Azure SQL Elastic pools, see Azure SQL Elastic Pools and Redgate Monitor.
Certain resources limits will apply to your databases (and pools), either DTU-based or vCore-based. If you hit them, you’ll start seeing severe performance issues, and even connection problems. Of course, Redgate Monitor has metrics and alerts that will allow you to see these problems coming and plan for how to avoid them.
Review the overall health of your Azure SQL Databases
Starting at the Overviews screen in Redgate Monitor, you can see the Azure SQL Databases and database pool that I set up for monitoring, as described above.
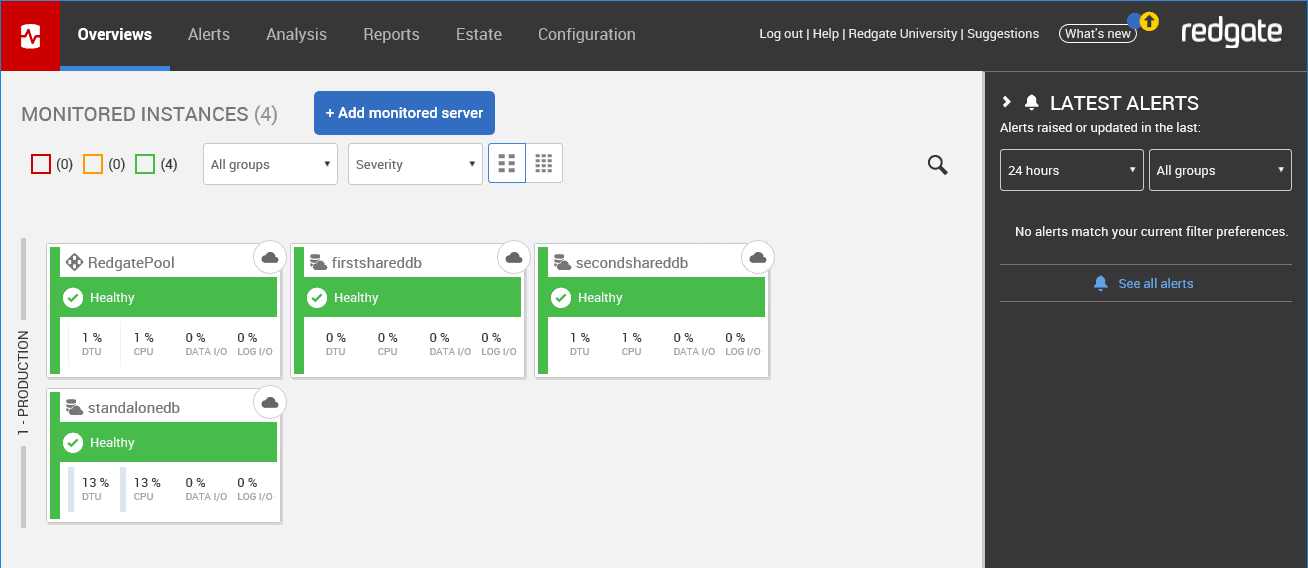
The cloud icons at the top right of each of these tiles indicate that you’re monitoring a cloud-based resource, and the icon at the left tells you whether it’s a single Azure SQL Database or an elastic database pool.
Other than that, in most respects the overviews look and behave similarly to the overviews for any other SQL Server instance. You can tell if a database is online or off. If any alerts have been generated, you’ll be able to see those. You also get immediate feedback on the general behavior of a given database. For example, there is some activity on the standalonedb database as shown here:
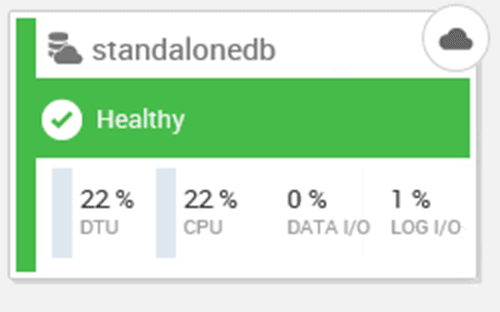
You also get the additional measure of DTU, or Database Transaction Units, which we’ll cover in more detail shortly, and the measures of CPU, Data I/O and Log I/O, which are the metrics that make up DTU.
We’ll review the Redgate Monitor metrics and alerts, using the standalonedb as an example. Putting databases on a shared server makes some areas of management is easier, but basically works the same as a standalone server and database, so I won’t cover that separately.
Resource metrics: DTUs, CPUs, Data and Log IO
Clicking on a database will open a detailed view of the behavior of that database:
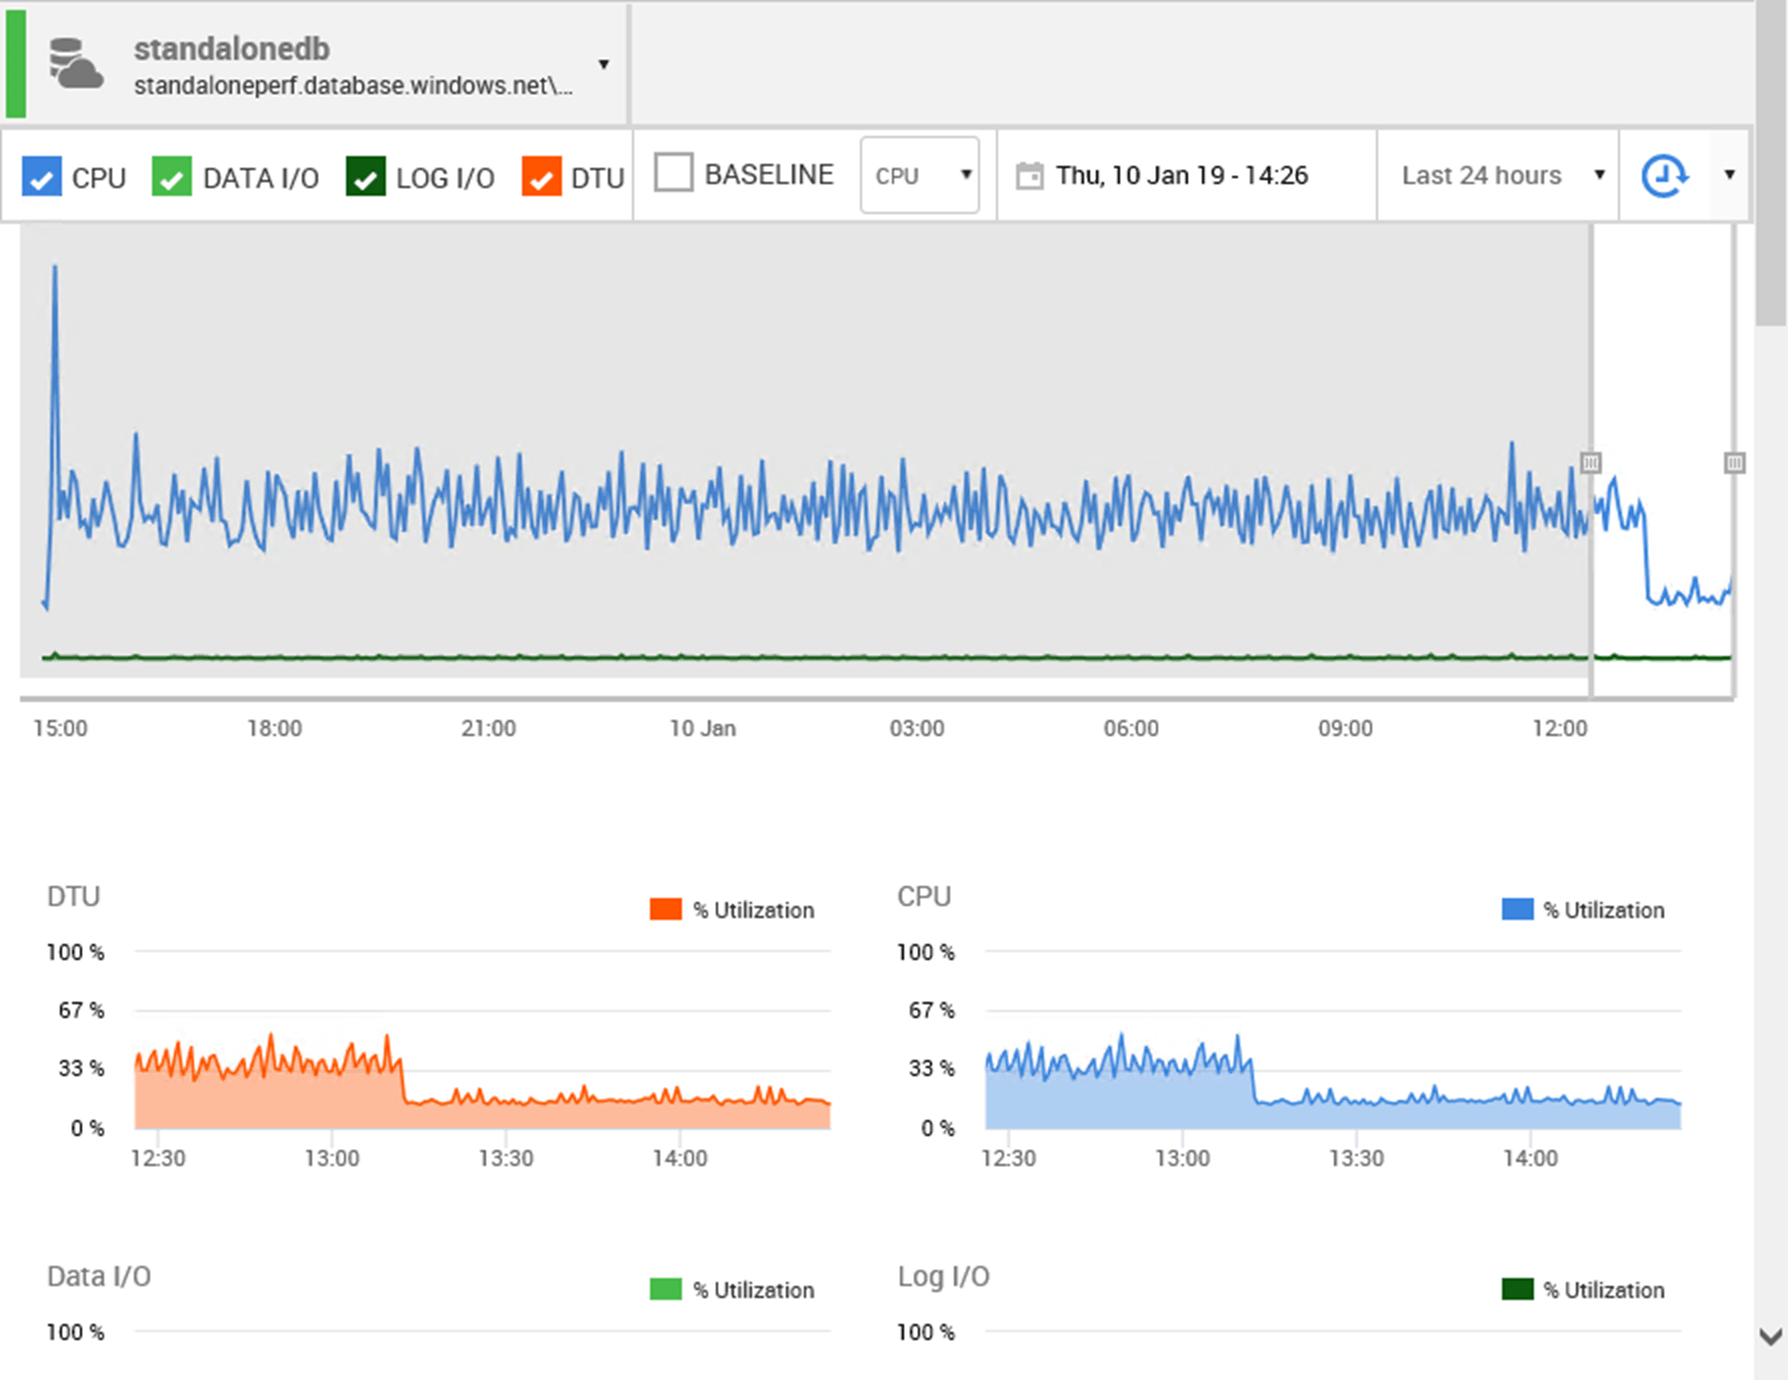
As you can see, Redgate Monitor includes a DTU utilization metric for Azure SQL Database, alongside the CPU Utilization metric. Since billing within Azure can be either by the DTU or by vCore, you need to measure both CPU and DTU. You can see straight away that earlier in the day the CPU and DTU usage was quite different from the normal behavior.
Below that we see the data I/O and log I/O utilization for the database. All these are expressed as a percentage of this database’s maximum allowable utilization. If a database reaches its maximum quota for any of these resources, you’ll start to see severe query performance problems, with queries getting queued. You need to track use of these resources carefully, and as you’ll see shortly Redgate Monitor also provides built-in and configurable alerts on these metrics.
For a SQL Server instance running on a physical or virtual machine, you’d generally see resource metrics such as Disk I/O and Memory here. While a lot of the measurements within Azure SQL Database are the same, many are quite different because the term ‘database as a service’ means that you won’t be looking at a server instance, but instead just have a database, and the resources its currently using.
Of course, you still need to measure I/O, memory use and more, so Redgate Monitor captures these database resource usage metrics from Azure SQL Database-specific DMVs and other metrics available in Azure. For example, it captures CPU utilization data from the sys.dm_db_resource_stats DMV.
Top 10 Expensive Queries and their execution plans
If resource usage is high, and especially if you’re approaching resource limits, you’ll want to look at the longest-running, or resource-intensive queries that are active on the system. Scrolling, further down the overviews page, we find them. In my case there’s only a few queries currently generating a test load but on a larger system, you would see the normal top 10 queries:
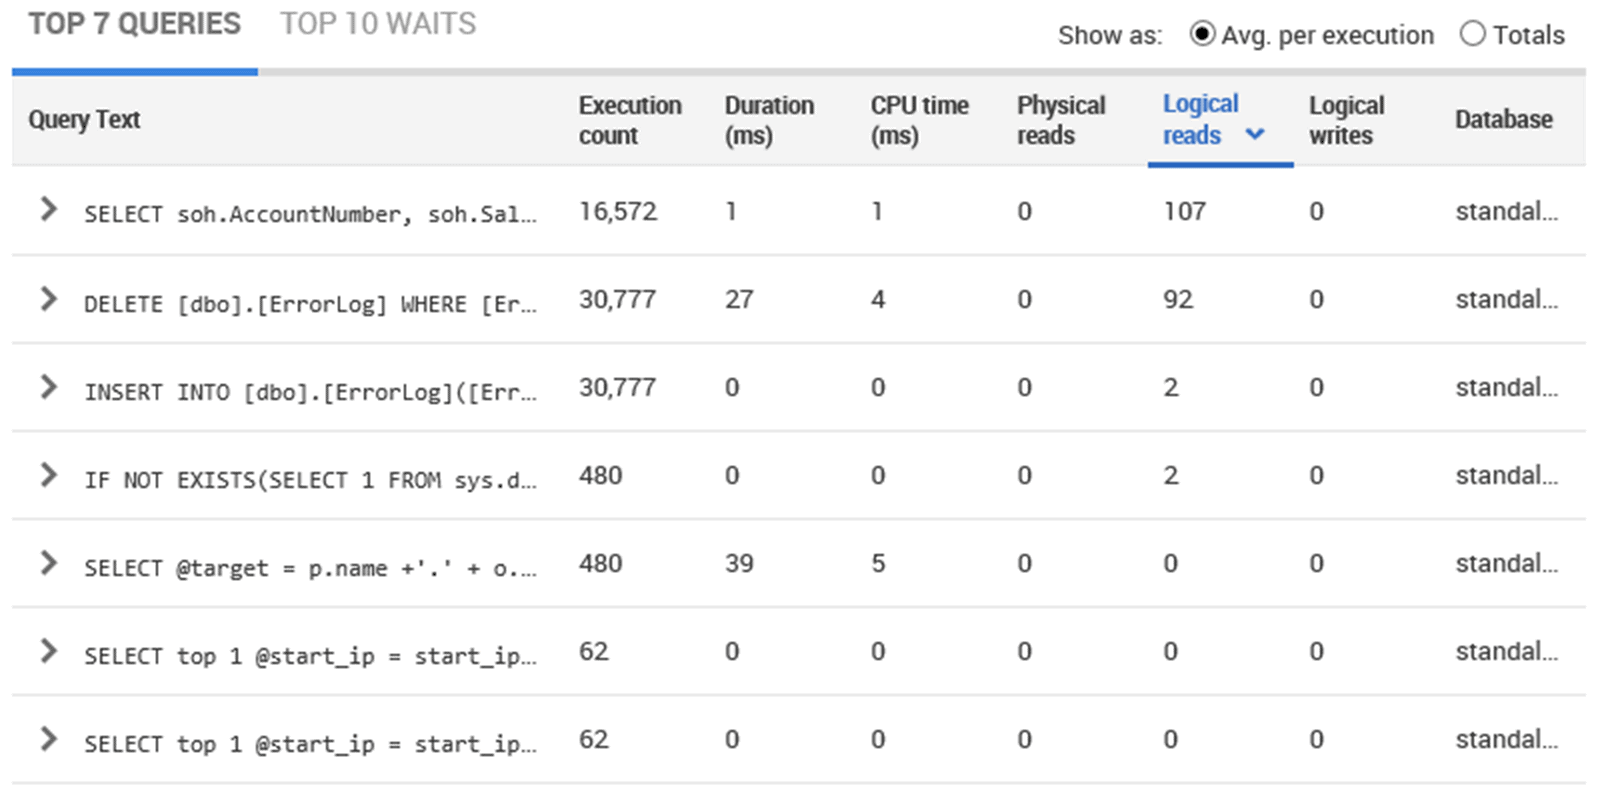
You can sort queries by execution count, duration and all the rest. You can drill down on the query to get the execution plan, associated T-SQL statement, and the query history:
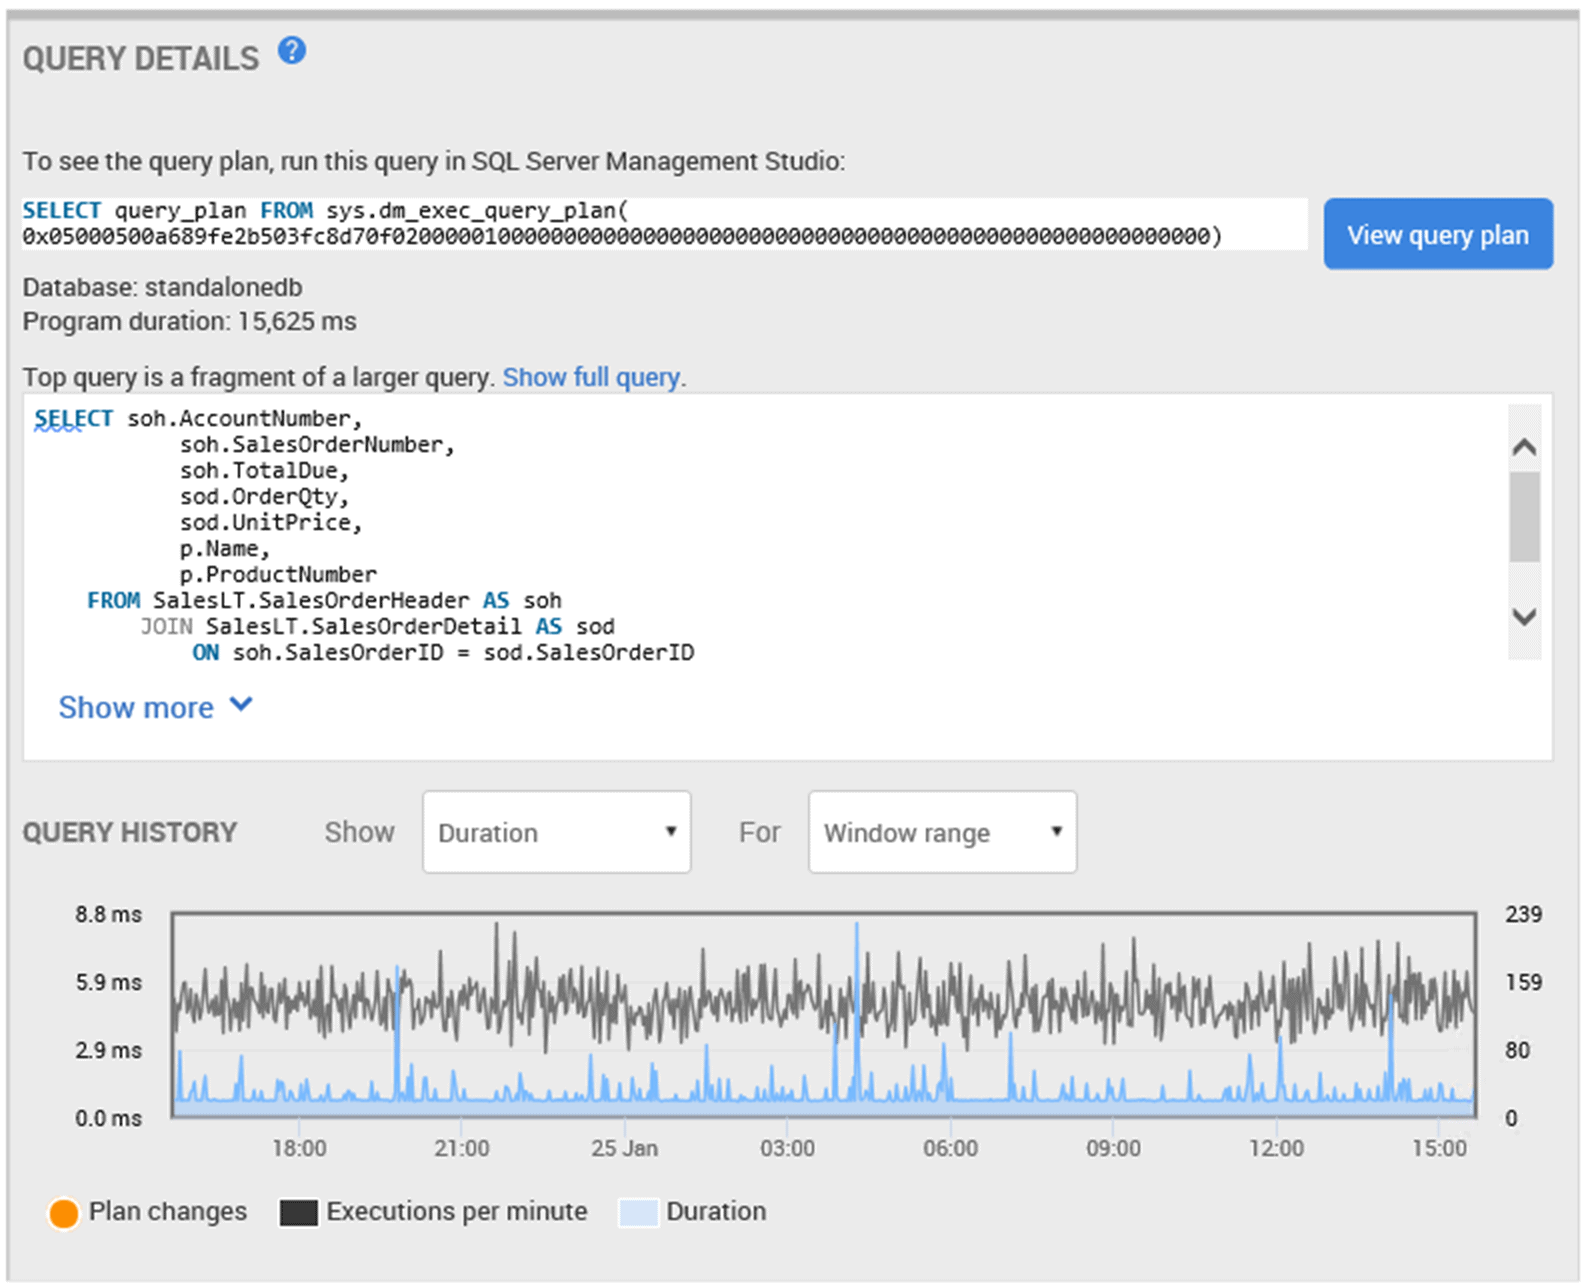
All this is the same information you get from Redgate Monitor for any SQL Server instance.
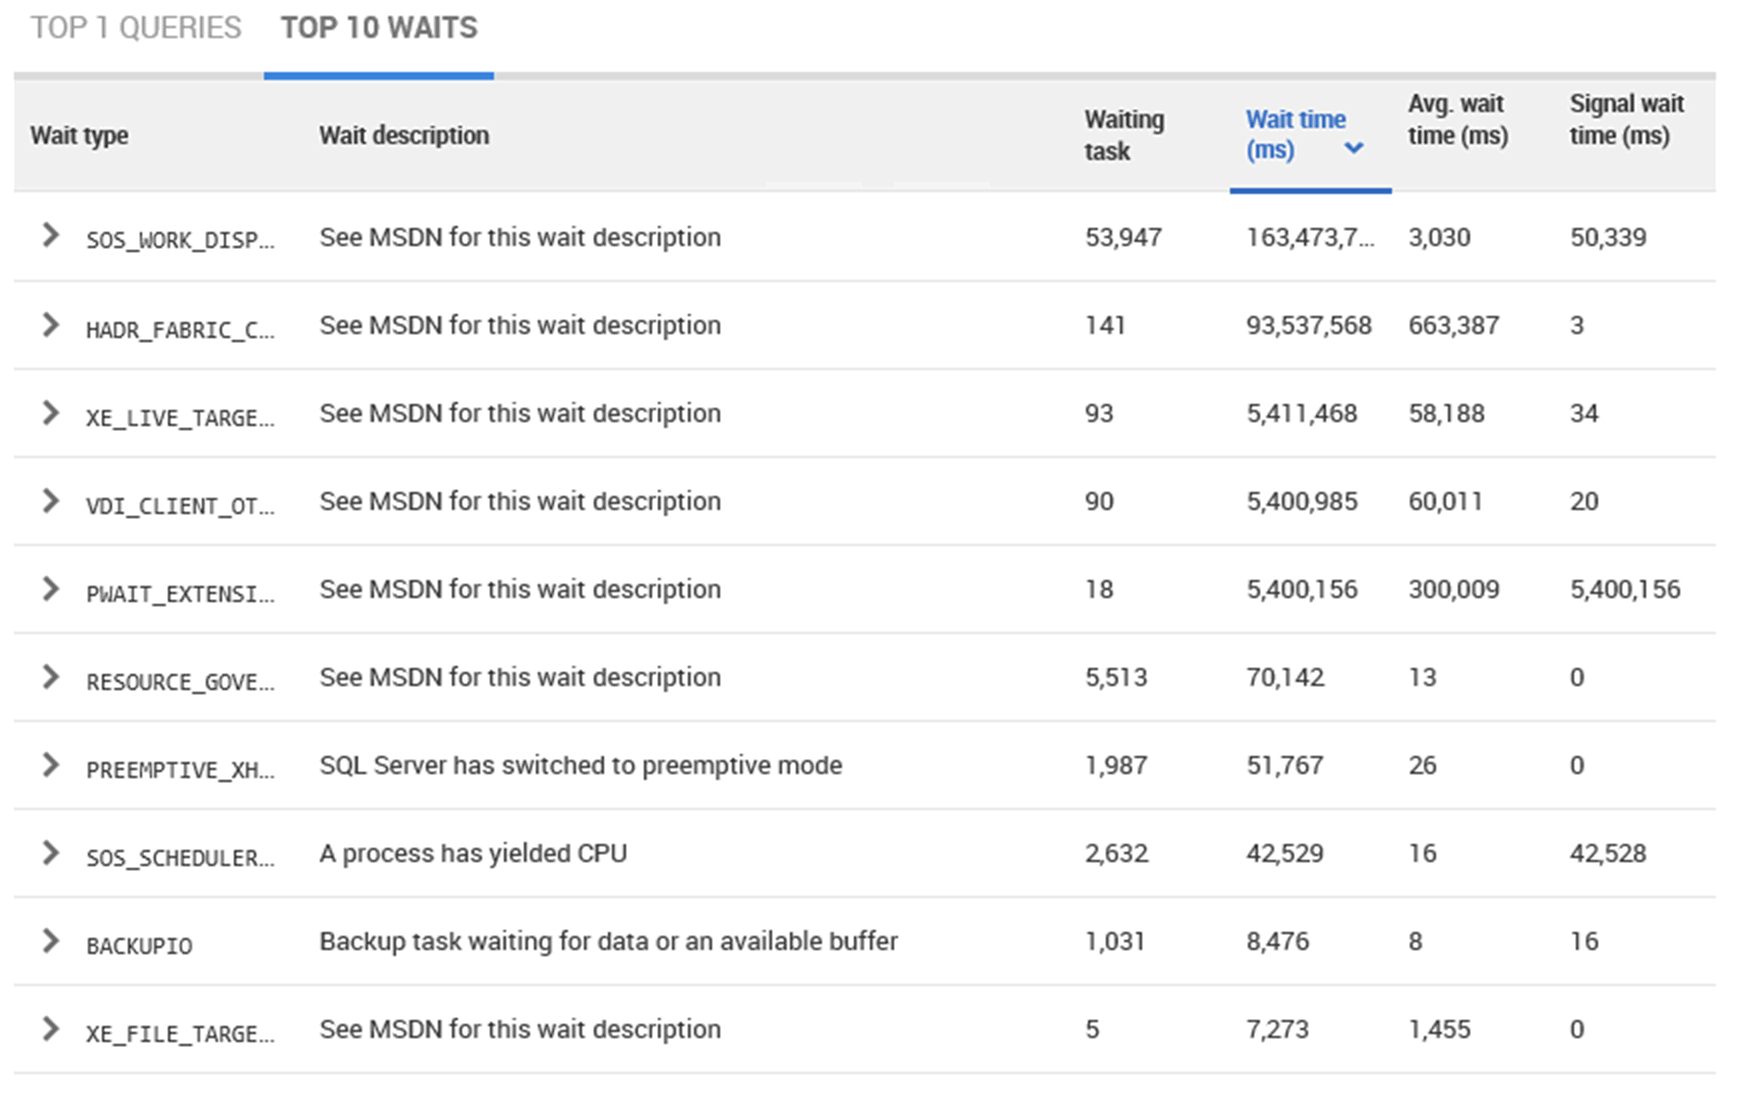
Wait statistics
In addition to the queries, you can also see the wait statistics. Again, the behavior here is exactly as you would expect within a SQL Server instance. The only difference is that these waits are from sys.dm_db_wait_stats instead of from sys.dm_os_wait_stats because this is an Azure SQL Database.
SQL Server performance metrics
Scrolling down even further you get most of the metrics you expect to see, demonstrating general performance of the database:
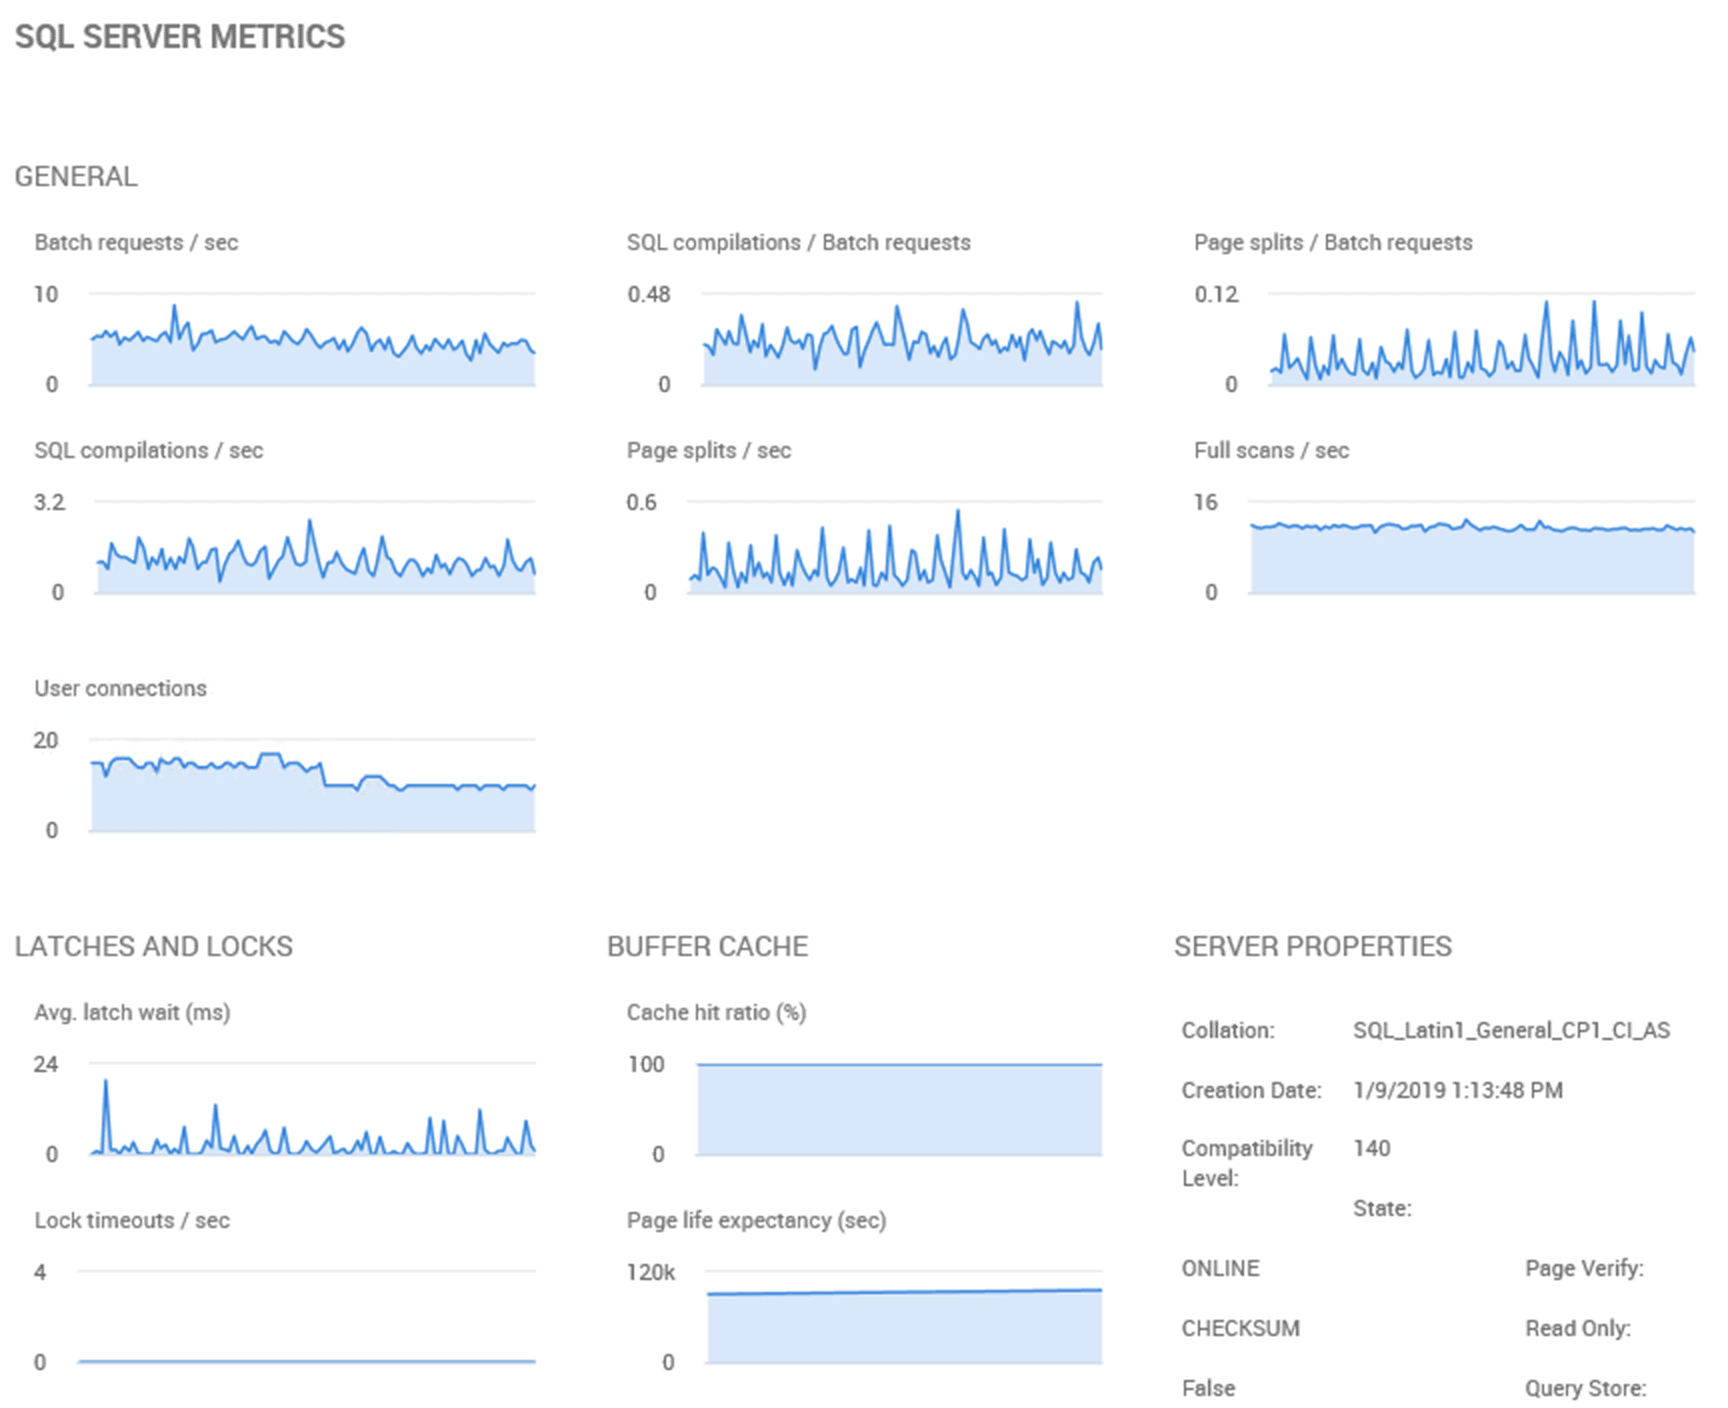
It is as important to track metrics such as lock and latches, batch requests, SQL compilations in Azure as it is inside a SQL Server instance, so all that data is made available.
Analyzing trends and correlations in database metric values
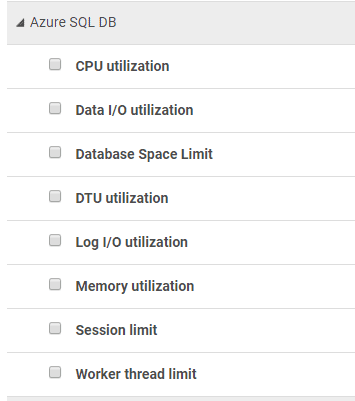
Redgate Monitor shows the complete list of Azure SQL database metrics we collect on the Analysis screen:
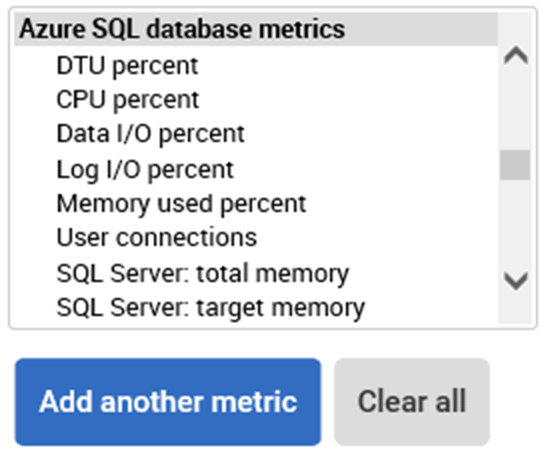
This means that, just as with any other metric from any SQL Server instance, we can plot and analyze relevant metrics for our Azure SQL Databases and create baselines for comparison with previous behavior over a similar period.
Here’s a baseline showing CPU percentages for a 1-hour period, compared to the previous hour, and extending that comparison the previous 7 days:
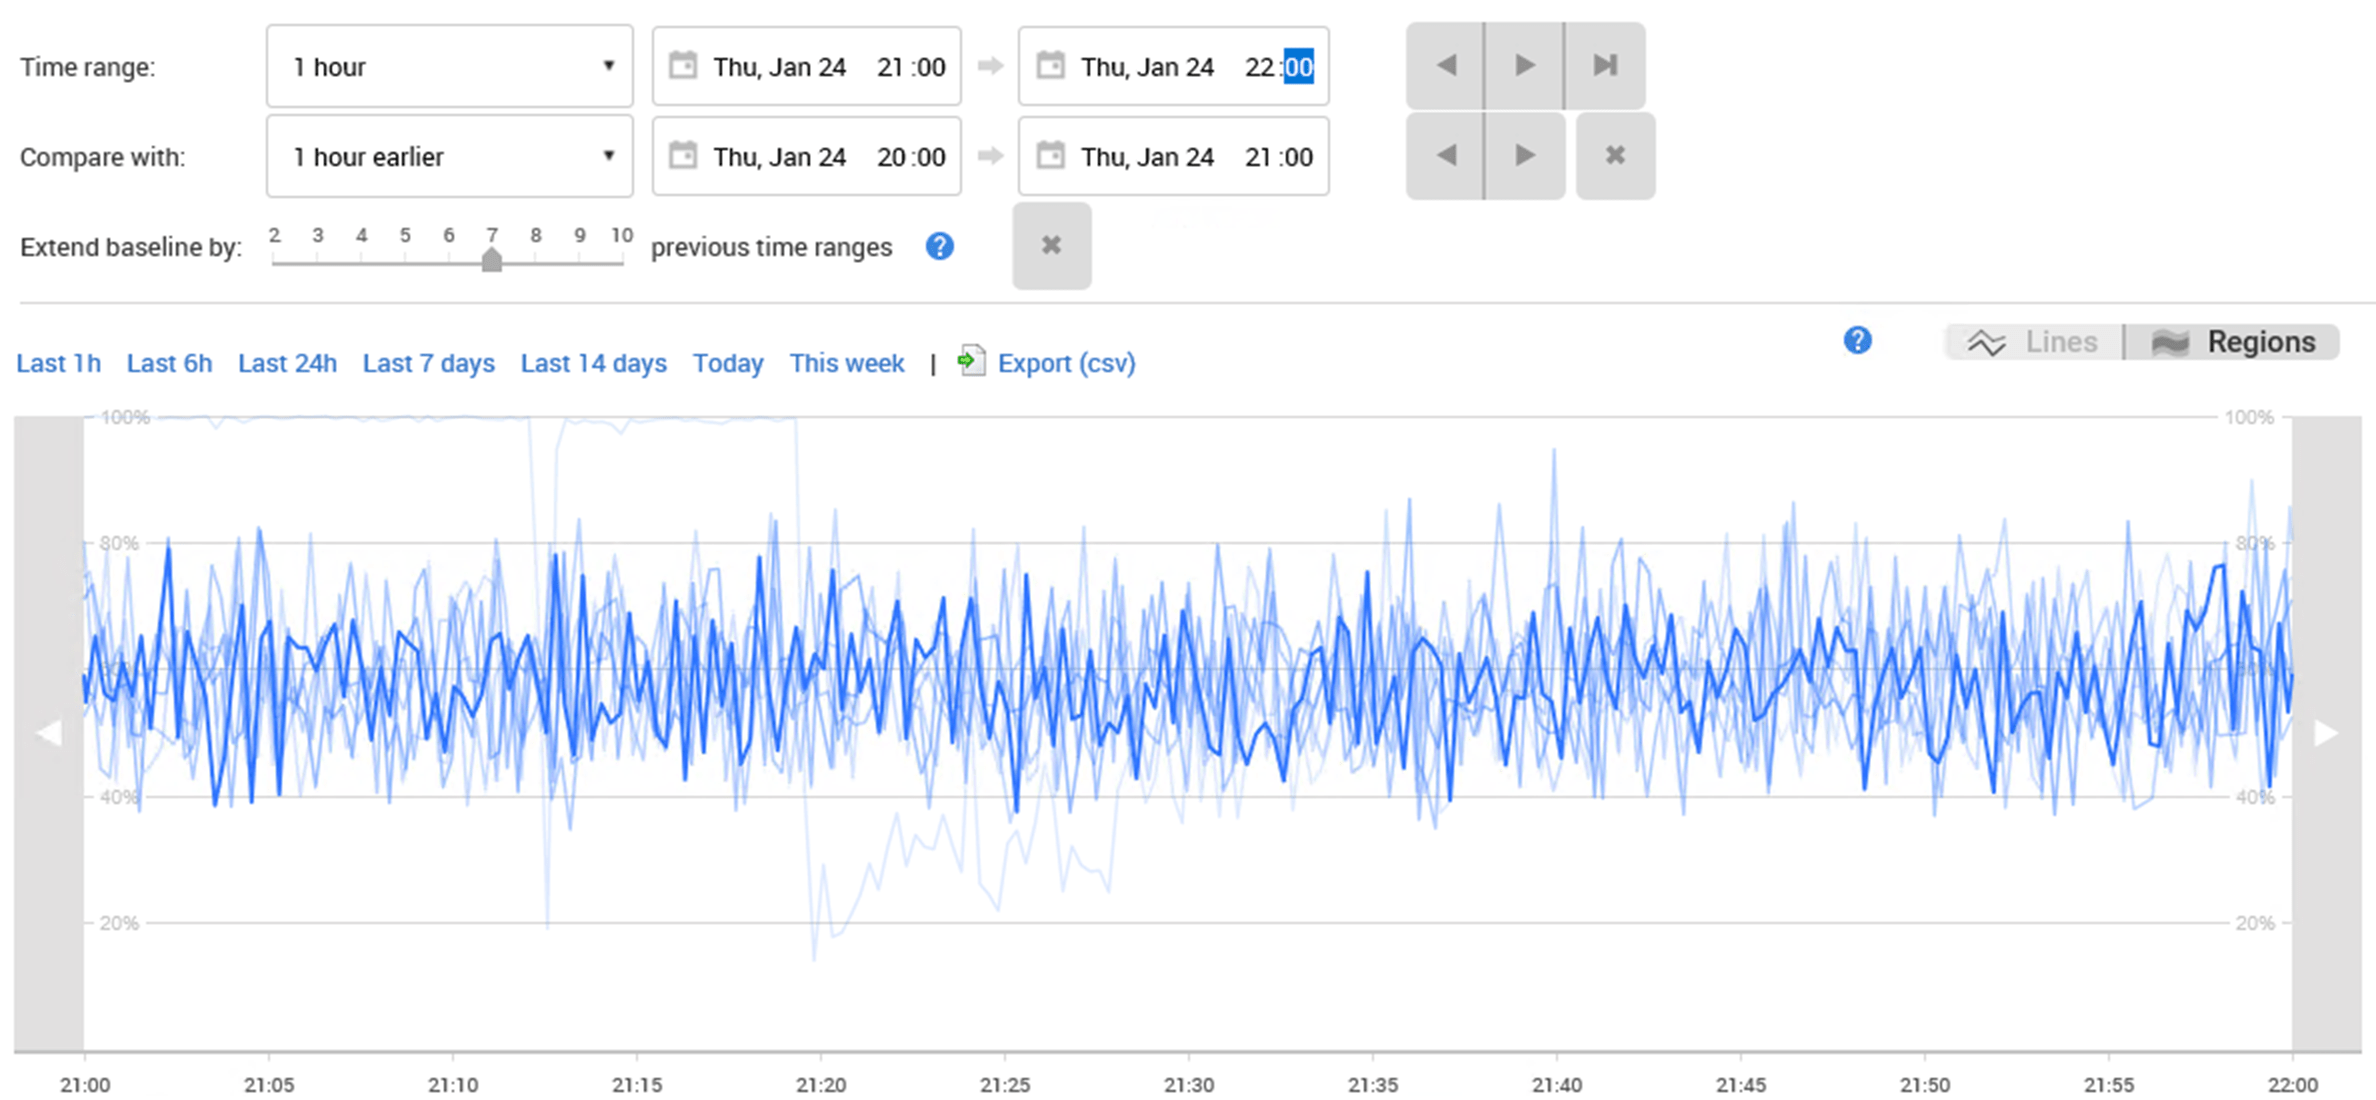
The lighter line on the graph indicates that the CPU was maxed for an extended period, and there was also a brief period where the CPU was below the reasonably steady state that this graph shows is normal for this database. This provides information that could be useful in cparing current to previous behavior within Azure SQL Database, just as you would within a regular SQL Server instance.
Azure SQL DB alerts
Most alerts that you’re going to want for an on-premises SQL Server instance, an instance running inside a VM locally or on the cloud, or even an Azure SQL Database within a SQL Elastic Pool are going to be the same. Errors, deadlocks, these things don’t change. However, since some metrics are captured in different ways and some metrics have different meanings, a different set of alerts are included out of the box for both the Azure SQL Database (and SQL Elastic Pools).
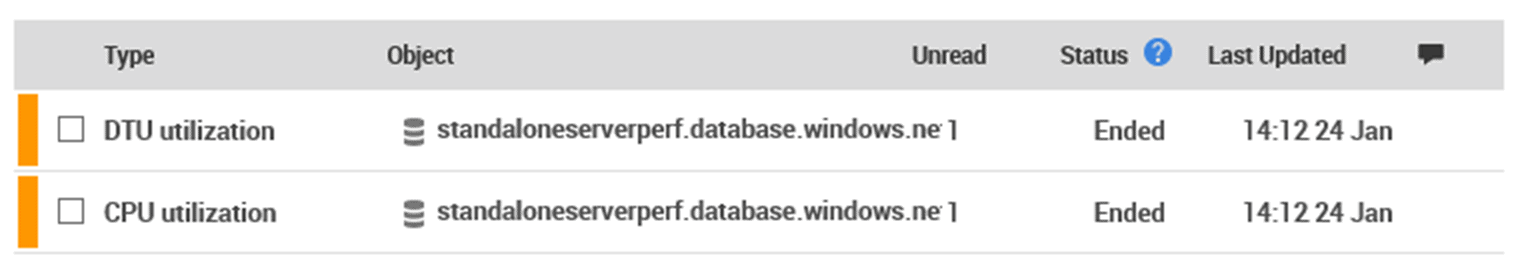
For example, earlier I noted that my CPU had been maxed for a period, and here are the alerts Redgate Monitor generated from this event:
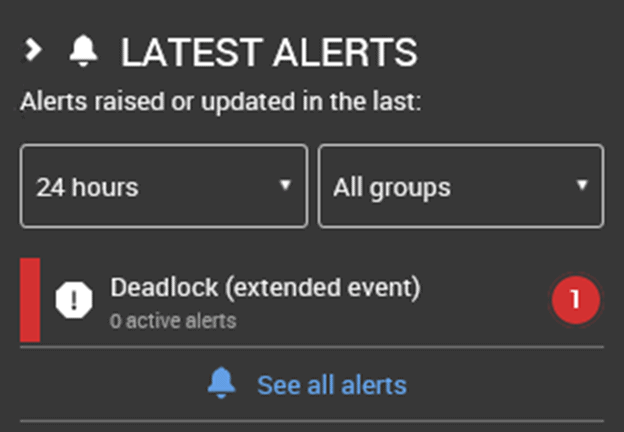
Finally, even standard errors and problems such as Deadlocks will be captured by Redgate Monitor:
Reports
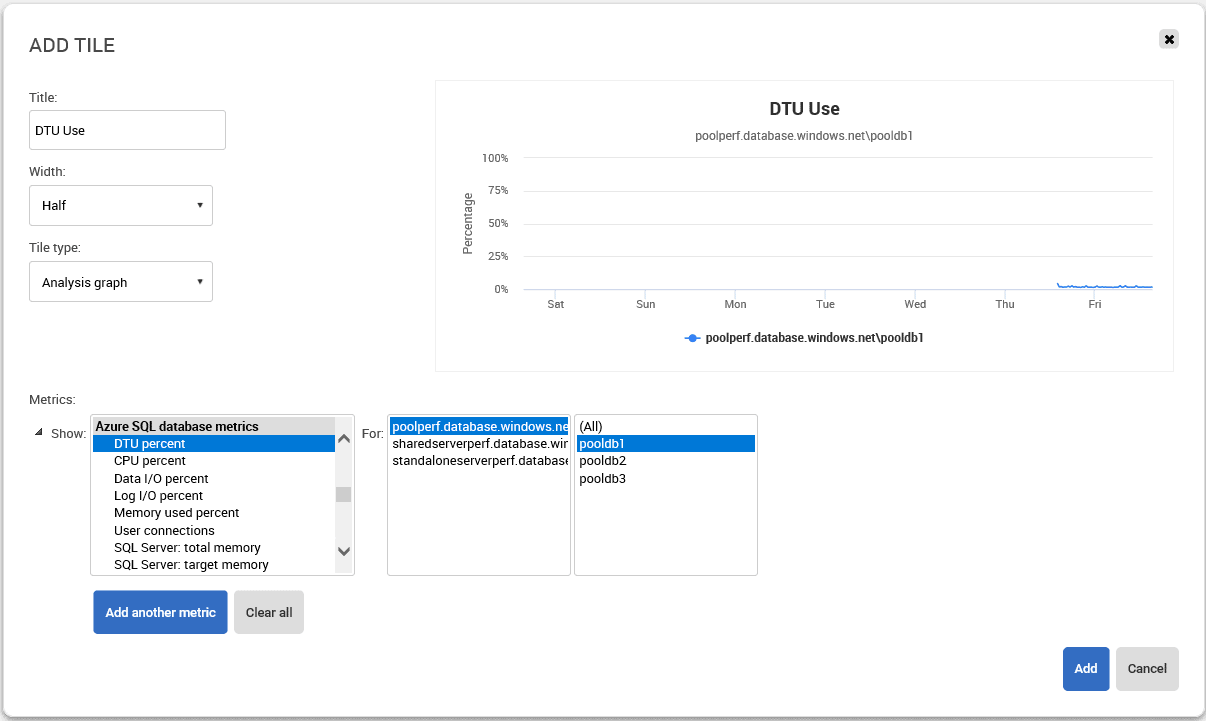
Redgate Monitor comes with a reporting tool that enables you to set up your own reports. This tool works from the data collected, so you can easily incorporate Azure SQL Databases into your reporting or set up special reports just for Azure SQL Database. I can take the standard tiles and the metrics we gather to create a report. For example, if I wanted a report with the DTU usage, I just add a tile, like this:
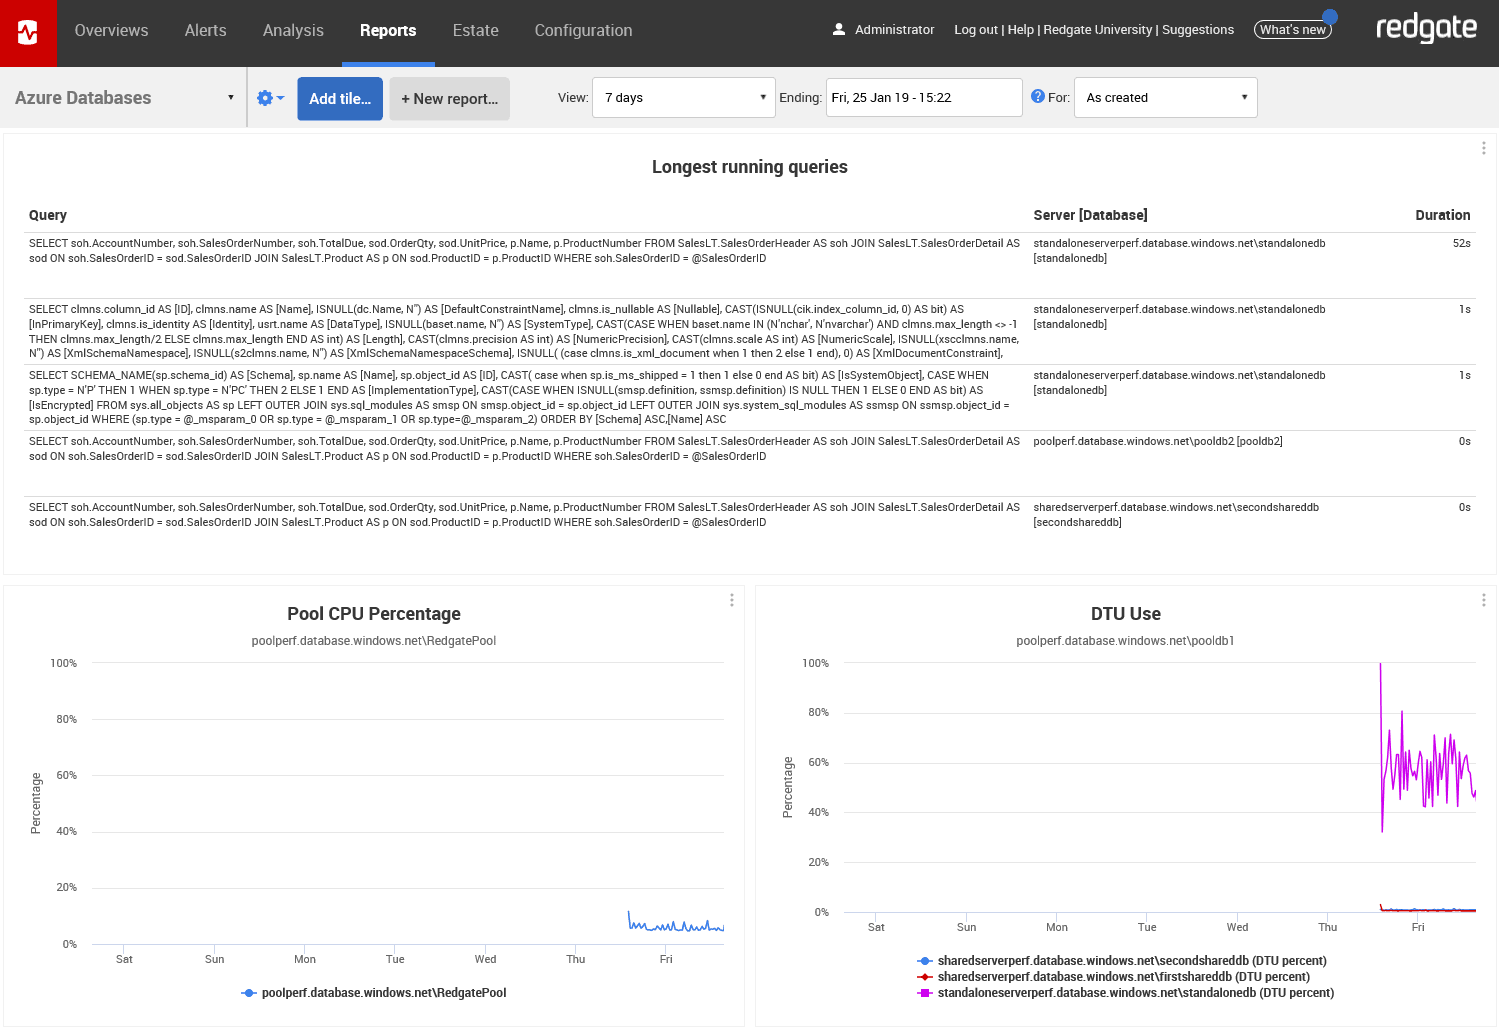
I can combine that with a tile for Elastic Pool usage, and others, to come up with a report that is unique for Azure SQL Databases. In the following example, I’ve built a report showing the slowest running queries across all my Azure databases, the CPU percentage from the pool databases, and the collected DTU use for each of the databases that is billing by DTU:
In short, this is the exact same behavior as all other reporting, just with metrics gathered from Azure SQL Database. You could easily customize this to do whatever you need.
Conclusion
It is becoming increasingly important to have a broad view of all your SQL Server databases with a consistent way of checking for problems and stresses. Redgate Monitor has a full suite of monitoring specific to Azure SQL Database and SQL Elastic Pools, so you can easily extend an existing SQL Server monitoring strategy to include Azure SQL Database.
Redgate Monitor allows you to bring your whole estate into a single monitoring landscape that has a consistent interface, whether you have an all-Azure environment, or, more likely, a mixed database environment of some servers and services in the cloud and some local.
To find out more about how Redgate Monitor can provide monitoring for your Azure Databases, click here.
Tools in this post
Redgate Monitor
Real-time multi-platform performance monitoring, with alerts and diagnostics
You may also like
-

Article
The Changing Role of SQL Server Monitoring
Grant Fritchey explains how a modern monitoring tool must adapt, as our SQL Server databases grow in number and size, and migrate onto new cloud-based, containerized or virtual machine-based SQL Servers.
-
Article
Scaling Redgate Monitor to Large SQL Server Estates
Tony Davis describes the features and capabilities of Redgate Monitor that allow it to scale smoothly to monitor a growing estate of servers and databases, while still providing a single, simple dashboard that gives the team all of the essential SQL Server metrics and alerts, establishes baselines, and detects trends in behavior.
-

Webinar
Monitoring PostgreSQL with Redgate Monitor
Join PostgreSQL advocate Ryan Booz and learn how to boost the performance of your PostgreSQL database estate with Redgate Monitor, including a sneak peak of what else is to come on the road map.
-

Webinar
SQL Monitor: Monitor your performance and availability
Managing your entire SQL Server estate, on premises, in the cloud or a hybrid, with instant problem diagnosis, intelligent and customizable alerting has never been more vital. Discover how Redgate’s SQL Monitor enables all this from a single pane of glass.
-
Article
Custom Metrics for Detecting Problems with Ad-hoc Queries
Overuse of ad-hoc queries by applications is a common source of SQL Server performance problems. The symptoms include high CPU and memory pressure. Phil Factor offers a simple custom metric to monitor the percentage of ad-hoc queries being executed on a database, and shows how Redgate Monitor can detect when the problem is happening, and show you the queries that are affecting the server.


