Azure SQL Elastic Pools and Redgate Monitor
This article explains the Azure-tailored metrics and alerts in Redgate Monitor that track use of the limited compute resources available to an Azure SQL Elastic Pool, and to each of the databases in it.
An Azure SQL Elastic Pool allows you to allocate a shared set of compute resources to a collection of Azure SQL databases, meaning that your databases are running in a shared resource pool, on a co-tenanted Azure server over which you have no direct control. If you hit a compute resource problem, Redgate Monitor provides a set of built-in Azure metrics that will help you determine very quickly which resource is the constraint, and which database is the primary consumer of that resource.
The specialized Azure metrics are in addition to the common set of database metrics and alerts that Redgate Monitor provides for any other SQL Server database. You can use the latter to investigate the underlying cause of poor performance in any Azure SQL Database. Using the history that Redgate Monitor stores for you, you’ll also be able to distinguish long-term trends from point-in-time issues, allowing you to make well-informed decisions on the need to ‘buy more resources’. The Azure service will happily provision more compute resources according to how much you pay, but this isn’t the right answer if it’s a problem that you can fix by tuning a query or adding an index.
Resource allocation for Azure SQL Elastic Pools
Grant Fritchey’s Monitoring Azure SQL Databases article discusses the basics of compute size and DTU allocation for Azure SQL databases, so I won’t repeat that here. Very similar rules apply for Azure SQL Elastic Pools; the DTU allocation per database is unaffected, but now we have an overall eDTU limit for the pool. A 200 eDTU elastic pool, for example, provides the same compute size as an S4 (200 DTU) Azure SQL Database. Of course, now those 200 DTUs are shared by however many databases you have in the pool.
There is some additional cost to pooling: eDTUs are 1.5x the price of DTUs. This is explained by pooled resources being more likely to be used, meaning that the Azure platform must dedicate more underlying hardware to them.
One of the main advantages of working with Azure SQL Databases is the ability to scale-up and scale-down the resources available to serve users of the database, either in response to chronic performance issues, or as activity grows or declines over time. If you need to allocate more resources, then in theory scaling up is simply a matter of dragging the DTU slider to the right to allocate more CPU and IO throughput, or dragging the disk space slider to the right . Likewise, you can scale-down, as activity levels drop over time.
In practice, you don’t want to spend your whole day doing this. It would be tricky to automate, there are limits governed by the database’s performance tier, and it’s not an immediate process. For larger databases, it can take a considerable amount of time to scale-up (the guideline is 1GB per minute), and during the allocation and deallocation periods the database is disabled for a short period of time.
Why use SQL Elastic Pools?
Let’s say you have two S4 Azure SQL Databases, meaning that each has access to a maximum of 200 DTUs. Would you want to put them together in a 200eDTU elastic pool, and would you want to allow either one of the databases to use all the pool’s DTUs at any time? It depends. In most organizations, database activity does not spread evenly across all databases. Some are much busier than others. Similarly, few databases show even levels of activity throughout the day; the workloads are often ‘spiky’, with periods of high user activity levels and resource use, interspersed with quieter periods.
Figure 1 shows the two S4 Azure SQL Databases, each with spiky workloads, as reflected in the DTU loads for different periods.
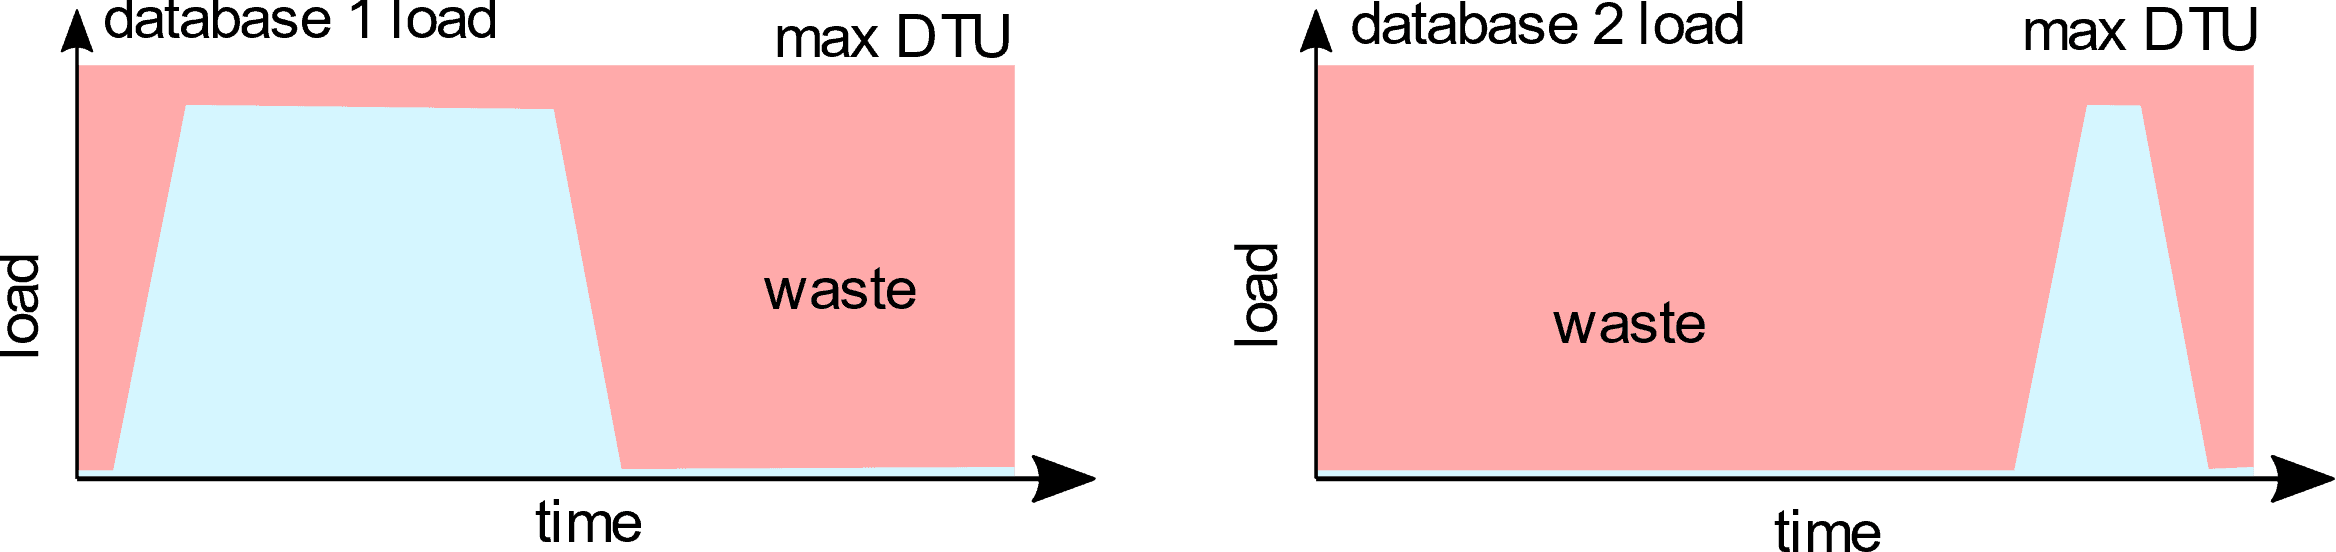
Figure 1: Running two Azure SQL databases separately
For both databases, there are significant periods where you’ll be paying for resources you’re not using, unless you spend a lot of time scaling up and down by the hour, as required.
Elastic pools are compelling in this case, because we have two databases that are loaded at different times and, together, the load spreads evenly across the day. For example, if you have two similarly-resourced databases, one of which is used primarily during business hours and the other is primarily used overnight, placing the two databases in an elastic pool allows you to run the overnight process using the resources you’re already paying for to serve the daytime database.
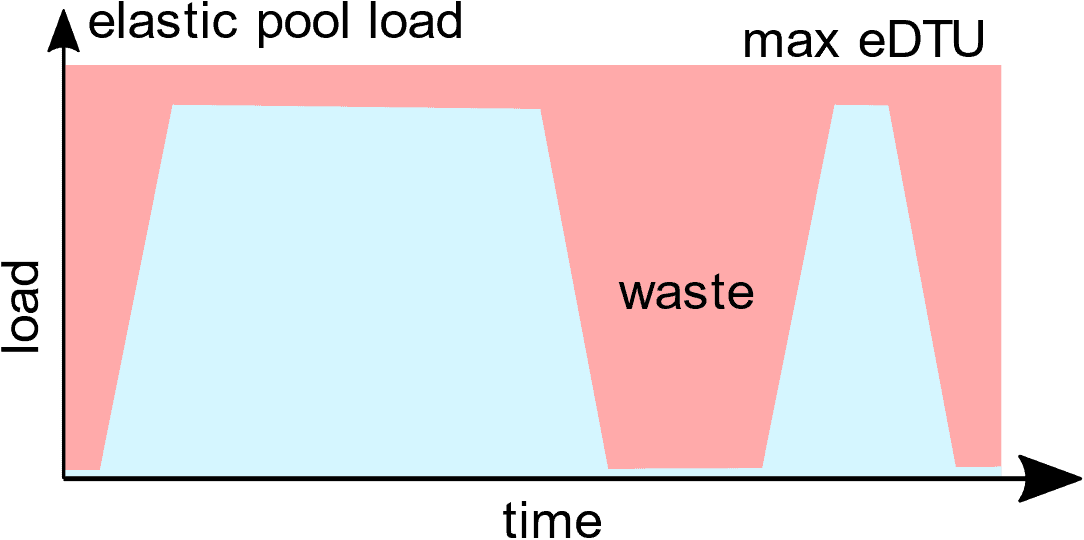
Figure 2: Running the two Azure SQL databases in a pool
Similarly, if you have several rarely-used databases, you might consider placing them in one elastic pool.
While Figure 2 looks great in theory, in practice there will inevitably be some overlap in the high-activity periods of the two databases. This means that the tricky thing about putting databases in elastic pools is being sure that competition for the pooled resources doesn’t affect either database’s performance. If you look at a pooled database in isolation, it may seem to be adequately-provisioned, running at say 50% CPU. However, this is 50% of the maximum possible CPU assuming no other load in the pool: activity on other databases in the pool might mean that there is no additional processing power available to that database. This is why it’s so important to monitor utilization both for the databases and the elastic pool.
Monitoring Elastic pools in Redgate Monitor
If an Azure SQL Database is experiencing performance issues, and it’s hosted in an elastic pool, then you need to be able to review the use of DTUs both at the pool level, aggregated for databases it hosts, and for the individual databases. You’ll want to be able to view individually each of the resources that comprise the DTU, which is CPU, data IO and log IO so that you can see which one, if any, is the bottleneck, and how use of that resource is distributed across the databases.
Redgate Monitor brings all this information together, recording and alerting on utilization of both the pool and the databases contained in it, in the same place as all the monitoring data for your on-premise servers and with the same richness of detail.
Overviews of Resource usage
Redgate Monitor automatically detects any elastic pool on any monitored Azure SQL Server, and on the Redgate Monitor dashboard it has a special icon on the top-left of its card to indicate that it’s a pool, as shown in Figure 3.
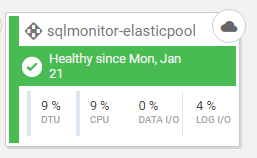
Figure 3: An elastic pool as it appears on the Redgate Monitor dashboard
Clicking on the card reveals the elastic pool overview, where you can see the pool’s important performance metrics: the percentage of DTU being used and then, contributing to that overarching metric, the aggregate CPU, data IO and log IO percentages for the pool.
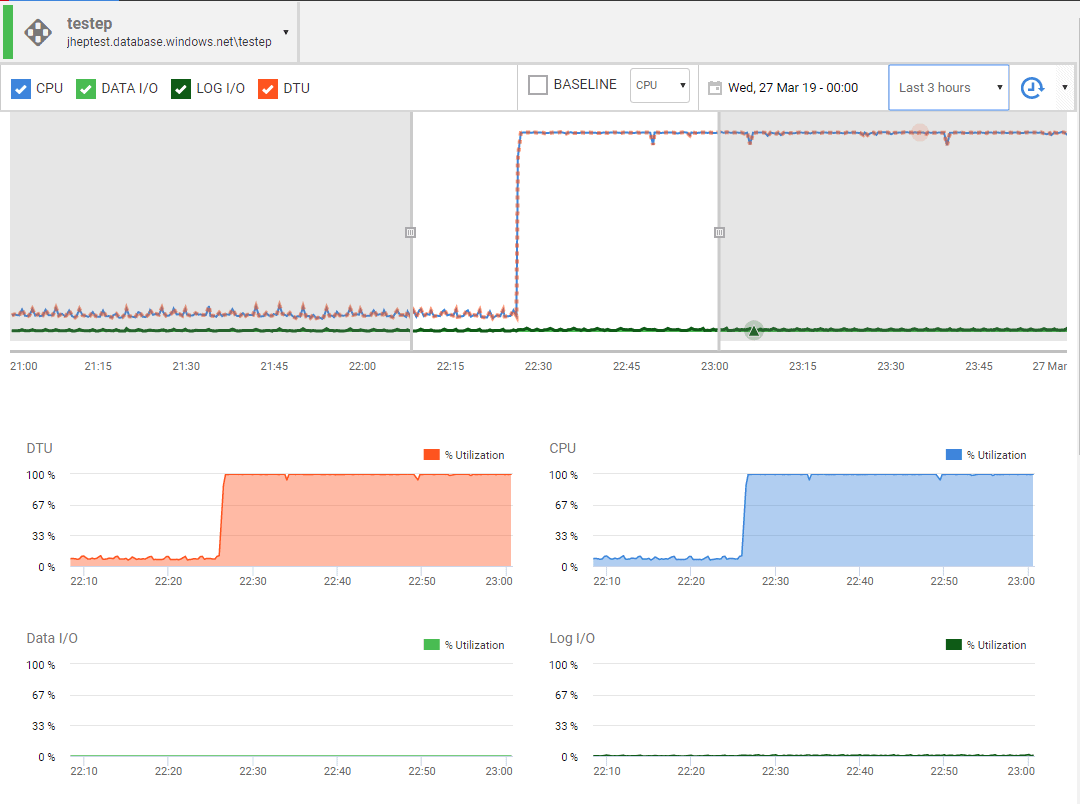
Figure 4: Elastic pool overview showing the DTU, CPU, Data IO and Log IO metrics
We can see that from 10:20PM onward the pool was running at maximum DTU capacity, caused entirely, in this simulated example, by the fact that the maximum CPU allocation is in use. A little later, I’ll describe in more detail how individual resource metrics contribute to the overall DTU measurement.
The pool will also have a limit on the number of concurrent worker thread requests it can support (for a 200 eDTU pool, it would be 400, which is also the individual limit for an S4 database). If you deplete the pool of available worker threads, all other sessions will be forced to wait until some become free, and performance will deteriorate badly.
There are also pool-wide limits on metrics that are related to availability rather then performance, such as space used and number of concurrent sessions. The number of concurrent sessions for a pool is currently set at 30,000 but if you’ve a lot of databases in a pool and you reach it, all further connection requests will be refused.
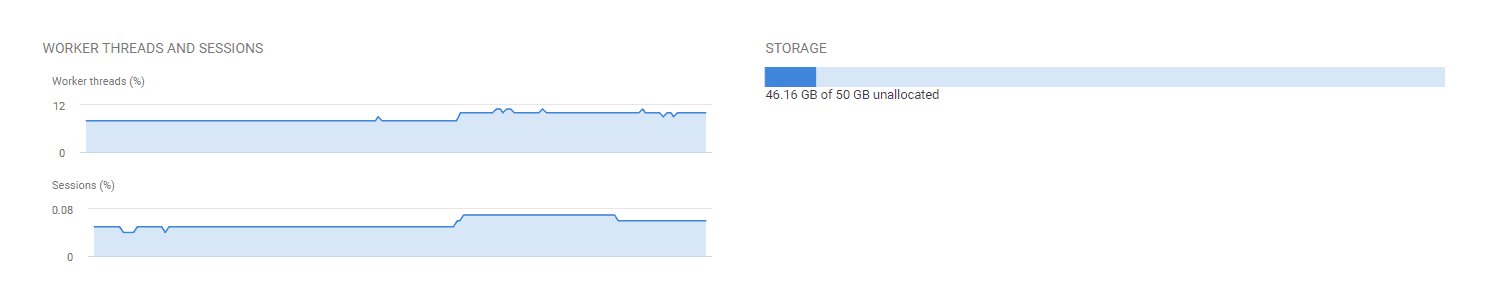
Figure 5: Elastic pool overview showing the worker threads and sessions, and storage metrics
Further down, you’ll see the list of databases in the pool (four in this case, called cpu, data, io and cpu2) and graphs showing their individual resource utilization.
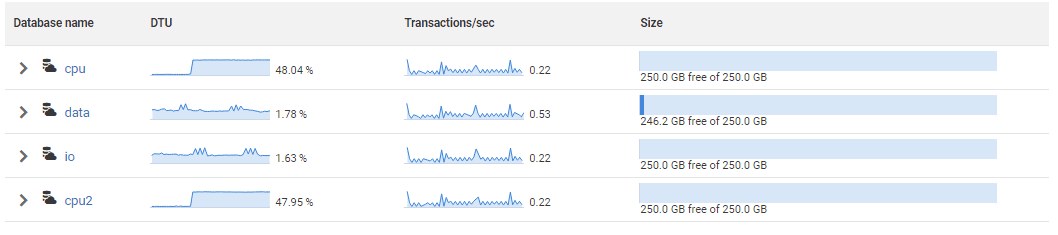
Figure 6: Overview of activity on each database in an elastic pool
In this case, the databases cpu and cpu2 and are each using about 50% CPU and the pool is at 100% CPU (and DTU) load for that period, as we saw in Figure 4. The percentages shown for each database are percentages of the maximum possible CPU, data IO and log IO utilization, assuming no other activity in the pool.
Clicking on any of one of the databases takes you to a more detailed summary of the database and a link to the familiar, more-detailed overview page, showing the top queries running on the database, and more.
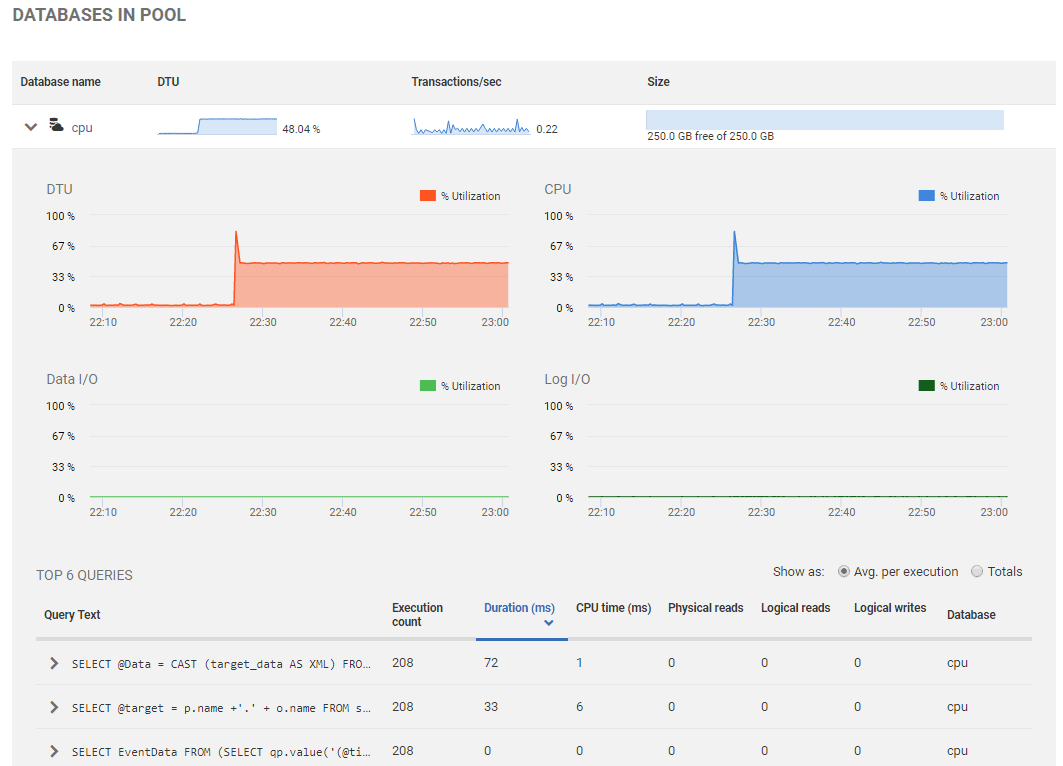
Figure 7: Resource use and activity of individual databases in the elastic pool
Metrics and alerts
All the elastic pool metrics are available in the Analysis tab of Redgate Monitor so you can plot them on a graph and compare them directly over different periods.
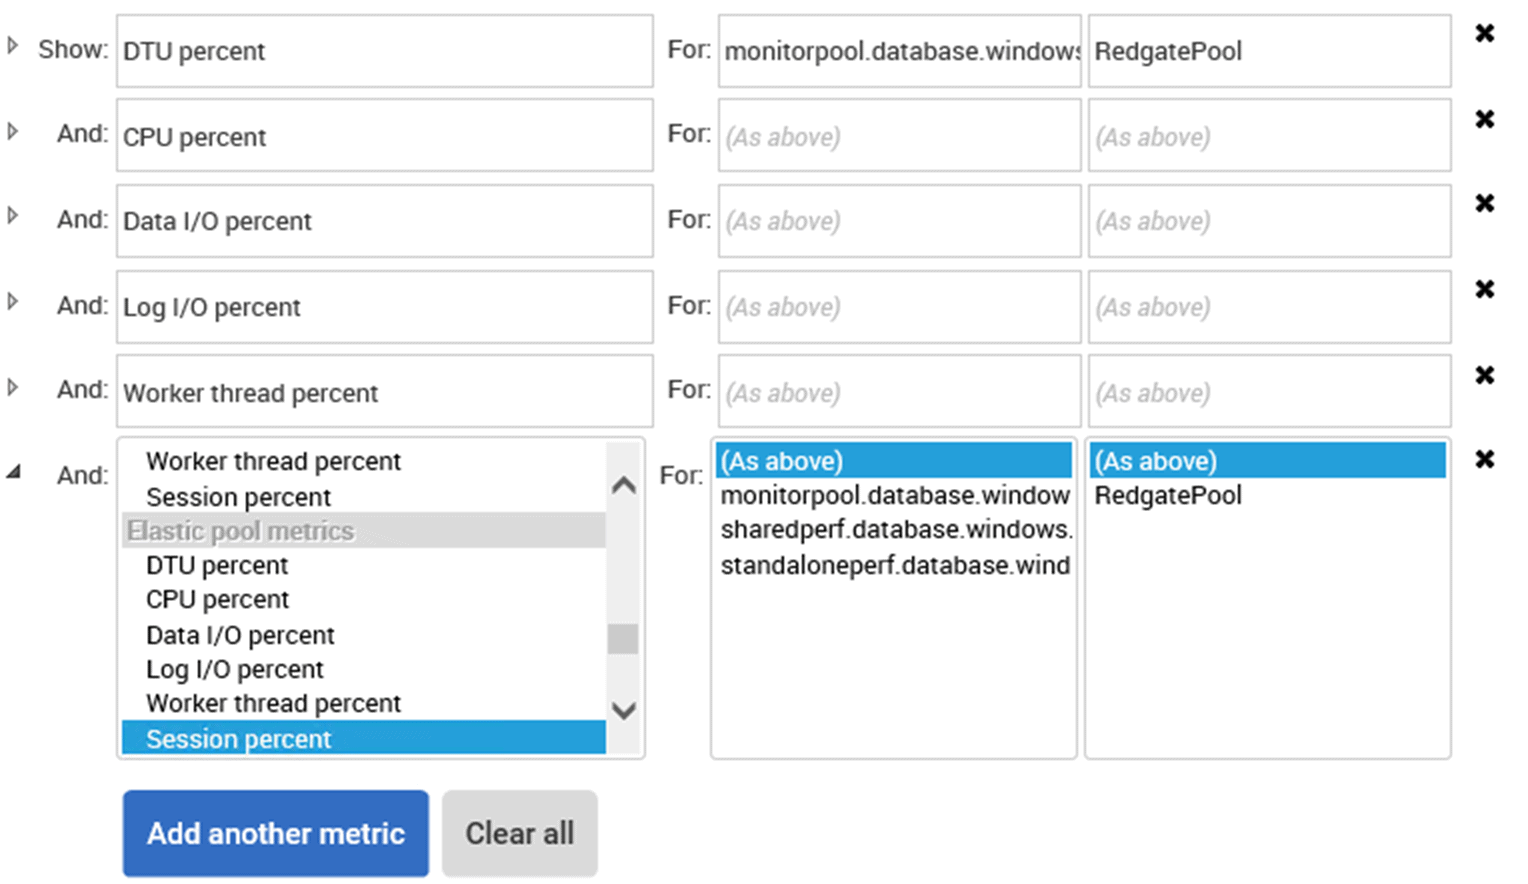
Figure 8: Redgate Monitor metrics for Azure SQL elastic pools
Additionally, there are all the alerts you’d expect to see for both elastic pools and individual Azure SQL Databases. These include DTU, CPU, data IO and log IO over-utilization, which can tell you that there is contention for these resources; that the space limit is being approached; and, finally, that the number of concurrent worker threads and sessions is approaching the limit.
This ensures that if you exceed any of the defined metrics that are unique to Azure SQL Database, you’ll be made aware. These are in addition to all the standard alerts, so no extra work is required to set them up. However, like the standard alerts, you may want to tune these to ensure maximum signal and minimal noise.
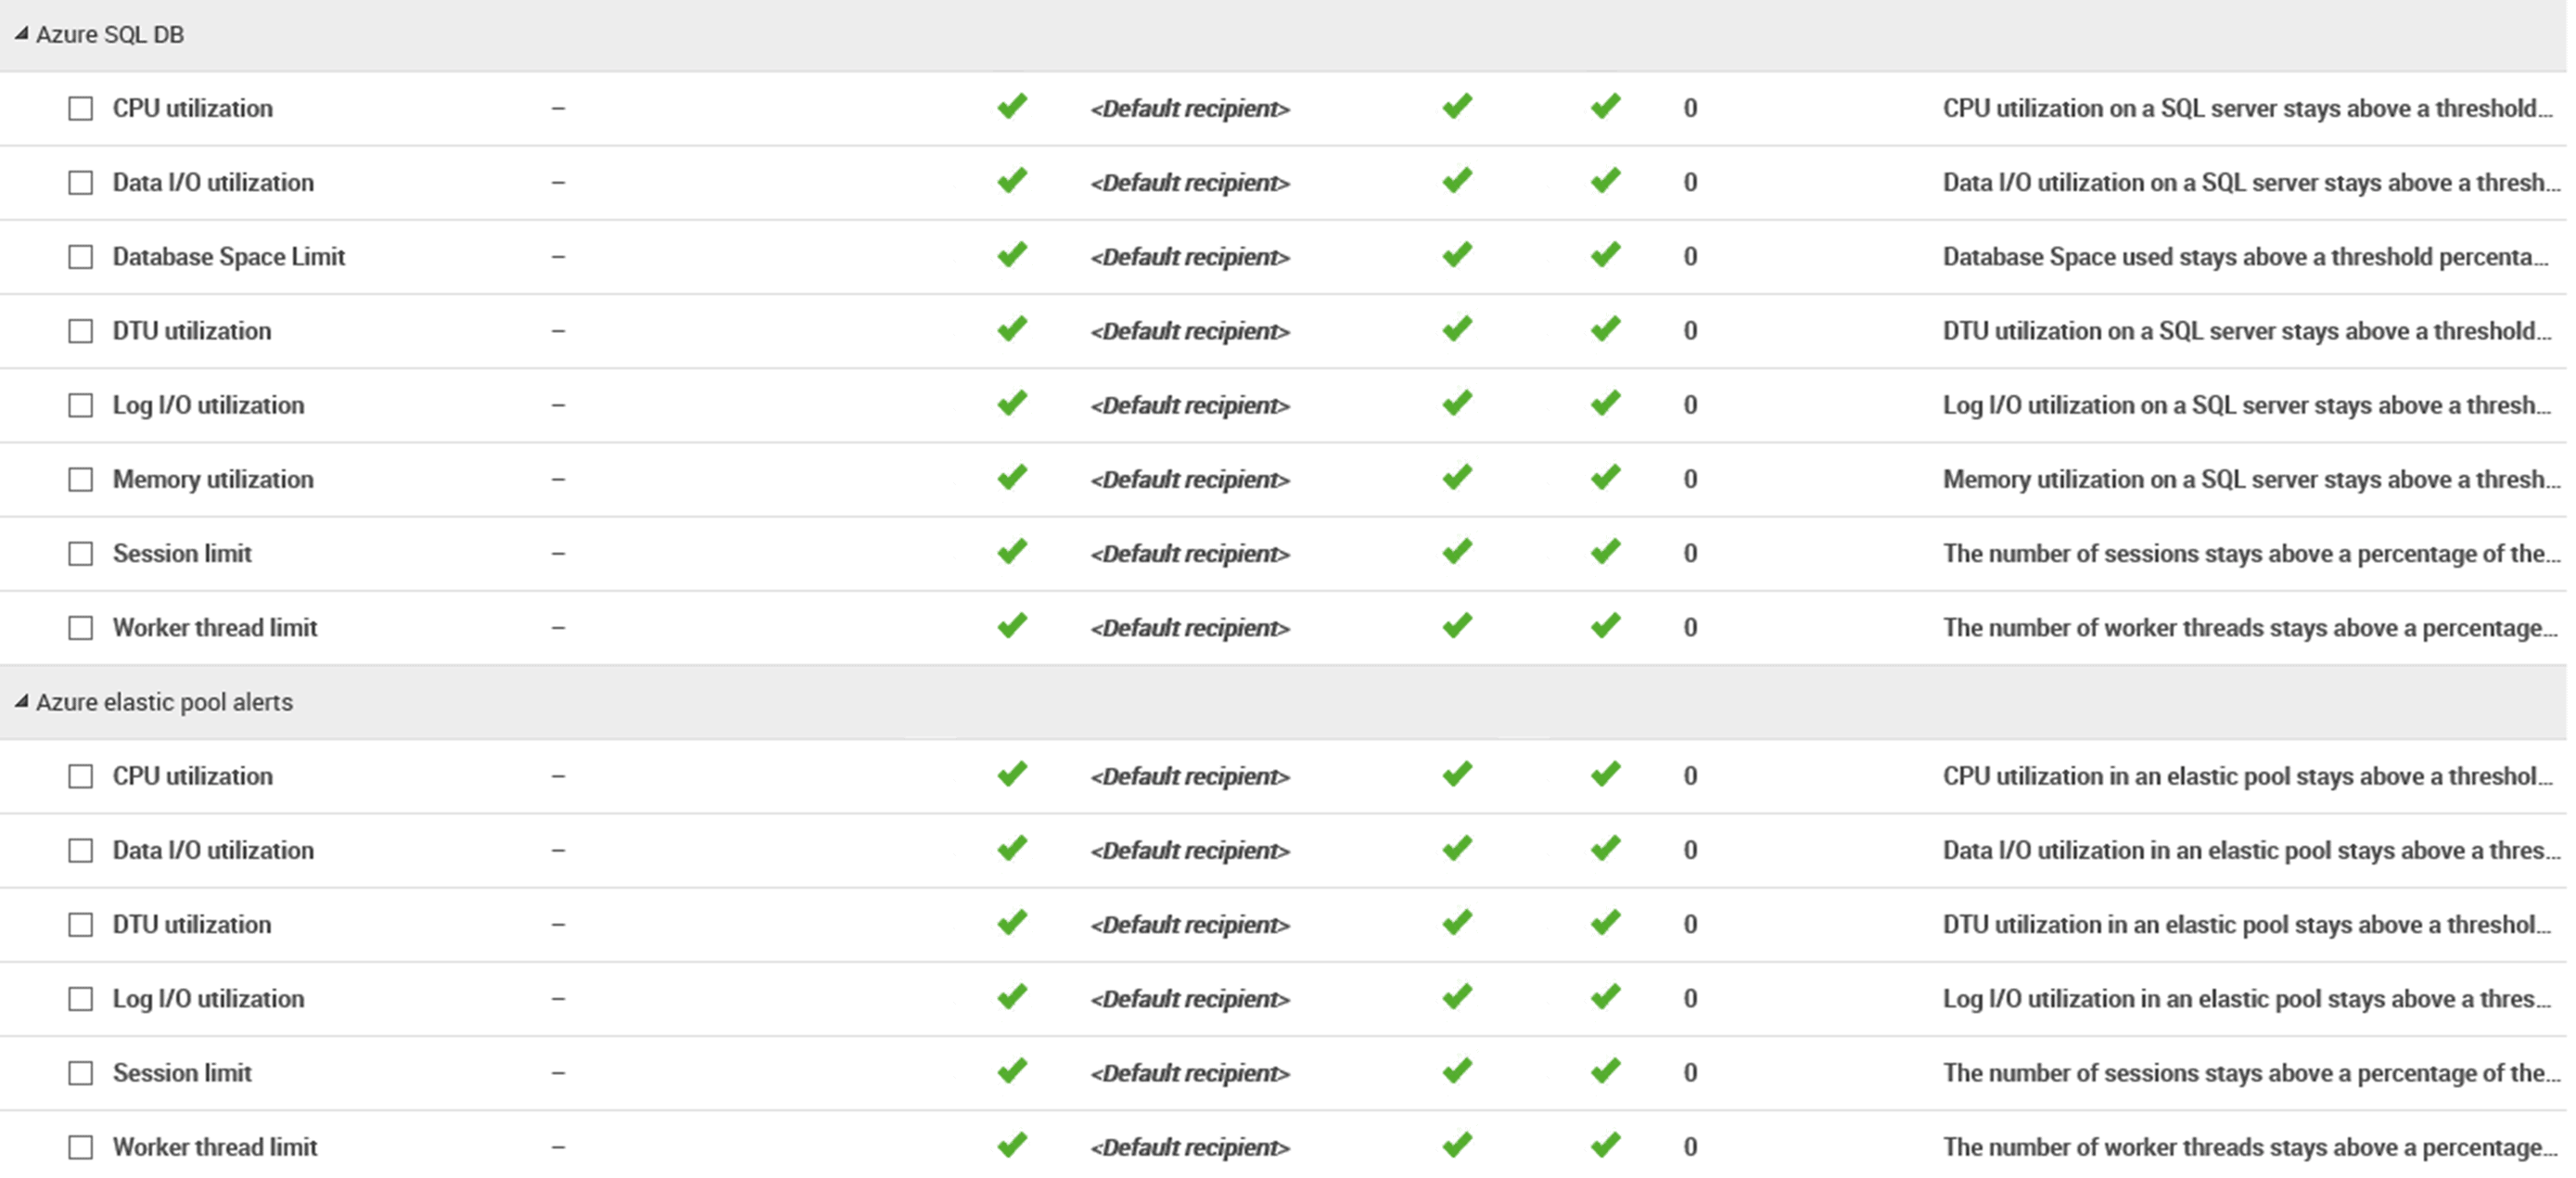
Figure 9: Redgate Monitor’s Azure SQL Database and Elastic Pool alerts
Using Redgate Monitor to diagnose resource contention
If you’re investigating a performance issue with a database in an elastic pool, perhaps due to an alert being raised, the starting point should be the overview page for the elastic pool.
If you see a pool running at 100% capacity (no more available DTUs), you can drill-down to look at each database to try to determine the root cause, whether it’s unexpected activity in a single database or that the pool is under-provisioned. In the previous example, we saw a case where two databases using 50% CPU load meant that the pool was at 100% CPU load. You would want to look in more detail at activity on each of these databases: Redgate Monitor’s database overview page is ideal for this. It will give you the information you need to know if this is a sudden change, or a chronic problem. If the former, you’ll be able to investigate any scheduled tasks that were running (in which case you’d want to reconsider what it was doing and when), which CPU-intensive queries were running, any associated high wait times for certain wait types, any execution plan regressions, and more. Conversely, if CPU usage has simply been growing slowly over time, then allocating more DTUs to the elastic pool might be appropriate.
Alternatively, if you have a performance issue and the resource graphs show that CPU, data IO and log IO for the pool are not high, then the pool should have enough capacity to serve the databases. You’ll still want to drill-down to look at the databases, though, to check if one of them is running at 100% DTU, which indicates that the database is using all its allocated DTUs from the pool. If this is the case, it might be worth investigating what proportion of the pool each database can use: this is in the “per database settings” section of the elastic pool “configure” panel in the Azure portal.
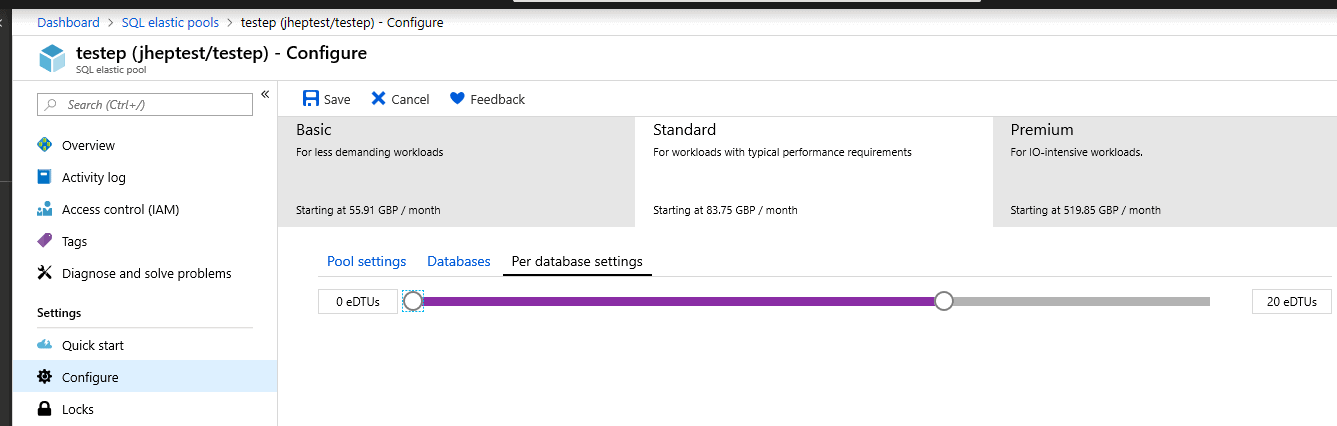
Figure 10: Setting the DTU allocation for each database in a pool
How does database DTU usage combine to form elastic pool eDTU usage?
Elastic pool eDTUs are, like DTUs, are referred to as a ‘blended’ measure of activity, combining CPU usage with log IO and data IO. In common with most of the documentation around elastic pools, in the discussion above we talk about database activity consuming the eDTUs available to an elastic pool. However, this isn’t strictly accurate: elastic pools (at least in their current implementation) combine the resources for CPU, data IO and log IO separately, just as a physical server does.
The formula for calculating eDTU usage in an elastic pool is the same as that for the calculating DTU usage in an individual database:
DTU_percent = Max(cpu_percent, data_io_percent, log_io_percent)
It means that for an individual database, the DTU percentage is the maximum of any CPU, Log IO and data IO percentages. So, if CPU=82%, Log I/O = 50% and Data IO = 53%, then DTU% = 82.
Consider the analysis graph in Figure 11. At just before 09:30 I started a high CPU workload on database cpu, and 20 minutes later started a simulated high log IO workload in database io. The blue line shows DTU Percent for the pool, the red line CPU Percent on database cpu, and the purple and green lines show Log I/O percent and CPU percent for database io.
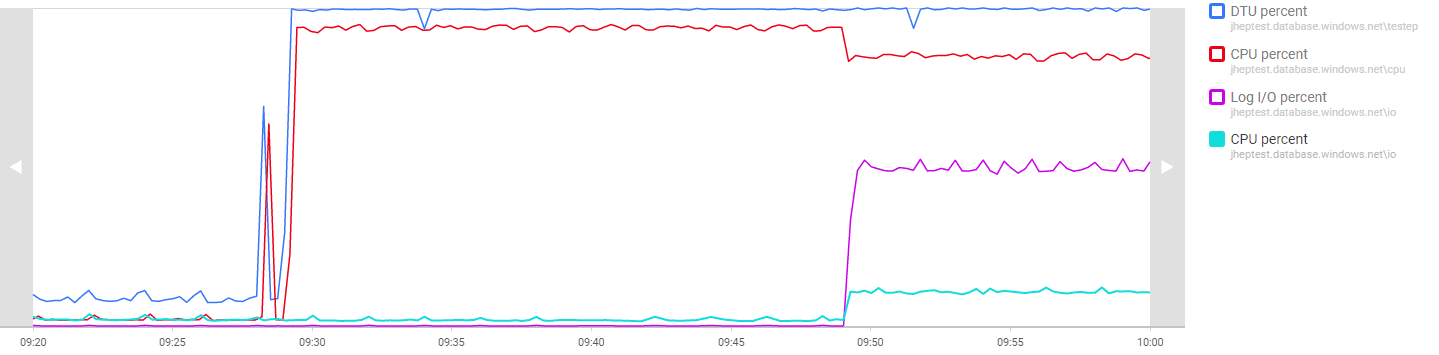
Figure 11: Running different types of workload on pooled databases
When we start the simulated log IO workload it also generates a relatively small amount of CPU activity, which reduces the CPU available to the cpu database; this is the only performance impact.
For elastic pools, we should combine all the CPU across the pool, all the log IO and all the data IO before taking the maximum to find the eDTU percentage. The way we combine the percentages, CPU for example, is to sum the CPU percentages for each database after scaling them according to any per-database DTU limit compared against the pool’s DTU limit.
The effect of this is that, if you want to squeeze every bit of performance from your elastic pool, you might also consider the distribution of the types of load across the pool: you can have high CPU activity on one database and high data IO activity on another, and these won’t affect each other.
What’s up next?
The most likely next development around support for Azure SQL Database and Elastic Pools will be to support vCore pricing. If there’s anything else you think we should look at, drop us an e-mail: we’re always happy to receive feedback on how we can improve Redgate Monitor.
Tools in this post
Redgate Monitor
Real-time multi-platform performance monitoring, with alerts and diagnostics
You may also like
-

Industry Event
Why Teams Are Rethinking Legacy Monitoring
Database estates have changed. Hybrid architectures, cloud platforms, and multi‑engine environments are now standard. Many monitoring tools were built for a different era, and teams are feeling the strain: slow alerting, limited cloud visibility, outdated dashboards, and tools that surface problems without helping you solve them. If this sounds familiar, SQLCon Atlanta is a great
-

Article
PostgreSQL Explain Plans in AWS Aurora
I recently wrote about a project I created on AWS Aurora PostgreSQL where I’m capturing APRS data from a radio. I focused on the ease of use, getting a database, some Lambda Functions, and a few schedulers working together with a web page. It was easy. However, I’d like to focus on a slightly different
-

Article
Database Delivery with Docker and SQL Change Automation
Phil Factor demonstrates how to integrate SQL Change Automation into containerized workflows, such as are typical of a microservices architecture. He shows how to automate database builds into a Linux SQL Server container running on Windows, and then backup the containerized database and restore it into dedicated containerized development copies for each developer and tester.
-

Live training session
Level up your database insights | Identify and diagnose the impact of your deployments with SQL Monitor
In this 30-minute training session, Redgate Solutions Engineer David Ong will show how you can build insights and understand your server performance in an instant with fast deep-dive analysis using SQL Monitor.
-

Webinar
Inside Azure SQL Managed Instance with Bob Ward
To celebrate SQL Monitor now supporting Azure SQL Managed Instance, join Microsoft Principal Architect Bob Ward live to learn all aspects of migrating, using, and managing Azure SQL Managed Instance from the perspective of SQL Server.


