Checking for Database Drift using Extended Events and Redgate Monitor
Phil Factor uses Extended Events and a Redgate Monitor custom metric to detect when the metadata of a database has 'drifted', meaning that a database object has been created, deleted or modified outside of the official change management process.
You need to make sure that nobody makes unauthorized changes to the metadata of your production databases.
Governance and testing processes during the deployment pipeline are there to ensure that any proposed database changes aren’t going to open any legal or security issues, and that they won’t introduce any bugs as a side effect. Once a database has been deployed, it shouldn’t suffer any changes, other than hotfixes that have gone through an auditable change-management process. Any drift in the state of the database, from the one that was deployed, is a security issue and must be investigated.
How do you make sure that the schema of the database, in the sense of the metadata, hasn’t been changed surreptitiously? Firstly, you want to be alerted when a change happens, and then to get a list of all the changes, who did them, what type of change, to which object, when they happened and from which client application it came. It sounds simple.
How to monitor for ‘uncontrolled’ database changes
The default trace records any DDL changes to the database. This is fine for one-off investigations, but it doesn’t give us quite enough information for our requirements. I’ll discuss how to use it for tracking changes in the access control of your databases in the next article. Fortunately, there are Extended Events that track every database object creation, deletion or update, for every database on the system. However, you will soon tire, for example, of the changes happening in the tempdb database. Your applications will be creating plenty of temporary objects such as temporary tables, prepared statements, table variables, and the like. You are also unlikely to be interested in certain types of objects, such as statistics.
You need a way to check the objects for one or more databases on the server, but not all. This filtering is best done by Extended Events, so that it collects and stores only the event data for the required databases. You also will need to filter out certain objects that change legitimately such as statistics objects, and therefore provide ‘noise’. This filtering of objects is likely to cause some head-scratching because the Extended Events definition of an object is different from the definition of an object within the system tables. A database, for example, is a type of object in Extended Events. You may need to filter out a range of Extended Events objects, depending on what is going on in background with the database you are monitoring. In my example, I’ve just filtered out the Statistics objects, but it is easy to change the code.
Another issue that you need to decide on is whether to store the events in a ring buffer or a file. I prefer a ring-buffer, but the problem with this is that it will eventually jettison old records to recycle the space. However, if you want to ensure the permanence of the event data, then it is easy to shred the XML document into a relational format and store the relevant rows in a table.
Why use Redgate Monitor?
First, we define and test an Extended Event session that will collect the events we need to detect any unauthorized object changes and provide the details of who made what changes to which objects.
With the event session running, the job of Redgate Monitor is then to query the collected event data, on a schedule, to see if any ‘object-change’ events have been raised within a specified period. We can set this up easily using a ‘Database Drift’ custom metric that will query the event data for the number of objects changed in, say, the past half hour.Redgate Monitor will record the metric value, and can alert the team when it detects any of these uncontrolled database changes.
This will also allow us to analyse the ‘Database Drift’ metric data in a timeline graph, and look for correlations with other metrics, such as the ‘Suspicious Errors’, ‘Permission Changes‘ or ‘Unauthorized Configuration Changes’ metrics.
One of the other advantages of Redgate Monitor is that it is an external system, outside the bounds of the database user. It is difficult to tamper with. While Extended Events are useful for detecting intrusion or unauthorized changes, it suffers the potential weakness that Extended Event sessions can be switched off by a hacker who gains sufficient privileges. A simple way to get around this is to use Redgate Monitor to track the number of active Extended Event sessions and fire an alert when the number drops.
How to be certain of ‘drift’
Once you are alerted to the fact that database drift has happened, you need to establish the difference between the database as it exists now, and the deployed version. I won’t show that here, but it’s easy to do using SQL Compare, or SQL Change Automation. I’ve also shown how to do this with the DacPac and a DacPac-registered database.
The problem with tracking the schema changes, without comparing the database with the deployed version, is twofold. Firstly, it is not always possible to tell easily what has changed when an object is altered, though you can see the batch that did it. Secondly, you might have missed some changes, and an alteration to an object doesn’t always mean a change away from what it should be. Permanent database objects are often altered by disabling constraints before a BCP operation, for example. There will therefore be two alterations of the table, one before and one afterwards, but the database ends up being in the state it should be.
Developing and testing the Extended Events session
The first task is to create an event session that will capture the events data we need to detect draft and tell us who changed what. This is, I believe, best done with a test harness.
It starts with a test harness that creates, alters and deletes a variety of database objects, and you then just work on the event session until it detects everything you want it to do and nothing that you don’t want. For every test run, you start the event session, run the test harness, display the result and stop the session. By doing this, you can restrict the number of recorded events by refining the filters until you get all the information you want but no irrelevant information. If, for example, you were designing an Extended Event session to look for, say, failed login attempts, you would be unwise to choose to record all errors, including informational messages and warning because you can easily get overwhelmed by what is returned by the session.
A simple test harness for database drift detection
To get started, I used a rather trivial test harness that creates, alters or deletes several different database objects.
|
1 2 3 4 5 6 7 8 9 10 11 12 13 14 15 16 17 18 19 20 21 22 23 24 25 26 27 28 29 30 31 32 33 34 35 36 37 38 39 40 41 42 43 44 45 46 47 48 49 50 51 52 53 54 55 56 57 58 59 60 61 62 63 64 65 66 67 68 69 70 71 72 73 |
USE PhilFactor; DECLARE @myTableVariable TABLE (ID INT IDENTITY PRIMARY KEY, MyString NVARCHAR(200) NOT NULL); INSERT INTO @myTableVariable (MyString) SELECT objects.name FROM sys.objects; CREATE TABLE dbo.MyPermanentTable (ID INT IDENTITY, MyString NVARCHAR(200) NOT NULL); ALTER TABLE dbo.MyPermanentTable NOCHECK CONSTRAINT ALL INSERT INTO dbo.MyPermanentTable (MyString) SELECT objects.name FROM sys.objects; ALTER TABLE dbo.MyPermanentTable CHECK CONSTRAINT ALL INSERT INTO dbo.MyPermanentTable (MyString) SELECT objects.name FROM sys.objects; ALTER TABLE dbo.MyPermanentTable ADD CONSTRAINT MyPKForPermanentTable PRIMARY KEY CLUSTERED (ID); CREATE TABLE #MyTemporaryTable (ID INT NOT null, MyString NVARCHAR(200) NOT NULL); INSERT INTO #MyTemporaryTable (id, MyString) SELECT id, MyString FROM dbo.mypermanentTable ALTER TABLE #MyTemporaryTable ADD CONSTRAINT MyPKForPermanentTable PRIMARY KEY CLUSTERED (ID); GO CREATE VIEW MyView AS SELECT MyPermanentTable.ID, MyPermanentTable.MyString FROM dbo.MyPermanentTable UNION ALL SELECT vals.id, vals.TheName FROM (VALUES (-1, 'First'), (-2, 'Second'), (-3, 'Third')) AS vals (id, TheName ); GO alter VIEW MyView AS --I forgot the documentation. SELECT MyPermanentTable.ID, MyPermanentTable.MyString FROM dbo.MyPermanentTable UNION ALL SELECT vals.id, vals.TheName FROM (VALUES (-1, 'First'), (-2, 'Second'), (-3, 'Third')) AS vals (id, TheName ); GO Declare @P1 int; Exec sp_prepare @P1 output, N'@P1 nvarchar(128), @P2 nvarchar(100)', N'SELECT database_id, name FROM sys.databases WHERE name=@P1 AND state_desc = @P2'; Exec sp_execute @P1, N'tempdb', N'ONLINE'; EXEC sp_unprepare @P1; go CREATE FUNCTION dbo.MyTableFunction (@which INT) RETURNS TABLE AS RETURN (SELECT MyView.MyString FROM MyView WHERE MyView.ID = @which); GO CREATE FUNCTION dbo.MyScalarFunction (@param1 INT, @param2 INT) RETURNS INT AS BEGIN RETURN @param1 + @param2; END; GO CREATE PROCEDURE dbo.MyProcedure @param1 INT = 0, @param2 INT AS SELECT @param1, @param2; RETURN 0; GO CREATE SYNONYM dbo.MySynonym FOR dbo.MyProcedure DROP SYNONYM dbo.MySynonym DROP procedure Myprocedure; DROP FUNCTION MyTableFunction; DROP FUNCTION MyScalarFunction; DROP VIEW MyView; DROP TABLE MyPermanentTable; DROP TABLE #MyTemporaryTable USE master; GO CREATE DATABASE DeleteMePlease go DROP DATABASE DeleteMePlease go |
Listing 1
I hope I’ve included enough to make the point. You can also test for changed to logins and users, but I want to deal with that in a separate metric, in a separate article.
Creating the event session
Listing 2 shows how to create and start the WhoChangedWhat event session that will capture each of the three “object changed” events, in the Objects Event Category, namely object_altered, object_created, and object_deleted.
In addition to the default ‘payload’ of event columns for each of these events, we also capture the optional database_name event column, so that we see the name of the database on which the event occurred. We add actions to capture the name of the client application, and associated database principal, that made the change, and the text of the DDL that was executed. We record the event data for all databases, except master or tempdb, and we also exclude changes to statistics objects.
With any monitoring that uses a combination of Extended Events and Redgate Monitor, we must create and start the session before we can use the results. When a session is stopped, you lose the results.
|
1 2 3 4 5 6 7 8 9 10 11 12 13 14 15 16 17 18 19 20 21 22 23 24 25 26 27 28 29 30 31 32 33 34 35 36 37 38 39 40 41 42 43 44 |
IF EXISTS --if the session already exists, then delete it. We are assuming you've changed something ( SELECT * FROM sys.server_event_sessions WHERE server_event_sessions.name = 'WhoChangedWhat' ) DROP EVENT SESSION WhoChangedWhat ON SERVER; GO --create a new session. you can change a session with the ALTER syntax. This -- preserves the data already collected. In this case we don't need the old data -- All these EVENT classes we've chosen occur as two events. The first event -- indicates the Begin phase. The second event indicates the Rollback or Commit phase. -- we just want the commit phase. CREATE EVENT SESSION [WhoChangedWhat] ON SERVER -- Object Altered. The Object:Altered event class indicates that an object has been -- altered; for example, by an ALTER INDEX, ALTER TABLE, or ALTER DATABASE statement. ADD EVENT sqlserver.object_altered(SET collect_database_name=(1)--we need this name ACTION(sqlserver.client_app_name,sqlserver.server_principal_name, sqlserver.session_id,sqlserver.sql_text)--we definitely want this data WHERE ([package0].[equal_uint64]([ddl_phase],(1)) AND [database_name]<>N'tempdb' AND [database_name]<>N'master' AND ([package0].[not_equal_uint64]([object_type],(21587))))),--no STATISTICS --The Object:Created event class indicates that an object has been created, for --example, by the CREATE INDEX, CREATE TABLE, or CREATE DATABASE statements. ADD EVENT sqlserver.object_created(SET collect_database_name=(1) ACTION(sqlserver.client_app_name,sqlserver.server_principal_name, sqlserver.session_id,sqlserver.sql_text) WHERE ([package0].[equal_uint64]([ddl_phase],(1)) AND [database_name]<>N'tempdb' AND [database_name]<>N'master' AND ([package0].[not_equal_uint64]([object_type],(21587))))),--no STATISTICS --The Object:Deleted event class indicates that an object has been deleted ADD EVENT sqlserver.object_deleted(SET collect_database_name=(1) ACTION(sqlserver.client_app_name,sqlserver.server_principal_name, sqlserver.session_id,sqlserver.sql_text) WHERE ([package0].[equal_uint64]([ddl_phase],(1)) AND [database_name]<>N'tempdb' AND [database_name]<>N'master' AND ([package0].[not_equal_uint64]([object_type],(21587)))))--no STATISTICS --we specify a ring-buffer target ADD TARGET package0.ring_buffer WITH (MAX_MEMORY=4096 KB,EVENT_RETENTION_MODE=ALLOW_SINGLE_EVENT_LOSS, MAX_DISPATCH_LATENCY=30 SECONDS,MAX_EVENT_SIZE=0 KB, MEMORY_PARTITION_MODE=NONE,TRACK_CAUSALITY=OFF,STARTUP_STATE=ON) GO --and now we start the session ALTER EVENT SESSION WhoChangedWhat ON SERVER STATE = START; |
Listing 2
If you have a single production database, then you’ll probably want to set up the event session to monitor just that database, rather than all databases minus master and tempdb. If so, simply swap the existing:
AND [database_name]<>N'tempdb' AND [database_name]<>N'master'
For:
AND [database_name]=N'MyDatabase'
This is the joy of Extended Events sessions: it’s very easy to alter them to suit your task.
Checking the results: who changed what?
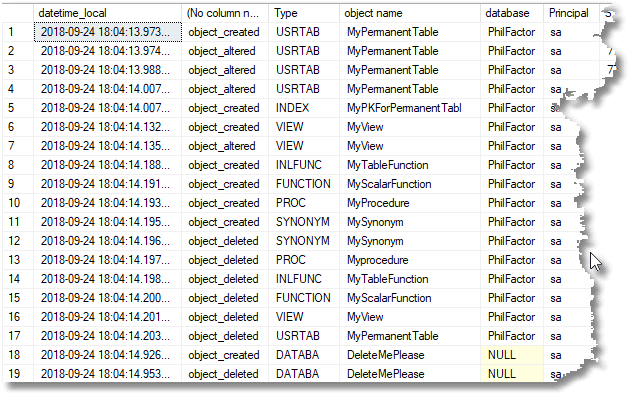
Having created and started the event session, we can run our test harness code (Listing 1) and then check the event data that’s collected. We can view the data directly, by using the ‘Watch Live data’ in SSMS, but I much prefer to extract the data using SQL, so I see a nice simple report of who change what objects and how.
|
1 2 3 4 5 6 7 8 9 10 11 12 13 14 15 16 17 18 19 20 21 22 23 |
DECLARE @Target_Data XML = ( SELECT TOP 1 Cast(xet.target_data AS XML) AS targetdata FROM sys.dm_xe_session_targets AS xet INNER JOIN sys.dm_xe_sessions AS xes ON xes.address = xet.event_session_address WHERE xes.name = 'WhoChangedWhat' AND xet.target_name = 'ring_buffer' ); SELECT @Target_Data SELECT CONVERT(datetime2, SwitchOffset(CONVERT(datetimeoffset,the.event_data.value('(@timestamp)[1]', 'datetime2')), DateName(TzOffset, SYSDATETIMEOFFSET()))) AS datetime_local, the.event_data.value('(@name)[1]', 'sysname'), the.event_data.value('(data[@name="object_type"]/text)[1]', 'varchar(20)') AS [Type], the.event_data.value('(data[@name="object_name"]/value)[1]', 'varchar(20)') AS [object name], Db_Name(the.event_data.value('(data[@name="database_id"]/value)[1]', 'int')) AS [database], the.event_data.value('(action[@name="server_principal_name"]/value)[1]', 'sysname') AS [Principal], the.event_data.value('(action[@name="session_id"]/value)[1]', 'sysname') AS [Session ID], the.event_data.value('(action[@name="client_app_name"]/value)[1]', 'sysname') AS [Client], the.event_data.value('(action[@name="sql_text"]/value)[1]', 'sysname') AS [SQL] FROM @Target_Data.nodes('//RingBufferTarget/event') AS the (event_data) |
Listing 3
As you can see, it shows us when the change happened, what sort of change, the type and name of the object changed, the affected database, and the SQL Server principal that made the change.
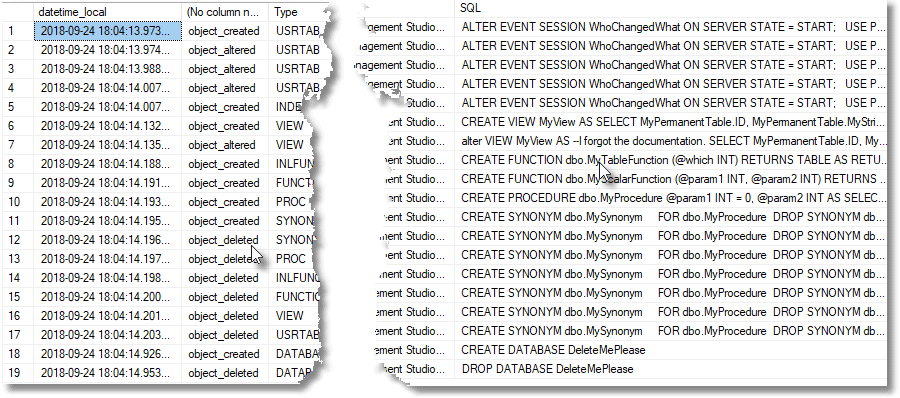
Scrolling right, there is also the text of the batch that did the alteration to the object, which is essential to try to work out what changed, because it isn’t always obvious how an object was altered.
Of course, this sort of detailed investigation isn’t, and shouldn’t be, part of Redgate Monitor. Once we’re sure that the event session is reporting all the details we need, Redgate Monitor’s job is simply to run the SQL that gathers the “number of object changes in last x minutes” metric, then displays the metric values, and alerts you if or when you need to investigate the details, which you can then do using Listing 3.
Adding Redgate Monitor into the mix
Listing 4 shows the code that we can then install into Redgate Monitor as a custom metric. ‘It will capture and display the number of object changes in the past half hour, to get a chunky blip on the graph.
|
1 2 3 4 5 6 7 8 9 10 11 12 13 14 15 16 17 |
SELECT Count(*) AS ObjectChanges FROM sys.dm_xe_session_targets AS xet INNER JOIN sys.dm_xe_sessions AS xes ON xes.address = xet.event_session_address CROSS APPLY (SELECT Cast(xet.target_data AS XML)) AS target_data_xml(xml) CROSS APPLY target_data_xml.xml.nodes('//RingBufferTarget/event') AS xed(event_data) WHERE xes.name = 'WhoChangedWhat' AND xet.target_name = 'ring_buffer' AND DateDiff (MINUTE, Convert(DATETIME2, SwitchOffset( Convert(DATETIMEOFFSET,xed.event_data.value('(@timestamp)[1]', 'datetime2')), DateName(TzOffset,SysDateTimeOffset())) ), GetDate()) < 30; --metadata changes within the last thirty minutes |
Listing 4
When we create the metric, we specify that it runs only on the master database, which is ironic when we consider that we are specifically excluding metadata events in master. If you were to run it on every database, you’d get the same result for each, because events in Extended Events are server-wide, like errors.
In the next screenshot, we are creating custom metric in Redgate Monitor, pasting in the code from Listing 4.
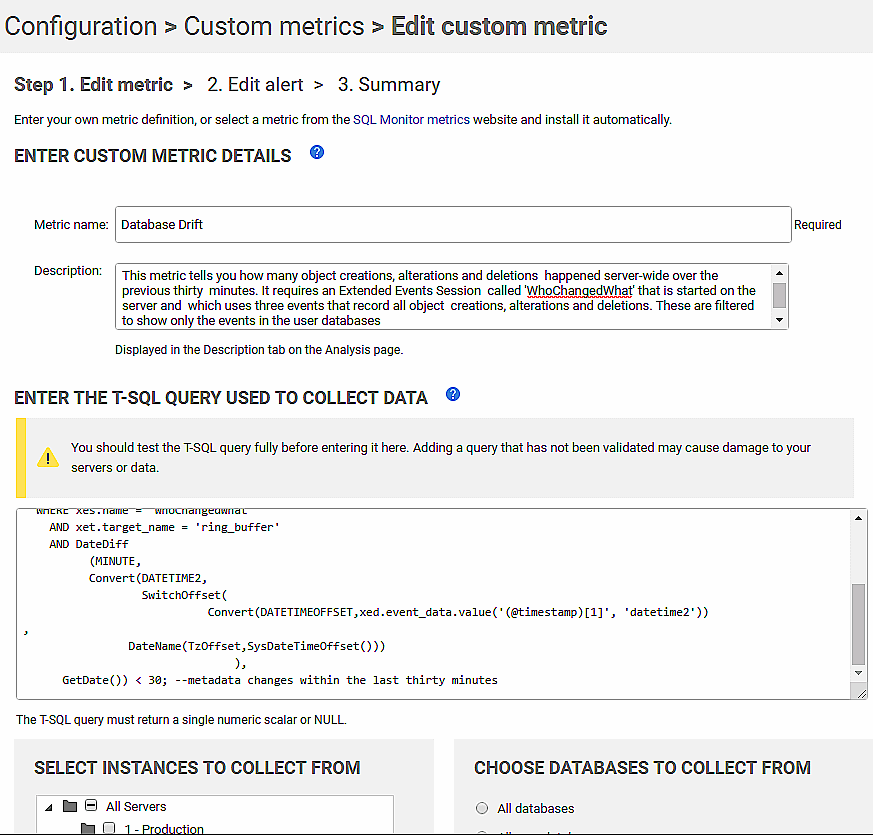
We are going to run this on master database of a staging ”server. I’ve not shown it here, but you’ll also need to set the frequency at which the metric data is collected. Of course, this will need to be less than the period over which you’re collecting the metadata changes, in Listing 4, to ensure that nothing gets missed. On a second screen, we configure the associated alert. If Redgate Monitor is set to alert if this metric value is greater than zero, then you will know about every change.
To simulate a suspicious attack, where someone is attempting to modify database objects, we run our test harness (Listing 1) with a random delay between test items:
|
1 |
Declare @delay varchar(8)= '00:00:'+Right('0'+Convert(varchar(2),convert(int,Rand()*60)),2);WAITFOR DELAY @delay; |
Use a SELECT within a batch instead of the DECLARE after the initial declaration in the batch. You can only have one delay in a batch that used the DECLARE, and it must be the first, so the test code will look like this:
|
1 2 3 4 5 6 7 8 9 10 11 12 13 |
-- add first random delay in batch DECLARE @delay varchar(8)=(select '00:00:'+ Right('0' + Convert(VARCHAR(2), Convert(INT, Rand() * 60)), 2)); WAITFOR DELAY @delay; -- end of random delay /* do something here */ --second or subsequent random delay in same batch SELECT @delay ='00:00:'+ Right('0' + Convert(VARCHAR(2), Convert(INT, Rand() * 60)), 2); WAITFOR DELAY @delay; -- end of second random delay in same batch /* do something else here */ GO -- add first random delay in next batch DECLARE @delay varchar(8)=(select '00:00:'+ Right('0' + Convert(VARCHAR(2), Convert(INT, Rand() * 60)), 2)); WAITFOR DELAY @delay; -- end of random delay /* and so on */ |
The next screenshot shows the resulting analysis graph in Redgate Monitor, displaying the ‘Database Drift’ metric (in red) alongside ‘the ‘suspicious errors’ metric (in blue), which I’ve already written about (I was simultaneously running Listing 3 from that article in a separate window).
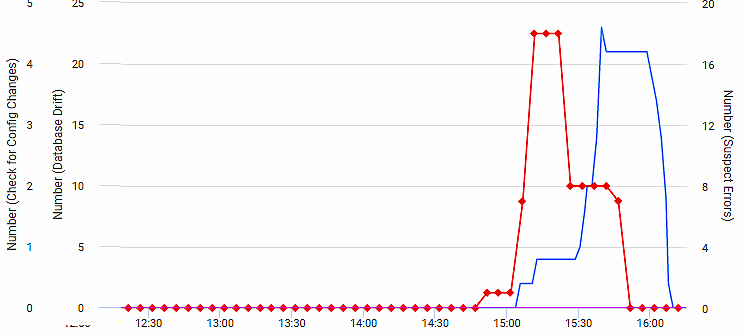
If you see that, you can be sure that there is an alert:
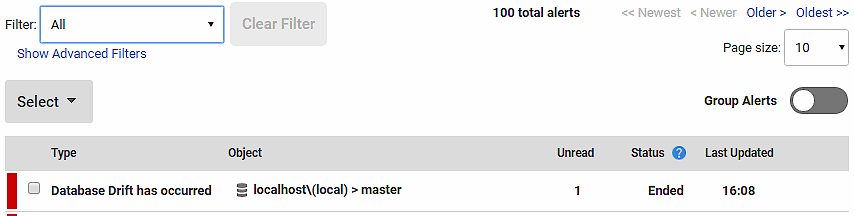
And you can drill into the detail up to a point, using Listing 3 to investigate exactly what has been collected by the event session.
Conclusions
We’ve now got a way of detecting the ‘smell’ of database drift. We can see where the metadata of a database has been changed. We can also see the SQL in the batch that made the changes. However, the only certain way to tell that the database has drifted is to compare it with what is in source control for that version of the database, and the settings in the configuration management system.
We are, at this point, getting close to detecting the signs of a database being tampered with. To complete the picture, we need two more nuggets of information, we need to know what changes there are to the users, logins, passwords and principals in the security part of SQL Server, and we need to see if anyone has tampered with SQL Agent. We’ll tackle the security and access control events in the next article.
Tools in this post
Redgate Monitor
Real-time multi-platform performance monitoring, with alerts and diagnostics
You may also like
-

Article
Using the Redgate Monitor Estate Pages
Kathi Kellenberger introduces the new Estate monitoring pages in Redgate Monitor 9, and explains how they will help DBAs monitor and safeguard the security, stability and availability of all servers in their care.
-

Webinar
Monitoring Amazon RDS with Redgate SQL Monitor
With the upcoming launch of SQL Monitor 11, you will be able to monitor your SQL Servers hosted on Amazon RDS alongside your on-premises and other cloud-based servers, instances, and databases. Discover the benefits of monitoring your entire estate, including on-premises and cloud-hosted databases, from a single pane of glass.
-
Article
Six Things to Monitor with PostgreSQL
This article describes six performance metrics that ought to be central to your PostgreSQL monitoring strategy. By using a tool like Redgate Monitor to track these metrics over time, and establish baselines for them, you'll be able to spot resource pressure or performance issues immediately, quickly diagnose the cause, and prevent them becoming problems that affect users.
-

Live training session
Lou Test 2
With database estates growing faster than ever, deployment rates increasing, and constant demand for fast fixes and high availability, using the right monitoring tool is the only way to keep track of what’s going on across all of your databases, instances, and servers. In this webinar, discover how SQL Monitor can provide answers to the
-

Webinar
Stepping into Database DevOps with SQL Toolbelt Essentials and Redgate Monitor
As application development speeds up, the right tools are essential in order to ensure that your database development keeps pace. Learn about how SQL Toolbelt Essentials and Redgate Monitor can help you deliver accurate database changes faster and resolve problems when they occur.