Monitoring Database Security and Compliance alongside Performance
Managing database security, compliance, and performance across a complex estate is no easy task. Redgate Monitor Enterprise brings all the data you need into one place. This article explores how it helps DBAs track user permissions, ensure configuration compliance, create custom reports, and implement resilient high-availability monitoring.
Redgate Monitor Enterprise provides the extra features DBAs need to maintain security, continuity, and control over complex database estates, often spanning multiple platforms, geographic locations, and regulatory requirements. In this article, we’ll explore how it allows DBAs to:
- Get a detailed view of user permissions and access rights – proactively track who has access to what across your monitored estate.
- Automatically track changes to security and other configuration settings – easily audit the estate for compliance with organizational security and configuration policies.
- Produce custom reports using a REST API – access Redgate Monitor data to create visualizations tailored to the needs of various teams and stakeholders.
- Ensure continuous availability of the monitoring service – in regulated environments, even short data gaps are unacceptable. Native high availability ensures continuous collection and visibility of the monitoring data.
With Redgate Monitor Enterprise, the information you need to track and audit database permissions and configuration is all in one place, for the whole estate, alongside the performance and server health data that reveal user and process activity patterns. This can often lead to earlier threat discovery and more effective mitigation.
Security monitoring: permissions and configuration
By automating the tracking of user permissions and server configuration, Redgate Monitor Enterprise minimizes the risk of unauthorized access and helps DBAs control and audit settings that can compromise data security or server performance. It also reduces the manual effort required to ensure that permissions and configurations are aligned with organizational policies or regulatory standards. You will need an Enterprise license to use the Permissions and Configuration compliance features. Both currently support SQL Server only, though support for other RDBMSs is in development. You can find both features under the Security menu item:

Tracking user access rights and permissions
The Permissions feature in Redgate Monitor Enterprise offers instant visibility into user access rights, both current and historical, helping database administrators (DBAs) track and manage which logins, roles, and users have access to which servers and databases, with what permissions.
Why is monitoring permissions important?
By regularly auditing who has access to what, organizations can prevent unauthorized access, data breaches, and potential misuse of sensitive information. It aids in identifying and rectifying any inadvertent or suspicious permission changes that could compromise the safety of the data. It allows DBAs to quickly assess an estate for adherence to the Principle of Least Privilege to ensure that only authorized users can perform specific actions, aligning with internal security policies and external regulatory requirements. This reduces the risk of errors and increases operational efficiency.
How does permission monitoring work in Redgate Monitor?
After adding a SQL Server instance, Redgate Monitor Enterprise will automatically start to sample permission data. To see this information, open the Security dropdown on the main menu and select Permissions.

Using the various tabs on the Permissions page, the DBA can track everything from membership of all-powerful server roles down to the granular permissions a database user has on a table:
- Servers – a server-by-server breakdown of server-role membership, authentication type (e.g. Windows groups and users in local or AD domain, SQL Server login), users with “super permissions”, and owners and users of each installed database
- Databases – a per-database breakdown of the users and database roles with access, associated authentication type, and permissions.
- Users – a per-user breakdown of server and database role membership and permissions.
Every record in these tables is interactive. Clicking on a specific record opens a detailed dialog that provides more comprehensive information about the permissions for that server, database or user. For more information, see the Permissions section of the Redgate Monitor documentation.
Tracking changes to configuration settings
Redgate Monitor Enterprise’s Configuration Compliance feature automatically tracks a range of important instance and database configuration settings for security, optimizing performance, and ensuring a standardized operational environment across instances. The feature is designed to help database administrators (DBAs) ensure these configurations align with organizational standards, regulatory frameworks and recognized benchmarks. It allows them to compare the current database and server configurations against predefined templates, identifying any deviations that require investigation.
Why track configuration settings?
If someone makes unauthorized changes to configuration settings, it could compromise the availability, performance or security of your servers and databases. For example, industry-standard security benchmarks will suggest that the following SQL Server security settings should be disabled, wherever possible, to limit potential attack vectors and help ensure compliance with the principle of least privilege.
- Cross-Database Ownership Chaining – can allow a user with permissions in one database to access objects in another without explicit permission checks
- Remote access – widens the attack surface by giving users or processes the ability to execute stored procedures on another instance
- xp_cmdshell – allows execution of powerful operating system commands directly from SQL Server. In the wrong hands, these commands can compromise the server.
- External scripts enabled – allows SQL Server to execute R, Python, or other scripts, often with the ability to access resources beyond the normal scope of database operations (e.g., file systems, external networks)
- Common Language Runtime (CLR) – allows users to load .NET Framework assemblies that potentially bypass native security mechanisms and execute code far beyond the scope of their database roles.
If any of these settings are inadvertently enabled on an instance or are maliciously enabled, the DBA would want to know immediately. Conversely, there are other security settings that you may want to ensure are enabled. For example, is Transparent Data Encryption (TDE) enabled on all databases that require it? Is Force Encryption enabled on all instances hosting handling sensitive or regulated data?
Redgate Monitor Enterprise will allow DBAs to answer such questions instantly, as well as to ensure that other important settings adhere to organizational standards, such as those relating to performance (e.g. Max degree of parallelism, Optimize for ad hoc workloads, etc.) or the broader operational environment (e.g. Total Memory, Replication XPs, etc.).
How to create a compliance template
Redgate MonitorEnterprise compliance templates are pre-defined against industry standards like the CIS Benchmark for SQL Server 2022, or according to the requirements of a compliance framework such as SOC 2. You can also add custom compliance templates.
To do this, navigate to the compliance template tab and click Add new template. From there you can create either a Server template or a Database template. You can read more about compliance templates in our documentation.

How to check if a server or database is compliant
Once you have created a compliance template, you can navigate to the Server or database tabs and select any template you have created, and Redgate Monitor Enterprise will show you the percentage of compliance across your entire estate. Furthermore, you can drill down to view more details about exactly what properties of your server or database are not compliant.

Custom reporting using the REST API
The Redgate Monitor Enterprise REST API allows users to obtain data from the Redgate Monitor repository and visualize it using a data visualization tool of their choice. The API is read-only and cannot be used to modify Redgate Monitor in any way. The data that can currently be retrieved includes monitored entities, raised alerts, machine disk usage, database backups, and several machine, database and server metrics. There is a unique endpoint for each of these and the data from them can be combined in various ways.
Custom reports and visualizations
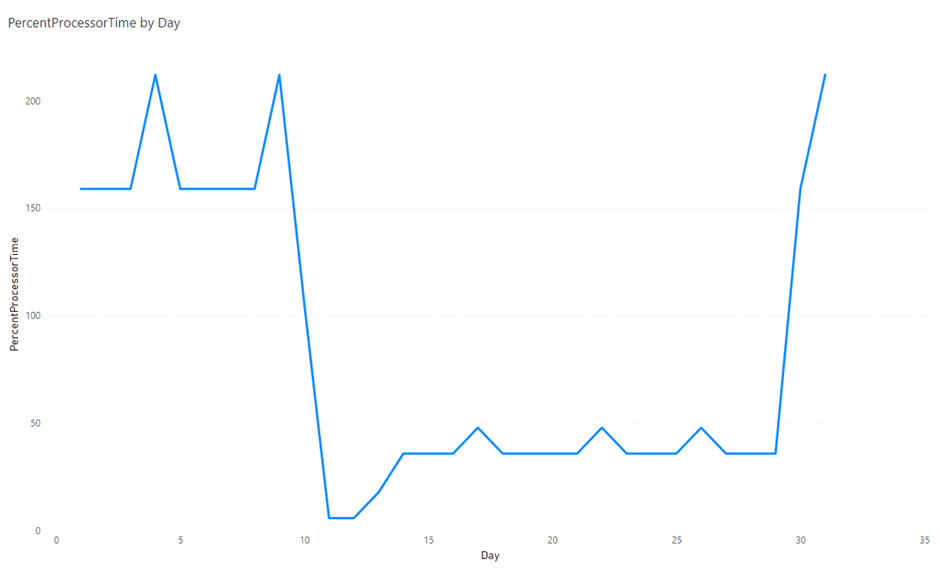
The primary function of the REST API is to allow users to retrieve data from the repository database and create custom reports or dashboards using a data visualization tool of their choice. The API can be directly plugged into PowerBI or similar tools, where users can filter the data based on their use cases, create custom visualizations, and share insights with other users. It allows users to share this data and visualizations easily and seamlessly with others who may not have direct access to Redgate Monitor.
The following custom graph shows processor usage by time of day, for a particular server:

How to use the REST API
You can experiment with the REST API by navigating to http://your-web-server:port/api-docs. The endpoints, the query parameters and the schema of the responses are outlined on this page.
To access the information from the API in PowerBI or other visualization tools, you need to create an authentication token. This can be generated from the Configuration page of Redgate Monitor according to the steps described in the documentation. Once the authentication token has been obtained, you can set up the data retrieval from the API in PowerBI by following the steps described here.
The REST API endpoints are all protected by a default rate limit which is 100 requests per 60 seconds. The number of requests and time limit can be configured as per your requirements by following these steps.
Native High Availability Monitoring
Native High Availability monitoring in Redgate Monitor Enterprise helps ensure uninterrupted monitoring. It provides redundancy in the base monitoring service, the web service, or both, and supports automatic failover in the case of a failure of any one of the components.
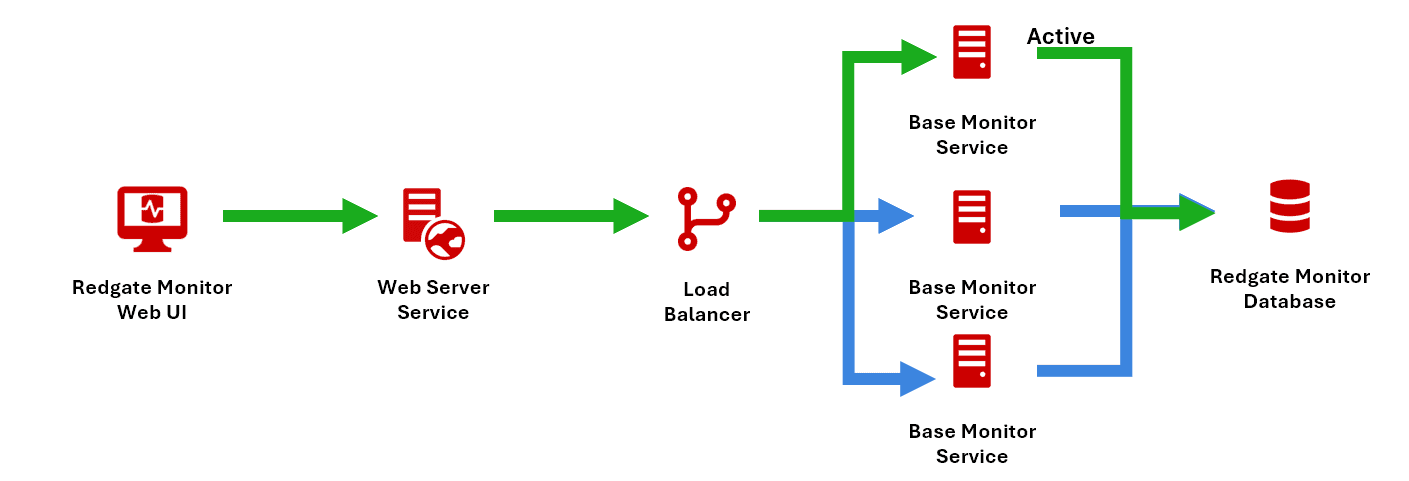
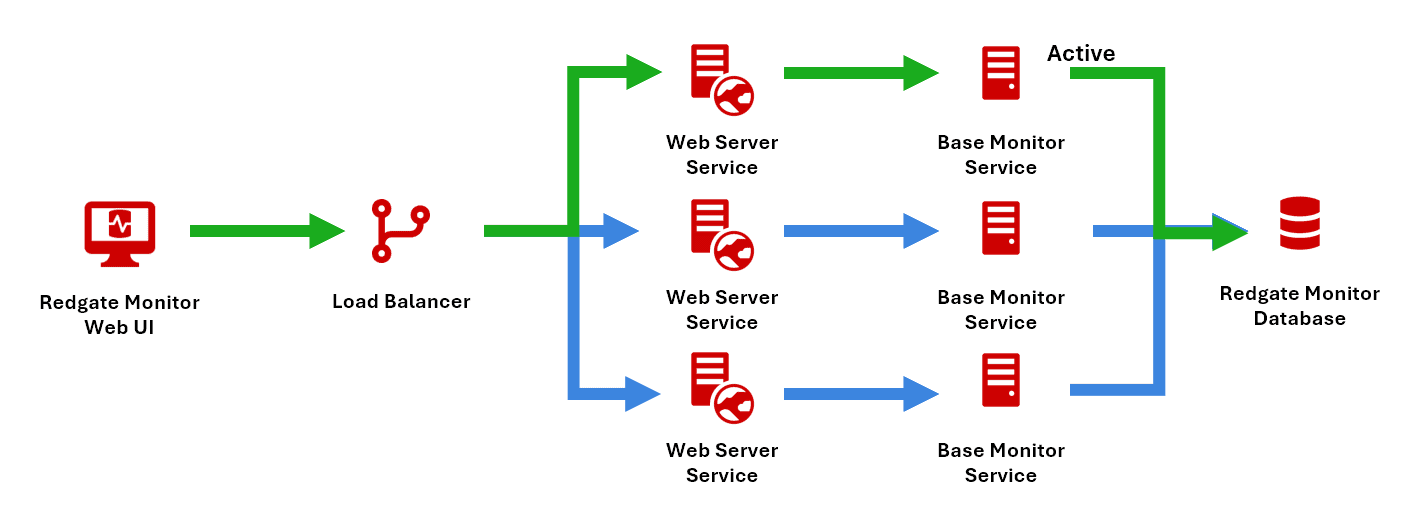
There are two architectures to enable native HA monitoring. One uses redundant (passive) Base Monitors with a single Web Service and ensures continuous data collection in the event of a failure in one of the Base Monitors. The other uses active/passive Web Service and Base Monitor pairs and ensures both continuous data collection and data availability.
Native HA monitoring requires no extra licenses; a passive Base Monitor will, on failover, simply reuse the same license as the previously active one. In either architecture, High Availability for the SQL Server repository must be managed separately using SQL Server Availability Groups.
Redundant Base Monitors with a Single Web Service
Multiple Base Monitors operate for the same repository, with one active at a time. A heartbeat from the active Base Monitor is updated continuously in the shared repository. If the heartbeat stops, a passive monitor will detect this and automatically promote itself to active status. A load balancer then re-routes traffic to the active Base Monitor for seamless failover.

Redundant Base Monitor-Web Service Pairs
This setup works similarly but here the load balancer directs traffic to the active Web Service and Base Monitor pair. If the heartbeat of the Base Monitor in the active pair fails, a passive pair promotes itself to active status, and the load balancer redirects traffic to this new pair, preserving service availability without manual intervention.

Native High Availability versus ‘Standard’ High Availability
It is possible to set up high availability monitoring using standard Redgate Monitor licenses, as described here. Standard HA relies on Windows Failover Cluster Resources, where there can only be one instance of the Web Server and of the Base Monitor Service at any time, so failover requires manually starting a new service instance. You are allowed 7 days to restore the Web Service responsible for licensing to avoid a loss of service.
Native HA monitoring removes these limitations, providing instantaneous failover, reducing downtime and ensuring seamless monitoring.
Finding the right HA solution
We know that every Redgate Monitor Enterprise implementation comes with unique considerations around geography, security requirements, and platforms. If you need advice, please contact our Customer Success team who can help you design and implement the right Native HA solution.
Summary
Redgate Monitor Enterprise provides users with advanced features for tracking user permissions and access rights, auditing instance- and database-level configuration changes, customizable reporting, and resilient high-availability monitoring architectures. Our goal is to help DBAs manage distributed, highly regulated database environments without needing to build and maintain complex custom metrics and reports.
The security features help harden security and simplify compliance. The REST API provides custom reporting using existing data visualization tools. Native high availability ensures uninterrupted monitoring, even during service disruptions, so DBAs can maintain full oversight of the estate.
To discover more, you can try our online global dashboard and then download a free trial.
Tools in this post
Redgate Monitor
Real-time multi-platform performance monitoring, with alerts and diagnostics


