Monitoring the Application with Redgate Monitor: Website Activity
Using a PowerShell script that collects log data from a web server, plus a Redgate Monitor custom metric, Phil Factor offers a way to check for suspicious website errors and unusual patterns of activity, right alongside your database monitoring.
As well as being essential for giving you an overview of the SQL Server installations that you look after, Redgate Monitor can also be used in ways that aren’t so immediately obvious.
One immediate advantage it has as a monitoring tool is that it isn’t part of any one server, database or application: it is independent. This means that if one or more components of a system crash, it is unlikely to prevent people from being alerted that it has happened. Also, it is difficult to disable the oversight of processes for malicious reasons. Redgate Monitor can also represent variation in a metric graphically and compare it with a baseline. It can send you alerts on that metric. Finally, it allows you to create a custom metric from any SQL Batch that returns an integer. These four virtues mean that it can provide a simple but effective way to monitor an application.
In order to demonstrate this, we’ll set up a simple application, in this case an actual website, and read its logs. We can then report on usage, as well as on any problems, which are normally probing attacks. This is an important part of administering any application, but one that is generally rather tedious without automated processes to do it. Using Redgate Monitor, we can simply create a custom metric to collect the web log data, on a schedule, and report it graphically.
When we see odd usage patterns, we’ll know exactly when it happened and can investigate further. For performance issues, we’ll have a direct link between application behavior and the resulting query behavior and resource constraints seen in SQL Server. For possible security issues, we get an early warning that the operations team can investigate, using more specialized tools. Where there is a service interruption, it can be remedied quickly.
Monitoring application activity, alongside the database, is a good example of how development and operations people can share their skills for mutual benefit, to get a better understanding of what is happening with an application.
Collecting the web log data
Often, web logs are used only after something goes horribly wrong, because the process of monitoring text-based logs is generally manual, and difficult to automate for continuous checks. In our case, the Apache Web Server usage logs are retained on the site for a month (30 days, in fact), zipped up using GZip. The log data for the past two days is unzipped.
The web usage log has a standard format that includes, among other things, the type of HTTP operation request, the IP address of the requestor, the User ID, the time the request was made, the body of the request and the UserAgent (describing the type of browser, the identity of an indexing bot, and so on). There is also an error log, which is undated, and records all errors, failed logins, or bad requests, as well as scripting errors from PHP or Perl.
For the Apache server there is no equivalent to Windows IIS logging via ODBC, so there is no way for the Web Server to transfer the log records directly into a database. However, all the log data is accessible via FTP.
Normally, in a production system, one keeps any regular FTP transfer at arms-length because active FTP isn’t very secure. For that purpose, we’ll use a windows management server in a DMZ or logical subnet. The task of the management server is to:
- Interrogate the server for the date and time of the last log record and error stored.
- FTP the necessary files.
- Unzip any files, if required.
- Parse the contents of the records.
- Check the UserAgent field in the usage log records to filter out bot records that are merely indexing the site for search engines, and so send to SQL Server only log records representing real website visits, and only those that it hasn’t already got.
- Store the required records in the database, via a SQL Server connection.
- Insert the required log records into a log file archive on a shared file server.
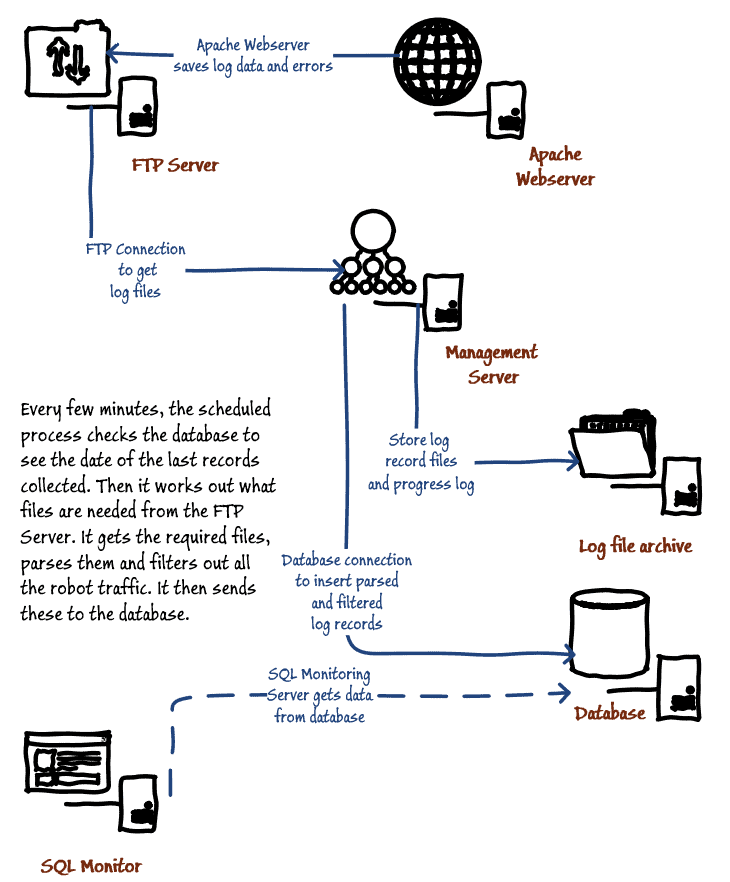
The receiving SQL Server has only to do any reporting and aggregation that is required.
Getting all scripted up
This is the type of system that was established at a time when operations people had far fewer websites and could schedule their time to do regular manual checks on all operational systems.
Such is the workload nowadays that it is a struggle to do manual checks, especially with the less-important services. However, the nature of today’s internet threats means it is no longer safe to neglect any live internet-facing website. For a system like this, which wasn’t designed for automation, we need to spend a bit of time to script this and store the relevant log records in a SQL Server database.
The PowerShell
Our PowerShell script will perform all the previously-described tasks, on a schedule. We develop it in the PowerShell ISE, then test it out in a command-line, using the credentials we’ll use for the working system. Finally, we schedule it, using the same credentials. The task has no console, so it must log its activities and errors to a progress log file.
To make the logging more resilient, the process will create the log tables in the database, if they do not already exist, and stock the InputLogPageReads table with the previous thirty days’ pageviews. It also stocks the error log table (WebsiteErrors) with the current contents of the error file.
Most access log activity on a small website has no value. Either it comes from bot activity, indexing the site for search engines, or hackers tirelessly trying, with automated probes, to break into the system. We filter out all of this, before it gets to the database; otherwise you will have a bloated idea of the popularity of the site.
Here is the current PowerShell script. It uses the sqlserver module, so you’d need to install that first. It uses some modified functions from other authors. Other than that, all you need is the database because the script aims to create the tables in the database if they do not already exist.
|
1 2 3 4 5 6 7 8 9 10 11 12 13 14 15 16 17 18 19 20 21 22 23 24 25 26 27 28 29 30 31 32 33 34 35 36 37 38 39 40 41 42 43 44 45 46 47 48 49 50 51 52 53 54 55 56 57 58 59 60 61 62 63 64 65 66 67 68 69 70 71 72 73 74 75 76 77 78 79 80 81 82 83 84 85 86 87 88 89 90 91 92 93 94 95 96 97 98 99 100 101 102 103 104 105 106 107 108 109 110 111 112 113 114 115 116 117 118 119 120 121 122 123 124 125 126 127 128 129 130 131 132 133 134 135 136 137 138 139 140 141 142 143 144 145 146 147 148 149 150 151 152 153 154 155 156 157 158 159 160 161 162 163 164 165 166 167 168 169 170 171 172 173 174 175 176 177 178 179 180 181 182 183 184 185 186 187 188 189 190 191 192 193 194 195 196 197 198 199 200 201 202 203 204 205 206 207 208 209 210 211 212 213 214 215 216 217 218 219 220 221 222 223 224 225 226 227 228 229 230 231 232 233 234 235 236 237 238 239 240 241 242 243 244 245 246 247 248 249 250 251 252 253 254 255 256 257 258 259 260 261 262 263 264 265 266 267 268 269 270 271 272 273 274 275 276 277 278 279 280 281 282 283 284 285 286 287 288 289 290 291 292 293 294 295 296 297 298 299 300 301 302 303 304 |
<# File location Details #> $destination = 'MyPathToThe\Logs' $progressLog = "$destination\ProgressLog.txt" <# FTP Site Details #> $FtpUserName = 'MyWebUserName' $FTPsite = 'MyFTPSiteURL' <# SQL Server Site Details #> $SQLUserName = 'MyUsername' $SQLInstance = 'MyDatabaseServer' $SQLDatabase = 'WebsiteUsage' $TableName = 'InputLogPageReads' $ReportTableName = 'ETLReport' $ErrorTableName = 'WebsiteErrors' $popVerbosity = $VerbosePreference $VerbosePreference = "Silentlycontinue" # the import process is very noisy if you are in verbose mode Import-Module sqlserver -DisableNameChecking #load the SQLPS functionality $VerbosePreference = $popVerbosity set-psdebug -strict $ErrorActionPreference = "stop" Trap { # Handle the error $err = $_.Exception "$(Get-Date): $($err.Message) at line $($_.InvocationInfo.ScriptLineNumber)" >>$progressLog write-error "at line $($_.InvocationInfo.ScriptLineNumber) $($err.Message)" while( $err.InnerException ) { $err = $err.InnerException write-error $err.Message }; # End the script. "$(Get-Date): terminated" >>$progressLog break } function Read-ApacheErrorLog { [CmdletBinding()] [OutputType([psobject])] param ( [parameter(mandatory = $true, ValueFromPipeline = $true, ValueFromPipelineByPropertyName = $true)] $Path ) process { Get-Content -Path $Path | Foreach-Object { # combined format if ($_ -notmatch "^\[(?<TimeString>.*?)\] \[(?<fcgid>.*?)\] \[(?<pid>.*?) \[client(?<client>.*?)\] (?<Error>.+)") { throw "Invalid line: $_" } $entry = $matches $entry.Time = [datetime]::parseexact($entry.TimeString, 'ddd MMM dd HH:mm:ss.ffffff yyyy', $null) return New-Object PSObject -Property $entry } } } function Read-ApacheLog <# from the gist of http://sunnyone.org/ #> { [CmdletBinding()] [OutputType([psobject])] param ( [parameter(mandatory = $true, ValueFromPipeline = $true, ValueFromPipelineByPropertyName = $true)] $Path ) process { Get-Content -Path $Path | Foreach-Object { # combined format if ($_ -notmatch "^(?<Host>.*?) (?<LogName>.*?) (?<User>.*?) \[(?<TimeString>.*?)\] `"(?<Request>.*?)`" (?<Status>.*?) (?<BytesSent>.*?) `"(?<Referer>.*?)`" `"(?<UserAgent>.*?)`"$") { throw "Invalid line: $_" } $entry = $matches $entry.Time = [DateTime]::ParseExact($entry.TimeString, "dd/MMM/yyyy:HH:mm:ss zzz", [System.Globalization.CultureInfo]::InvariantCulture) if ($entry.Request -match "^(?<Method>.*?) (?<Path>.*?) (?<Version>.*)$") { $entry.Method = $matches.Method $entry.Path = $matches.Path $entry.Version = $matches.Version } return New-Object PSObject -Property $entry } } } function Expand-GZip { <# .NOTES Copyright 2013 Robert Nees Licensed under the Apache License, Version 2.0 (the "License"); .SYNOPSIS GZip Decompress (.gz) .DESCRIPTION A buffered GZip (.gz) Decompress function that support pipelined input .Example ls .\RegionName.cs.gz | Expand-GZip -Verbose -WhatIf .Example Expand-GZip -FullName CompressFile.xml.gz -NewName NotCompressed.xml .LINK http://sushihangover.blogspot.com .LINK https://github.com/sushihangover #> [cmdletbinding(SupportsShouldProcess=$True,ConfirmImpact="Low")] param ( [Alias("PSPath")][parameter(mandatory=$true,ValueFromPipeline=$true,ValueFromPipelineByPropertyName=$true)][string]$FullName, [parameter(mandatory=$false)][switch]$Force ) Process { if (Test-Path -Path $FullName -PathType Leaf) { Write-Verbose "Reading from: $FullName" $tmpPath = ls -Path $FullName $GZipPath = Join-Path -Path ($tmpPath.DirectoryName) -ChildPath ($tmpPath.BaseName) if (Test-Path -Path $GZipPath -PathType Leaf -IsValid) { Write-Verbose "Decompressing to: $GZipPath" } else { Write-Error -Message "$GZipPath is not a valid path/file" return } } else { Write-Error -Message "$FullName does not exist" return } if (Test-Path -Path $GZipPath -PathType Leaf) { If ($Force.IsPresent) { if ($pscmdlet.ShouldProcess("Overwrite Existing File @ $GZipPath")) { $null> $GZipPath } } } else { if ($pscmdlet.ShouldProcess("Create new decompressed File @ $GZipPath")) { $null > $GZipPath } } if ($pscmdlet.ShouldProcess("Creating Decompressed File @ $GZipPath")) { Write-Verbose "Opening streams and file to save compressed version to..." $input = New-Object System.IO.FileStream (ls -path $FullName).FullName, ([IO.FileMode]::Open), ([IO.FileAccess]::Read), ([IO.FileShare]::Read); $output = New-Object System.IO.FileStream (ls -path $GZipPath).FullName, ([IO.FileMode]::Create), ([IO.FileAccess]::Write), ([IO.FileShare]::None) $gzipStream = New-Object System.IO.Compression.GzipStream $input, ([IO.Compression.CompressionMode]::Decompress) try { $buffer = New-Object byte[](1024); while ($true) { $read = $gzipStream.Read($buffer, 0, 1024) if ($read -le 0) { break; } $output.Write($buffer, 0, $read) } $GZipPath=$null; } finally { Write-Verbose "Closing streams and newly decompressed file" $gzipStream.Close(); $output.Close(); $input.Close(); } } } } <# firstly we deal with the SQL Server connection Details #> "$(Get-Date): Getting credentials" >>$progressLog $SqlEncryptedPasswordFile = ` "$env:USERPROFILE\$($SqlUserName)-$($SQLInstance).txt" # test to see if we know about the password in a secure string stored in the user area if (Test-Path -path $SqlEncryptedPasswordFile -PathType leaf) { #has already got this set for this login so fetch it $Sqlencrypted = Get-Content $SqlEncryptedPasswordFile | ConvertTo-SecureString $SqlCredentials = ` New-Object System.Management.Automation.PsCredential($SqlUserName, $Sqlencrypted) } else #then we have to ask the user for it { #hasn't got this set for this login $SqlCredentials = get-credential -Credential $SqlUserName $SqlCredentials.Password | ConvertFrom-SecureString | Set-Content $SqlEncryptedPasswordFile } <# Now we deal with the FTP connection Details #> $FTPInstructions = "$env:USERPROFILE\ftpInstructions" $FtpEncryptedPasswordFile = ` "$env:USERPROFILE\$("$($FtpUserName)-$($FTPsite)" -replace '(?i)\W', '-').txt" # test to see if we know about the password in a secure string stored in the user area if (Test-Path -path $FtpEncryptedPasswordFile -PathType leaf) { #has already got this set for this login so fetch it $Ftpencrypted = Get-Content $FtpEncryptedPasswordFile | ConvertTo-SecureString $FtpCredentials = ` New-Object System.Management.Automation.PsCredential($FtpUserName, $Ftpencrypted) } else #then we have to ask the user for it { #hasn't got this set for this login $FtpCredentials = get-credential -Credential $FtpUserName $FtpCredentials.Password | ConvertFrom-SecureString | Set-Content $FtpEncryptedPasswordFile } <# have we already got data there, if so use that as the start for logs an errors #> $startDate=(get-date).AddDays(-29) $ErrorstartDate=[datetime]::FromOADate(0) $TableExists= Invoke-Sqlcmd -Query "SELECT object_id('$tablename') as itexists" ` -ServerInstance $SQLInstance ` -Credential $SQLCredentials -database $SQLDatabase if ($TableExists.itexists.GetType().Name -eq 'Int32') { <# fetch the last row received by the database #> $time = Invoke-Sqlcmd -Query "SELECT max(Time) as Latest from $tablename" ` -ServerInstance $SQLInstance ` -Credential $SQLCredentials -database $SQLDatabase if ($time.Latest.GetType().Name -ne 'DBNull') {$startDate=get-date -date $time.Latest} } <# What about the error data. Firstly does the table exist? #> $ErrorstartDate=[datetime]::FromOADate(0) $ErrorTableExists= Invoke-Sqlcmd -Query "SELECT object_id('$Errortablename') as itexists" ` -ServerInstance $SQLInstance ` -Credential $SQLCredentials -database $SQLDatabase <# if there is already data there, get the date from it #> if ($ErrorTableExists.itexists.GetType().Name -eq 'Int32') { <# fetch the last error row received by the database #> $time = Invoke-Sqlcmd -Query "SELECT max(Time) as Latest from $Errortablename" ` -ServerInstance $SQLInstance ` -Credential $SQLCredentials -database $SQLDatabase if ($time.Latest.GetType().Name -ne 'DBNull') {$ErrorstartDate=get-date -date $time.Latest} } <# put the value in the progress log. We will use it to work out what we need to download #> "$(Get-Date): last log was $($startDate)" >>$progressLog "$(Get-Date): last error was $($ErrorstartDate)" >>$progressLog <# how many days worth? (or is this current) #> <# work out what files to get. Anything older than two days ago needs to be unzipped. It actually creates the FTP commands #> $filesToGet = @(); $LogFiles = @(); $Backdate=$startDate while ($Backdate.Date -le (get-date).date) { $TodaysDate="$(Get-date -date $BackDate -UFormat %Y%m%d)-access.log"; $LogFiles+=$TodaysDate $filesToGet+="$TodaysDate$(if ((get-date).DayOfYear-$Backdate.DayOfYear -gt 1) { '.gz' })" $BackDate=$Backdate.AddDays(1) } <# now create the FTP list that goes in the command file #> $ftpList='' $filesToGet|foreach{$ftpList+="binary get $($_) "} #create a file with all the commands in it "open $FTPsite $FtpUserName $($FtpCredentials.GetNetworkCredential().Password) prompt cd log get error.log $($ftpList)close quit bye " > $FTPInstructions #save the ftp commands to a file cd $destination #go to the directory to save to ftp -s:$FTPInstructions >>$progressLog #run Windows FTP Remove-Item $FTPInstructions #and delete the file immediately! #ls "$destination\*.gz" | Expand-GZip # expand any GZIP files that you downloaded $filesToGet | where-object {$_ -like '*.gz'} | foreach { "$destination\$($_)" } | Expand-GZip #report on progress "$(Get-Date): received $($filesToGet.Count) file" >>$progressLog #now read the logs, filter them and create an object containing just what we need to #Define the strings in the user agent that mean it was just a bot $regex = [regex] '(?i)externalhit|adscanner|ltx71|archiver|Qwantify|Daum|scrapy|checklink|Yeti|Nutch|bot|krowler|google|spider|Crawl|knowledge|WebDataStats' #send to the database# $rows = $LogFiles | foreach { "$destination\$($_)" } | Read-ApacheLog | Where-Object { $_.Time -gt $startDate } | Where-Object { -not $regex.IsMatch($_.UserAgent) } | Select-Object path, Time if ($rows.Count -gt 0) { Write-SqlTableData -inputData $rows -ServerInstance $SQLInstance ` -database $SQLDatabase -Credential $SQLCredentials ` -SchemaName "dbo" -TableName $tablename -Force } $ErrorRows = Read-ApacheErrorLog "$destination\error.log" | Where-Object { $_.Time -gt $ErrorStartDate } | Select-Object client,TimeString, Time, pid, fcgid, Error if ($ErrorRows.Count -gt 0) { Write-SqlTableData -inputData $Errorrows -ServerInstance $SQLInstance ` -database $SQLDatabase -Credential $SQLCredentials ` -SchemaName "dbo" -TableName $errortablename -Force } <# and report success to the progress log #> $success=[string] "$(Get-Date): finished. Wrote $($rows.Count) pageviews" $success >>$progressLog $row=@{} $row.success=$success Write-SqlTableData -inputData $row ` -ServerInstance $SQLInstance -database $SQLDatabase ` -Credential $SQLCredentials ` -SchemaName "dbo" -TableName $ReportTablename -Force |
The first time it runs it takes a while to collect what it can of the existing logs. I’ve set it to read the last thirty days logs, when starting up from scratch. For a large site, this will need changing to take smaller gulps.
This PowerShell script is run every few minutes on the scheduler on the Windows management server. The UserID that runs the scheduled task has restricted rights to network shares, and needs database read/write access. It needs an FTP account that can access the remote FTP server. The problem I found on Windows Server is that the FTP utility uses active FTP, which is usually prevented by the firewall. A Windows 10 machine works fine.
I create the Windows account that will run the PowerShell process, part of which is to perform the FTP transfer. Then, I log in to the management server using the credentials of that account holder and run the script interactively in the PowerShell ISE until all problems are fixed. This means that I can ensure that the IDs and encrypted passwords are saved securely in the user’s area, and check that all the access rights are correct. If you change a password, you will need to delete the old password file in the user’s area and run the script interactively again.
Once everything is running well interactively, it’s time to run it from the PowerShell command line. If it runs there, then it will run in the scheduler with the same UserID.
The Redgate Monitor custom metrics and alerts
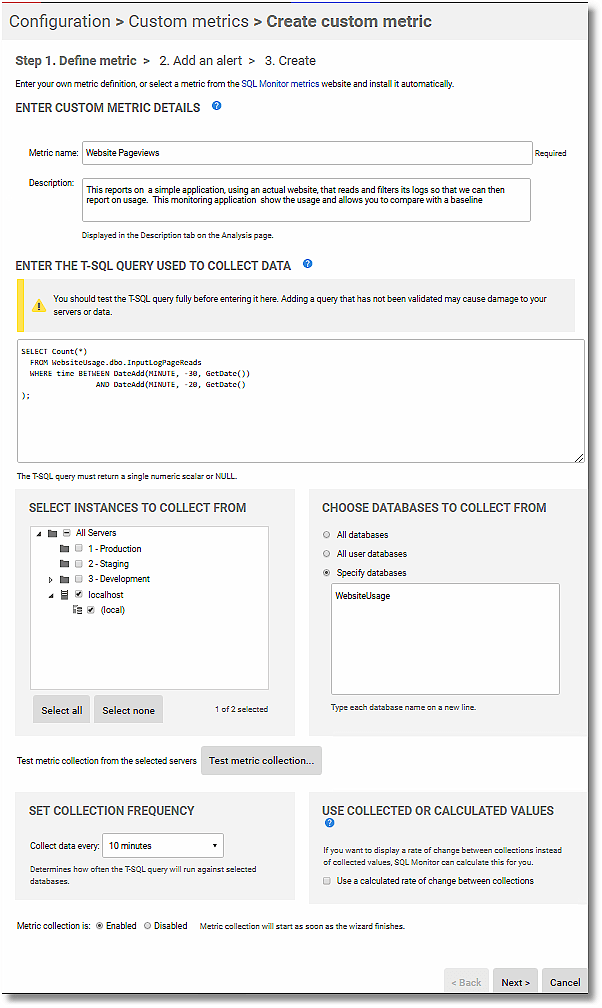
The script for the Website Pageviews custom metric simply counts the number of log records inserted into the InputLogPageReads table in the last 10 minutes. In fact, I chose to count the number of records in the ten-minute interval between 30 and 20 minutes ago, just to be certain of the number of records, but this is easy to change.
|
1 2 3 4 5 |
SELECT Count(*) FROM WebsiteUsage.dbo.InputLogPageReads WHERE time BETWEEN DateAdd(MINUTE, -30, GetDate()) AND DateAdd(MINUTE, -20, GetDate() ); |
A second custom metric, called Website errors or similar, detects whether any errors have occurred over the same period. Again, you can change the latency to whatever you prefer.
|
1 2 3 4 5 |
SELECT Count(*) FROM WebsiteUsage.dbo.WebsiteErrors WHERE time BETWEEN DateAdd(MINUTE, -30, GetDate()) AND DateAdd(MINUTE, -20, GetDate() ); |
Both custom metrics are scheduled to run every 10 minutes. Here is the Redgate Monitor configuration screen for the Website Pageviews custom metric:
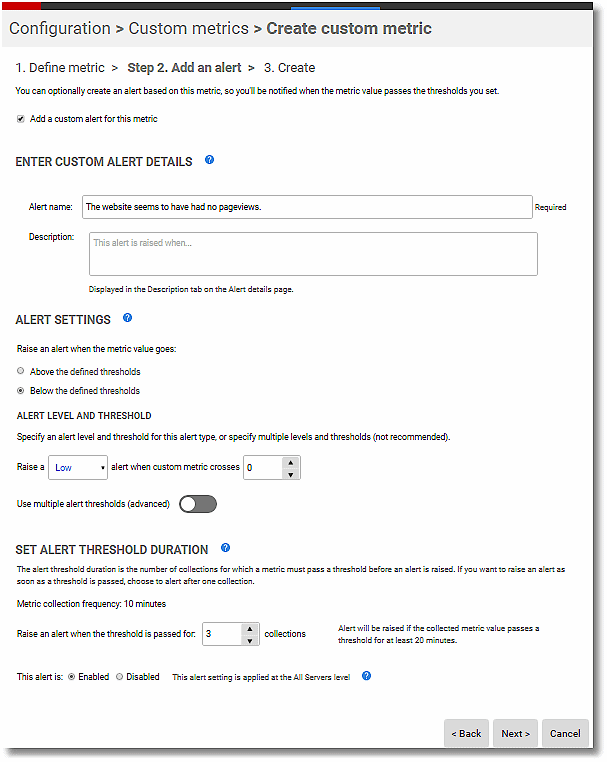
The method of alerting, and the type of alerts required, is best left as a decision for the administrator. This is where the virtues of Redgate Monitor show themselves. I like to know if there is no activity on the site for a period, because that suggests that the site has gone offline, so I set up one alert for no activity:
I also like to know of a sudden spike in usage, so I set up another alert for that. Often, these sudden spikes are just happenstance. On one occasion, the website I was administering was mentioned on prime-time television, and the site got over a million pageviews, but that is another story.
Often, it is a deliberate attack on the site. Sadly, a lot of internet processes are dedicated to trying to find vulnerabilities, and these are often quite subtle. These attacks show up in both the error logs and the usage logs and they are often interesting to check on. Most will show up in the database records and if you know the time they happened, the full logs are in the local archive and easily inspected with a text editor for forensics. These attacks generally probe the LAMP stack and show up a wonderland of PHP and MySQL vulnerabilities.
I keep what is often called a ‘tethered goat’, which is an apparently-useful and innocuous website, which is there with enticing signs of vulnerabilities, though in reality completely isolated. It gets a great deal of attention from the dark web.
Monitoring and reporting
Once all this is set up then in Redgate Monitor, you can look at the custom metrics either in an analysis graph, or you can set it up more permanently in a report, which can then be emailed to you.
I much prefer emails for regular checks, as it takes less of my time. By specifying the two metrics, each as tiles in a report, you will quickly be able to see the general activities going back up to a month. Here is an example report showing the result of three days of monitoring:
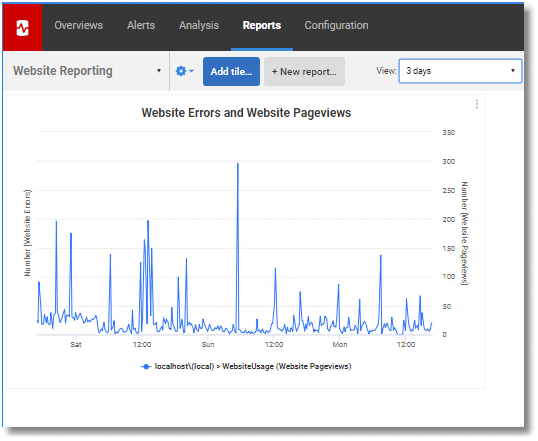
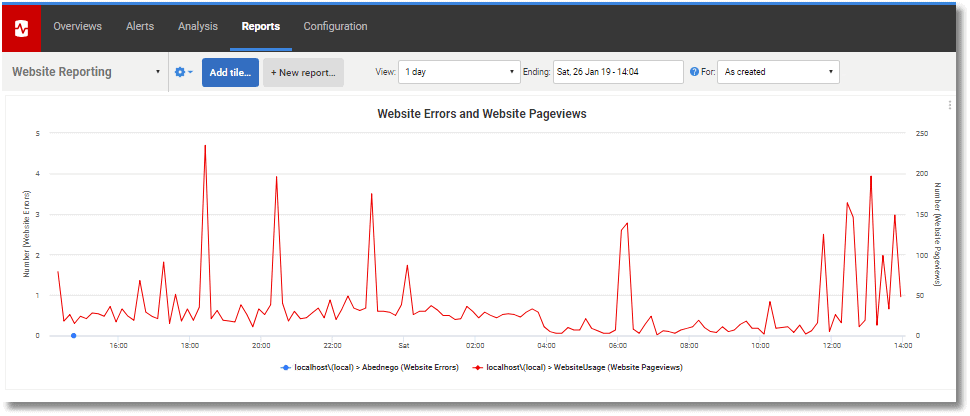
The spike on Sunday morning was not the result of an attack but was caused by the indexing of the entire site by a robot that was not properly marked in the UserAgent. It is very easy to explore this either by inspecting the logs in the file repository or in the SQL table.
It is probably more interesting to see variations of the ten-minute metrics, over a day, like this:
Querying the logs for the details
To get general reports on the logs in SQL, and to tidy up the records in the SQL Server database, there are a few obvious SQL queries that can be made.
|
1 2 3 4 5 6 7 8 9 10 11 12 13 14 15 16 17 18 19 20 21 22 23 24 25 26 27 28 29 30 |
/** display the top 100 pages viewed**/ SELECT TOP 100 path, Count(*) FROM WebsiteUsage.dbo.InputLogPageReads WHERE path LIKE '%.html' GROUP BY path ORDER BY Count(*) DESC; /* show the website usage per day. */ SELECT Convert(CHAR(10), TIME), Count(*) FROM WebsiteUsage.dbo.InputLogPageReads GROUP BY Convert(CHAR(10), TIME) ORDER BY Max(time); /* show the website usage per week. */ SELECT Convert(CHAR(10), Min(time)) AS [week-start], Convert(CHAR(10), Max(time)) AS [week-end], Count(*) AS PageViews FROM WebsiteUsage.dbo.InputLogPageReads GROUP BY DatePart(WEEK, TIME) ORDER BY Max(time); /* deduplicate the log table (duplicates happen during an automated attack) */ DECLARE @duplicates TABLE (PATH NVARCHAR(MAX), TIME DATETIME); INSERT INTO @duplicates (PATH, TIME) SELECT PATH, TIME FROM InputLogPageReads GROUP BY PATH, TIME HAVING Count(*) > 1; DELETE FROM InputLogPageReads FROM InputLogPageReads AS original INNER JOIN @duplicates AS duplicates ON duplicates.PATH = original.path AND duplicates.TIME = original.time; INSERT INTO InputLogPageReads (path, time) SELECT PATH, TIME FROM @duplicates; /* show progress of the ETL transfers sent by the Windows Management server */ SELECT [KEY], Convert(DATETIME2, Convert(CHAR(19), value)) AS time, Substring(Convert(VARCHAR(2020), Value), 32, 2000) AS message FROM dbo.ETLReport ORDER BY time; |
Conclusion
When you are setting up monitoring for any database-driven application, it pays to be comprehensive. You should monitor the application as well as the server and database. This not only gives more, and often earlier, warning of performance problems, but also alerts you quickly when something breaks.
My boss used to tell me he didn’t care what happened to my ***** application, as long as the shopping cart worked well. That inspired me to monitor the shopping cart so well that I was able to display a personalized welcome message on his screen whenever he surreptitiously tested the cart.
Monitoring not only gives you an unparalleled insight into what is happening in the very bowels of the database server but must also warn you when things are going unpleasantly wrong elsewhere in the application. Before you start congratulating yourself that the database server is coping well with all this extra traffic, you need to be sure that the extra traffic isn’t being caused by someone siphoning off all your customer data from the application!
A good monitoring strategy will allow you to remedy problems quickly, and the data you collect should increase the bandwidth of the evidence you can provide as to the likely cause, which is essential for effective security. This requires more than just monitoring the built-in Server metrics. You need to monitor on a broad base, adding in custom metrics for processes right across the application. It pays to monitor and be alerted.
Tools in this post
Redgate Monitor
Real-time multi-platform performance monitoring, with alerts and diagnostics


