Ten Reasons your SQL Server Monitoring will Scale
This article explains ten ways that Redgate Monitor tackles the problem of scaling out the coverage of a single, lightweight monitoring system, and so allows your teams to maintain the health and performance of larger collections of databases and higher numbers of monitored SQL servers.
It was once possible for Ops DBAs to keep a close eye on the functioning and requirements of all the servers and their databases with nothing more than a good collection of SQL scripts and efficient recordkeeping. Although simple automation, using scripts, can go a long way towards speeding the process of gathering data on a small group of databases, it proves to be far more difficult to extend this approach beyond the Small to Medium Enterprise (SME).
As organizations have continued to scale out beyond the available infrastructure to cloud-hosted databases, there are few constraints on the growth of an organization’s databases. The number of databases that need to be monitored is now increasing at a far higher rate than the number of people available to do the work. Additionally, the adoption of DevOps practices requires developers and other team members to maintain extensive development and test environments.
All of this has led to a demand for database monitoring systems that can monitor an enterprise-wide estate of SQL Server databases, from one console, and that can alert when it is likely that someone needs to investigate or intervene. It also needs to be a system that provides clear diagnostics, graphs, summaries, and in-tool guidance, so that the tool is accessible to the whole team, including developers, managers or first responders, as well experienced DBAs. For scalable SQL Server monitoring, you need all of the following to be true:
- Lightweight, low-impact monitoring
- Efficient, high performance monitoring
- Adding any type of SQL Server is easy
- One Web UI for monitoring all SQL Servers
- Cross-platform and per-platform metrics and alerts
- Efficient Grouping and Automation
- Easily controlled alerts
- Summaries, aggregations, and projections alongside per-server details
- You know about deployments and other database changes
- You can answer the “What changed?” question quickly
1. Lightweight, low-impact monitoring
Redgate Monitor installs no agents, and its connection and data collection mechanisms are simple, transparent, and rely only well-established technologies like WMI and T-SQL.
Data collection and processing is done by a base monitor Windows service, which connects to each of the machines and SQL Server instances within any IP network and runs a series of data collection tasks, sampling data for a range of machine-, instance- and database-level metrics.
Redgate Monitor does not run complex data collection routines on any type of SQL Server, instead using only lightweight WMI and T-SQL queries that return quickly. It also resists the urge to gather a large range of data, irrespective of its value, because this will simply overwhelm the team as the system grows. With Enterprise monitoring systems, especially, ‘more’ is not necessarily better. Instead, Redgate Monitor starts small, collecting a carefully curated set of metric and alert data for all the common causes of SQL Server-related problems, plus those tailored for the specific requirements of cloud- or VMWare-hosted instances. It is then very easy to add custom metrics and alerts to suit the requirements of each business, server, and application.
Why scaling out manual monitoring is hard
Teams who rely on manual server monitoring and custom-built automation or who attempt to extend system monitoring tools to cover the database, struggle to scale out. These tools often require agent installation on the SQL Server, which is rarely approved in an Enterprise setting. They also run complex and expensive data collection queries that are hard to rewrite or extend to accommodate new SQL Server versions or features, or SQL Servers running on new platforms.
2. Efficient, high performance monitoring
Just as users of a monitoring seek to optimize SQL Server performance, so the monitoring tool, itself, is a user of SQL Server, and must be tuned relentlessly to ensure that it scales smoothly as the number of monitored servers grows. The development team on Redgate Monitor continually looks for ways to optimize it to gather, write, and process high volumes of database metrics and information as efficiently as possible. For example, Redgate Monitor has recently been revised so that the base monitor data collection service now runs on the lightweight .NET Core framework, and the data repository configuration has been optimized to exploit delayed durability, data compression, and all recent query optimizer hotfixes and enhancements.
Currently, depending on the specification of the hosting server, a single base monitor can support around 150 servers, while data reading and writing overhead remains under control, and the Redgate Monitor UI, the ‘single pane of glass’ through which to view and analyze monitoring data for all servers, remains highly responsive. This means that users Redgate Monitor should be less reliant on ‘bigger hardware’ to help them scale out their SQL Server monitoring and so will help control infrastructure and installation costs for a monitoring installation, even for large estates.
Sometimes more than one base monitor is required, for several reasons. It could be due to complex networks, or security restrictions on opening ports to allow a remote monitoring service access to servers, such as those that host sensitive data. Alternatively, when monitoring cloud-hosted SQL Servers it is often required to host the base monitor service within the same domain, and more efficient to host it within the same availability region, to minimize data transfer costs. To support these cases, Redgate Monitor provides high-performance, distributed monitoring. You can install multiple base monitor stations to collect and process the data, one on each network domain. The monitoring data for each location is still sent to a single, web-based monitoring interface, so that the team retains a single view into what is happening across all servers, wherever they are hosted.
3. Adding any type of SQL Server is easy
Often the true cost of a monitoring tool becomes apparent only when you need to add scale out, which will often include adding SQL Servers hosted on a new platform. At this point, some commercial tools confront users with a different, more expensive, licensing model, or the need to install different portals or services to add SQL Servers running on different platforms.
Redgate Monitor works with a single, consistent licensing model, regardless of platform, network, location, or type of SQL Server. It supports SQL Server versions 2012 through to 2019 and provides a single interface from which to add all the different types of monitored servers. This includes instances installed locally on traditional hardware or VMWare, IaaS managed instances, including failover clusters and Availability Groups, in Azure or Amazon EC2 machines, to “PaaS” SQL Servers, such as Azure SQL Databases and elastic pools, or Amazon RDS instances.
Any special requirements or recommendations for installation of the base monitor service, for a particular platform, are set out clearly in the documentation. Beyond that, simply go to the Configuration page of Redgate Monitor web interface, where you can either add SQL Server instances individually, using the various +Add SQL Server buttons, or bulk import a set of SQL Servers, on a given network, from a tab-separated text file.
4. One Web UI for monitoring all SQL Servers
If you’re a small team who must monitor a large estate, you need a monitoring tool that provides single, easy-to-digest picture of activity and any issues, across all your monitored servers. Conversely, if you’ve ever had keep swapping between different portals, to review monitoring data for each different part of your database system, then you’ll know that this approach does not scale well. You will start ‘missing’ important changes and alerts, at least until a problem escalates and affects your users.
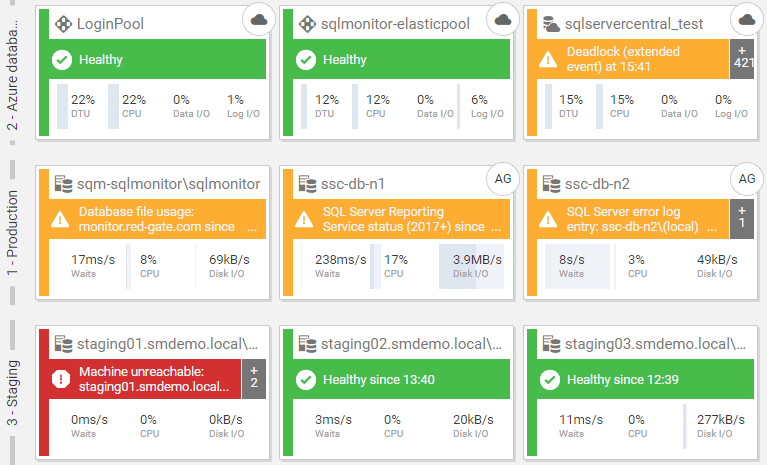
Redgate Monitor provides a uniform way to add any type of SQL Server (see 3), and all its monitoring data is reported, analyzed, and presented in consistent way, in a single web UI, regardless of where the SQL Server is installed or hosted. There is no need to switch to a separate ‘portal’ or ‘cloud view’ to see your Azure- or Amazon-hosted instances, for example. Redgate Monitor’s Global Dashboard provide this ‘single pane of glass’, where all types of monitored SQL Server appear side-by-side:

Each colored tile shows a monitored SQL Server, with the “type” of SQL Server (instance, clustered instance, Azure SQL Database, Amazon RDS instance, and so on) indicated with an icon in the top right of the tile.
It displays servers by Group, and a traffic-light color-coding system helps you spot issues, easily, as they happen in real time. If an issue arises on one of your instances that might compromise data integrity (such as a corruption issue), availability (e.g. an Availability Group isn’t sync’ing), or recoverability (e.g. failed backup job), you’ll know about it instantly because Redgate Monitor will raise a high-level alert and that instance’s tile will turn red. If important but non-critical warnings arise, the instance will be colored amber. Completely healthy servers will be green. This makes it much easier to prioritize your responses.
You can filter this view by alert severity or by Group. For example, you might filter to show only the SQL Servers that store private or sensitive data (the “PII” group). Even medium level alerts, such as the Page verification or Job Failing alerts, will require immediate attention, for this group.
5. Cross-platform and per-platform metrics and alerts
Redgate Monitor’s built-in diagnostic data includes both cross-platform and per-platform metrics and alerts. The former provides a unified picture of the health, performance characteristics, and security, across all servers, and the latter identify when platform-specific constraints are causing bottlenecks.
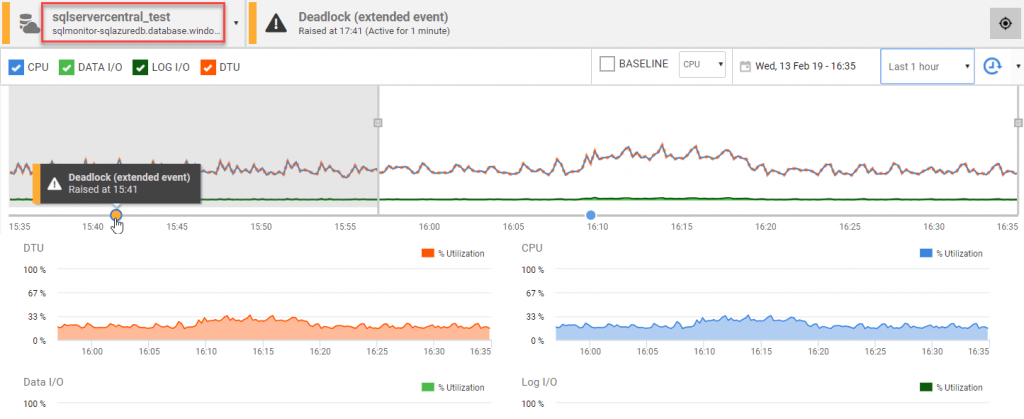
Redgate Monitor presents all this data in a familiar and consistent way, regardless of server type. When you review activity on a SQL Server, Redgate Monitor merely shifts the emphasis, per platform, to those metrics that matter most to the performance and stability of SQL Server. For example, cloud-hosted platforms place unique “compute constraints” on the resources available to SQL Server, and so Redgate Monitor’s data reflects that.
The following screenshot shows the Overviews screen for an Azure SQL Database. In place of the CPU, IO, Memory and Waits snapshot graphs that you see on the a ‘normal’ SQL Server instance, we see a DTU utilization metric, alongside CPU, and then the data I/O and log I/O utilization metrics for the database. When an Azure SQL database reaches its maximum DTU quota, you’ll see severe query performance problems, with queries getting queued and so it’s vital that Redgate Monitor tracks use of these resources and show you quickly whether data I/O or log I/O is the constraint. It also provides built-in and configurable alerts on these metrics.

Similarly, Redgate Monitor collects bespoke metrics for Amazon-hosted, or VMware-hosted SQL Servers.
6. Efficient Grouping and Automation
No SQL Server monitoring strategy will scale well if it must be applied server by server, and instance by instance, depending on the requirements. Instead, it requires logical grouping of servers and automation.
To make it as easy as possible to define and apply the right monitoring and alerting strategy, Redgate Monitor encourages you to categorize your servers into Groups that share similar properties and monitoring requirements. For example, you might have common requirements for production servers, staging or development servers, or you might group according to the tier-level of support required by the business, or to reflect your organization’s data classification and protection policies.
From Configuration | Monitored-Servers, you can drag and drop existing servers into groups, or you can add servers to each group manually. You can then define your monitoring and alerting strategy to suit the requirements of each group, and use Redgate Monitor’s PowerShell API to perform bulk configuration of alert settings, and alert notifications, per group. Any changes to the settings for certain alert types, for the Production group, say, would apply to all machines, instances, and databases in that group.
Redgate Monitor also organizes the monitoring and alert data by these groups, when it’s displayed in the Global Overview and Alert Inbox, so that you can quickly filter the various views and summaries of metric data, and the alerts, by group.
7. Easily controlled alerts
Many monitoring systems break down when so many alerts are sent that the recipients are overwhelmed by them. Once that happens, the alerts tend to be quietly ignored. It’s important to manage alerts carefully, especially as the number of monitored server and therefore volume of alerts, grows. Redgate Monitor alerting is designed to be manageable by a small team, even at scale, the aim being that the alerts make “just enough noise”. that the right person or team is made aware of the issue, promptly, and can then decide how to act using just the diagnostic information provided with the alert. Integration via SNMP into tools such as Slack, or via or Webhooks into service desk applications like or ServiceNow or Microsoft Teams, makes important issues visible in the right channels, and makes any resulting maintenance work easier to plan and schedule.
Redgate Monitor is pre-configured with 65 alerts, which is fewer than some commercial monitoring tools, but covers all common problems around the availability, recoverability, and performance of your database systems. Start from a manageable set of essential alerts, and then to build in custom alerting, as your understanding of the system, and its current limitations and bottlenecks, improves.
Alert settings and thresholds are highly configurable. As discussed in (6), you can automate alert configuration, and roll out an alerting and notification strategy tailored to each group, of sub-group, of servers. So, for example, perhaps only alerts for the “Tier1 production” sub-group will be sent to DBAs, outside normal working hours. You can also suppress alerts on a schedule, such as during maintenance windows – this filters out unnecessary noise, and allows the monitoring strategy to scale smoothly, to many servers.
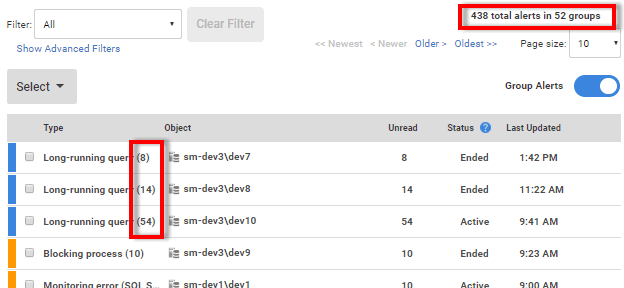
Redgate Monitor’s Alert Inbox groups alerts, automatically, by type. Again, this makes the management of alerts much easier, when expanding the system. The following screen shows the Alert Inbox for a SQL Server instance, where rather than needing to review 438 individual alerts in the inbox, Redgate Monitor has grouped them, so we can see recurrences of the same problem, such as the same long running query, or the same blocking chain.

8. Summaries, aggregations, and projections alongside per-server details
DBAs love deep levels of detail, and with Redgate Monitor you can drill into the detail as far as you want, right down, for example, to the execution statistics, execution plans, and any associated wait events, for individual queries.
However, this must never be at the cost keeping an eye on the whole system. Redgate Monitor also provides estate-wide views and projection graphs that will help managers and DBAs review and optimize SQL Server installed versions, and their licensing, understand trends in disk space usage over the entire estate, review database backup policies in response to SLA changes, and so on.
Whatever the level of detail, Redgate Monitor continues to collect and present the diagnostic data, so the overall monitoring strategy scales, without overwhelming the team with detail, or noise.
9. You know about deployments and other database changes
I’ve often spoken to long-time DBAs who recall fondly the days when they both built and then maintained a small handful of SQL Servers. They would know each of these machines, and the applications that used them, intimately. No-one would be able to change anything without them noticing it quickly. They would know exactly when deployments data loads or other changes were planned. This is impossible when a small team need to look after dozens or even hundreds of SQL Server instances, often spread across multiple data centers, Azure VMs, or Azure SQL Databases. Therefore, you need your monitoring tool to allow you to bridge the familiarity gap.
On the server overview graphs, Redgate Monitor will automatically mark the occurrence of database deployments made by other tools in the SQL Toolbelt, so you’ll see whether these caused any significant changes in behavior or performance.
In Redgate Monitor 10 and later, the PowerShell API also allows you to write scripts that will send ‘messages’ to Redgate Monitor, notifying it of when other deployment occurred, or an important business or maintenance process ran, when a particular application error occurred, when the server was patched, when an ETL operation ran, and so on (see Tagging SQL Server Changes in Redgate Monitor).
Redgate Monitor also provides custom metrics that allow you to monitor unauthorized changes in security membership or permissions in any of your monitored databases, or to detect when a database object is created, deleted, or modified outside of the official change management process.
10. You can answer the “What changed?” question quickly
As the database estate grows, it is more and more important to quickly see if anything changed at around the time an issue was reported. If a user reports that the performance on their application is ‘suddenly really slow’, your monitoring tool must allow you to answer several questions quickly. Is it slower than usual? If so, what if anything changed? Were there any unusual CPU usage patterns, or signs of excessive tempdb usage? Was the number of user connections abnormally high?
To answer these sorts of questions, you’ll need to have been collecting and storing data for a lot of metrics, over time so that you have “baselines” for each metric, or group of metrics, that tell you know what “normal” looks like. It is very difficult to use scripts to do these baseline comparisons to spot unusual trends that need to be investigated, and it becomes impossible to scale out as the number of SQL Servers, and number of metrics, grow.
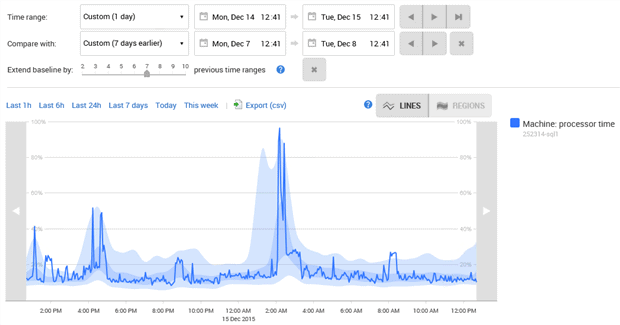
Redgate Monitor collects and stores all the required baseline data, automatically. If you click on any metric snapshot or sparkline, anywhere in the Redgate Monitor UI, it loads it into an Analysis graph, where you can compare the behavior of various metrics over different time periods. These graphs include Compare baseline and Extend Baseline features to detect whether the server was experiencing unusual activity levels, or whether any single resource spike is part of worrying trend, or whether it’s just “normal” behavior for that set of metrics during that period.

Summary
The relative ease with which new cloud-based, containerized, or virtual machine-based SQL Servers can be provisioned means that many estates of database servers are growing quickly. DBAs are increasingly finding that they can only manage their workload with the assistance of automated monitoring of the whole range of instances and databases in their care. One database-monitoring system must fit all and be expandable to monitor a burgeoning estate of databases.
Redgate Monitor has evolved to take on the drudgery of collecting the essential metrics, scanning logs, establishing baselines, and detecting trends, leaving the DBA more time for skilled work. It places very moderate demands on the systems that are monitored, and it can support several base stations to collect and process the data, so it can meet increasing or fluctuating demands for operational work to support a large SQL Server estate.
Tools in this post
Redgate Monitor
Real-time multi-platform performance monitoring, with alerts and diagnostics

