


PostgreSQL Spill to Disk Recommendations in Redgate Monitor
Why is spilling to disk a problem?
Performance, performance, performance. We all want our systems to be fast and reliable, and although "spill to disk" functionality in PostgreSQL is essential to avoid "out of memory" errors, it can, without careful monitoring, introduce persistent performance problems.
Why? Firstly, memory access is much faster than disk access. If a query spills to disk, it takes much longer to execute, leading to slower query performance. Secondly, the resulting increase in disk I/O load puts additional strain on your storage system, potentially causing I/O bottlenecks that will affect other applications or processes. Finally, if your storage capacity is limited then it's possible that large spills can fill up your disks, causing not just query slowdowns but significant service disruptions.
We can't eliminate disk spills entirely, during query processing, but if they occur routinely for certain queries, then this can contribute towards disk I/O operations becoming a bottleneck that throttles database performance and degrades the user experience.
What causes queries to spill to disk?
When PostgreSQL receives a new query, the Query Optimizer devises a query plan, which describes all the operations that it needs to perform, in which order, to run the query and return the requested data. Many query plans will include operators for 'internal' tasks such as sorting data for an ORDER BY clause or to perform a merge join or using a hash table to perform a hash join or aggregation.
In PostgreSQL, there is a specific configuration parameter called work_mem that determines how much memory is allocated to each of these query plan operators. If an operator needs to sort a huge number of rows, or join very large datasets, the memory required to perform the entire operation may exceed the memory allocated to it by work_mem. At this point, PostgreSQL writes data to temporary files on disk to complete the work. This is known as a spill to disk, and for the reasons discussed above it can affect the overall query performance, sometimes dramatically.
PostgreSQL has another configuration parameter, temp_buffers, which sets the maximum amount of memory each database session can use to handle temporary tables during query execution. If your application code relies heavily on the use of temporary tables for calculating intermediate results, then there may be insufficient memory in the temp buffers to support these operations and, again, they will spill to disk, causing performance issues.
Adjusting PostgreSQL's default memory allocations for queries
By default, PostgreSQL configuration is very conservative, setting the value for work_mem at 4MB and temp_buffers at 8MB. Increasing these values, from their default configuration, is something most users will need to do.
However, increase them too far and you risk depleting available memory and causing out-of-memory issues. The goal is to establish values for these configuration parameters that optimize memory allocation based on the workload, without consuming too much of the overall available memory.
The reason for caution is that the work_mem allocation is a static allocation, per operator. As explained in the documentation, complex queries sometime run multiple sort or hash operations in parallel. Each operator will generally be allowed to use as much memory as this value specifies. Also, several running sessions could be running such operations concurrently. This means that although 4MB is set as the maximum value, the actual total memory used by the PostgreSQL instance for these operators could be many times the value of work_mem. Any changes need to be carefully assessed and then monitored.
For temp_buffers, the general recommendation is to increase the default value substantially if your applications rely heavily on the use of temporary tables, but you need to keep in mind that this is non-shared RAM as it is allocated per session.
How memory grants in SQL Server work differently
Where PostgreSQL 'statically' allocates memory to query operators using configuration values, SQL Server's method of granting memory for query execution is more 'dynamic'.
In SQL Server, if a query plan contains 'spill prone' operators, the query optimizer grants memory to the query based on detailed cardinality estimations for each of these operators. The memory grant will change adaptively based on the historical memory usage of the query and on cardinality changes that it detects. If its cardinality estimates are wrong and it underestimates the number of rows, for example due to inaccurate statistics, then the memory grant for the query may be too small and there will be a spill to tempdb files on disk.
The PostgreSQL optimizer performs similar cardinality estimations, of course, but doesn't use these estimations to adaptively grant memory for query processing. If its cardinality estimates are wrong, queries may or may not spill to disk, depending on the generosity of the work_mem configuration. However, even if there is no spill, the underlying problem, such as inaccurate statistics, will still cause inefficient query plans and unnecessary use of resources.
In short, with PostgreSQL we must monitor memory usage patterns and deficiencies in memory allocation very carefully and then adapt the memory configuration and tune queries, as required.
Monitoring and diagnosing disk spills
You can't necessarily eliminate 'disk spills' entirely, during query execution, but you do need to stop them occurring unnecessarily. For each PostgreSQL instance, you will need to make some initial calculation of reasonable values for work_mem and temp_buffers, considering the total available memory, knowledge of the SQL workload and so on. You then need to monitor the performance of each instance closely. You need to be aware when spills to disk occur, and then to have enough context and information so that you can pinpoint the root cause and fix it. There are two elements to this. The first is recognizing those cases where spills are occurring because PostgreSQL memory allocation, using the above parameters, is simply insufficient to support the required workload. The second, and much more common, is the need to diagnose cases where the root cause of the spills is not under-provisioning of memory but poorly written queries, ill-chosen or missing indexes, inaccurate statistics, or sometimes all three. All these issues can cause queries to use available memory inefficiently, leading to unnecessary disk IO and spills to disk, which degrade query performance and use up disk space.
Finally, you need to monitor these issues alongside tracking of memory-related configuration values and establish 'baselines' for memory use by your queries. In this way you'll know if new instances are added with inappropriate configurations, or if the memory requirement of existing queries changes substantially due to increasing data volumes.
The following section demonstrates how Redgate Monitor warns you when spills occur and the information and recommendations it provides to pinpoint the cause. We'll cover configuration tracking and baselines in a separate article.
Redgate Monitor query warnings and recommendations for spills to disk
Redgate Monitor identifies queries in a query plan that have spilled to disk, by checking the sort space used metric. This metric measures the amount of memory or disk space used by the database system to perform sorting operations during query execution. Given that we only care about the disk usage, we check this amount only for disk-based sorting.
When Redgate Monitor detects a problem with a query, such as a spill to disk, it highlights it with a lightbulb icon in the Top Queries section of the PostgreSQL Instance Overview page and provides recommendations to prevent recurrence. In the following example, the Top Queries list is sorted by IO Time (total time spent reading or writing blocks from disk, in milliseconds) and we can see that the first two queries in the list has associated recommendations:
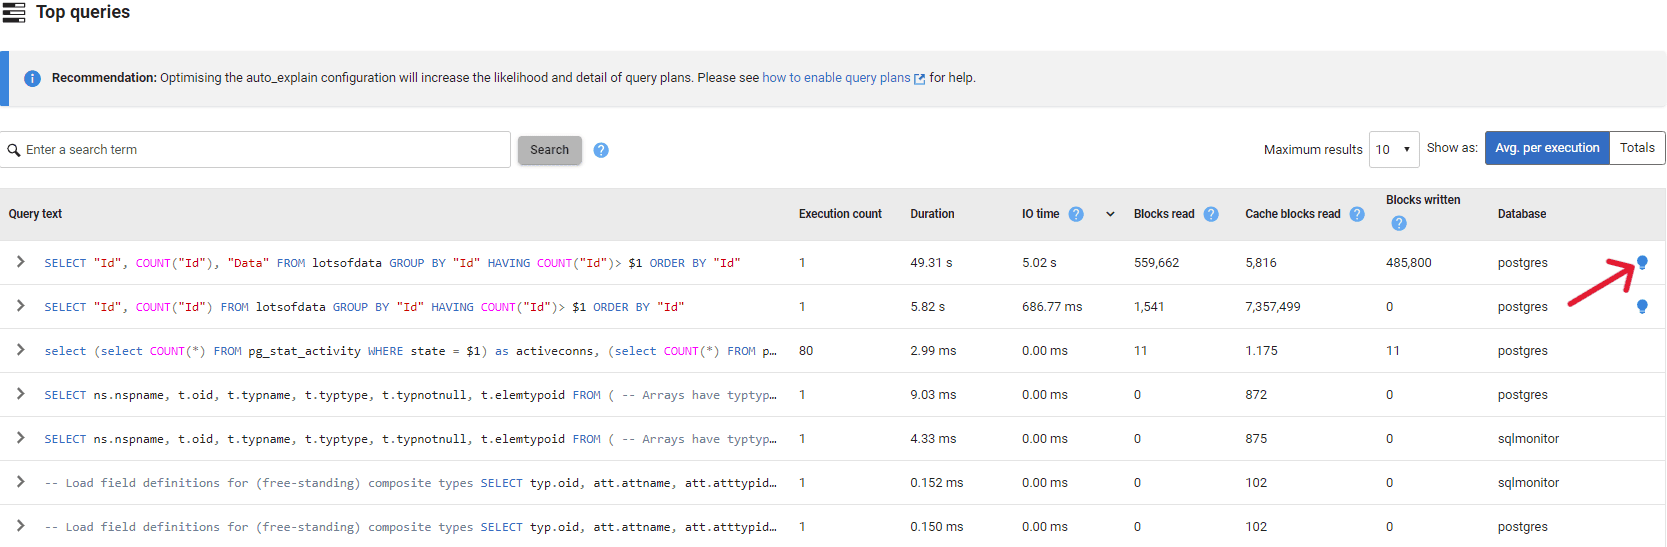
From this list, we'll expand the details of the first query, which took almost 50 seconds to complete, to view the recommendations:
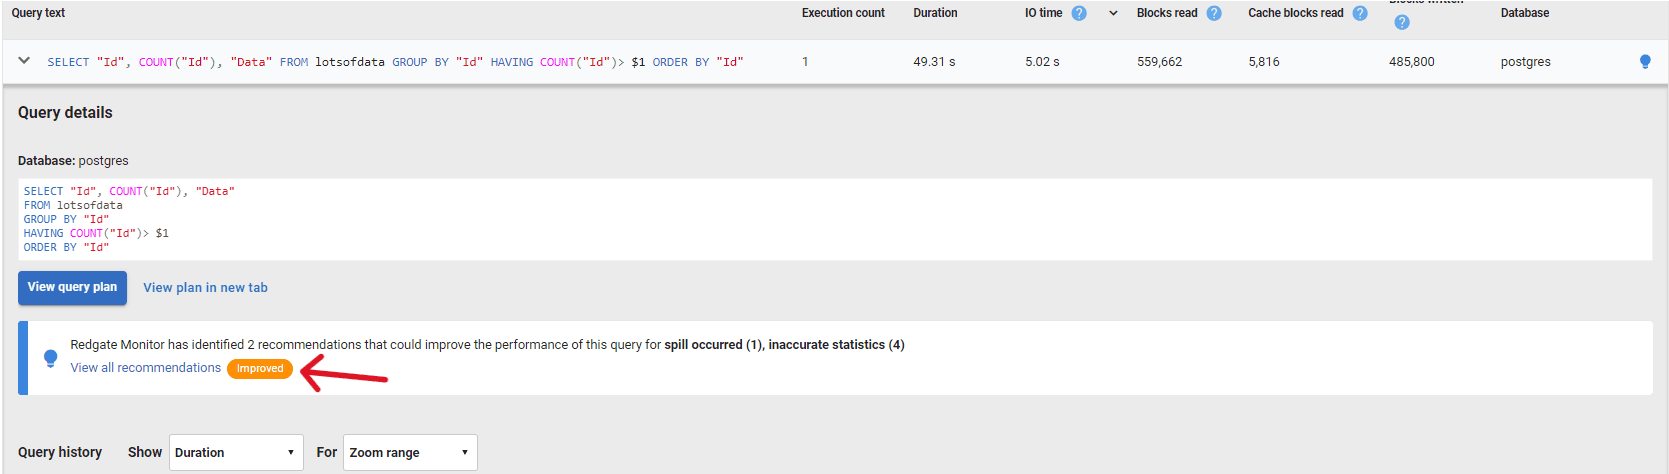
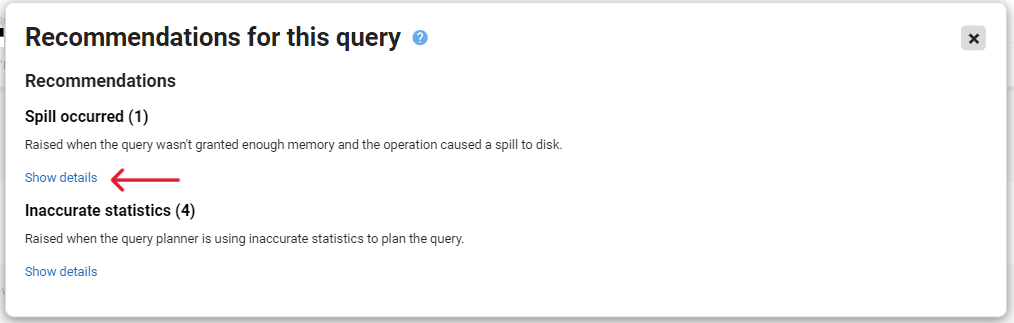
Once in the recommendation view, you'll see the list of recommendations for that query. For this query there are two recommendations, one related to a spill to disk warning and another regarding inaccurate statistics:
From there we can review the full details of the recommendations.
Reviewing details of the spill
As part of the recommendation for a sort spill, Redgate Monitor displays the memory configuration values for work_mem and temp_buffers, discussed previously, plus the following metrics:
- Sort space used on disk– indicates that a spill occurred and shows the amount of disk space used by the sort operations.
- Total data read from disk and Total data written to disk – indicate the total volume of data spilled to disk for the query, so will include disk resources used to support operations performed by other nodes. Redgate Monitor has multiplied these "total data" metric values by the
block_sizeand so displays total size of data in GB
These configuration and metric values, considered together for any parts of the workload that spill to disk, will help you assess whether the memory configuration could be too low, or you need to optimize the query:
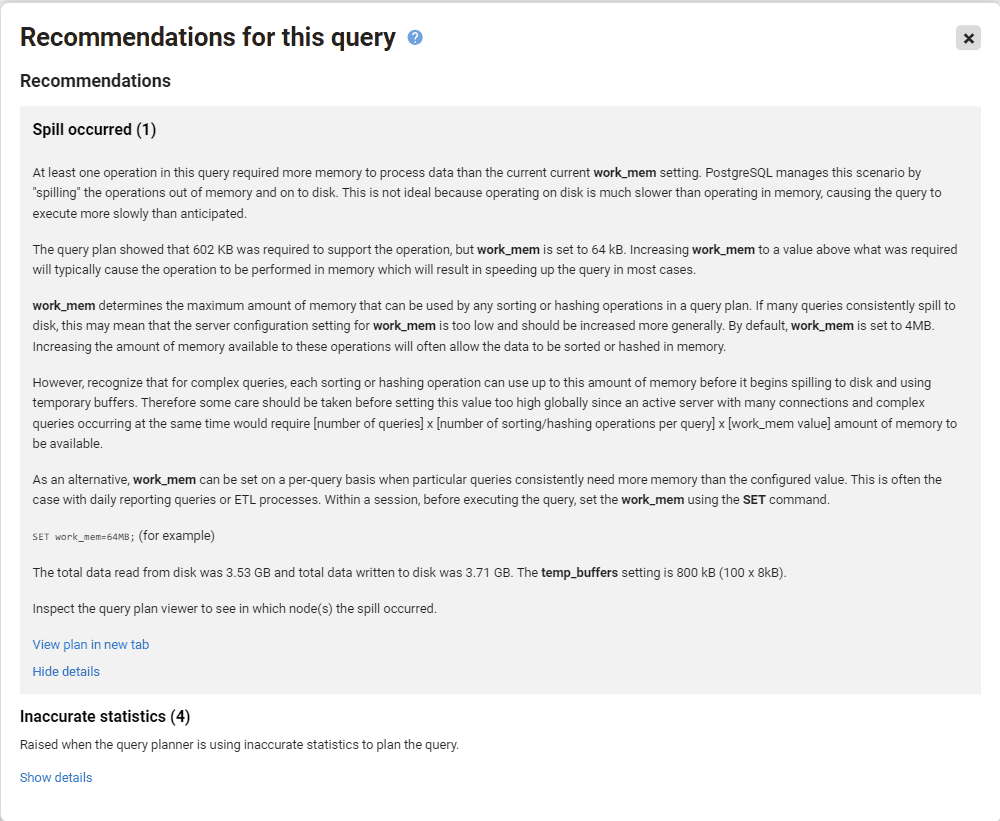
On this instance work_mem is set to 64 KB, and in this example, the query plan showed that 602 KB sort space on disk was required to support the Sort operation. The total amount of data that had to be written to or read from disk during the query execution process was approximately 3.5 GB.
Knowing these values and comparing them to the current instance configuration values will provide you with the insights necessary to understand if your configuration settings are correct. It's important, however, not to increase memory configuration settings significantly, based on the evidence of a single query. In cases like this where you see a large sort-spill, perhaps much bigger than anticipated given the current memory configuration, then you need to analyze the spill in the context of the query plan to understand why the spill was so large, and investigate opportunities for query optimization.
Diagnosing the spill in the query plan
The query plan shows spill to disk in the context of every operation performed in th query plan. In our example, the Sort operator spilled, and we see the Spill occurred warning in the right-hand pane of the plan, along with the other warning for Inaccurate Statistics. Each operator will display its own recommendations, and, in this example, several other operators have recommendations too (for Inaccurate Statistics).
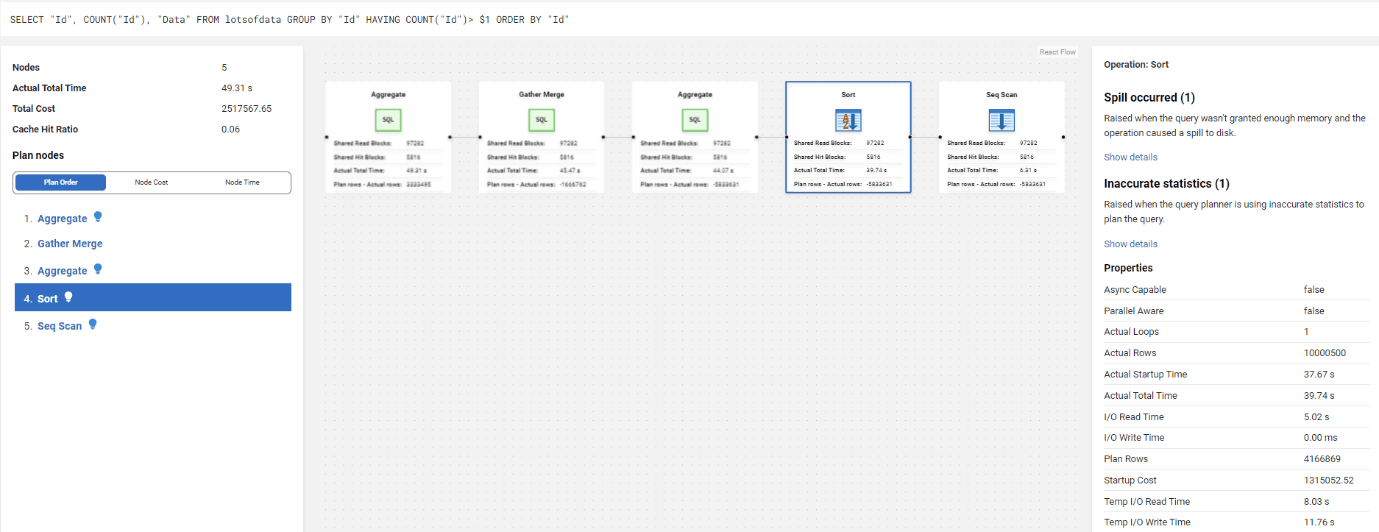
In this example, it's clear that the scan of the "lotsofdata" table returned far more rows than the optimizer estimated so the subsequent sort of that data spilled to disk. We'd need to find out why the statistics it had available were so inaccurate and take steps to fix this. This might also involve tuning the query, to minimize the need for disk-based operations, or improving indexing strategies to optimize the query executions.
Conclusion
Spills to disk can happen for many different reasons. In PostgreSQL, the default memory configuration is too shallow. Any query could potentially trigger an unnecessary spill to disk if this configuration is not updated. It is for this reason that the first step that Redgate Monitor took towards improving the user experience is to identify and highlight the metrics around the memory configuration and to display them in a way that will help the user tweak the configuration.
When a query spills to disk, Redgate Monitor will mark the query, in the Top Queries list, with a recommendation. The memory configuration values, and spill diagnostics provided in this recommendation, along with the details of the query plan itself, will help you evaluate the best course of action, whether it's to adjust the memory configuration values, fix out of date statistics, tune the query, or improve indexes.
This document contains proprietary information and is protected by copyright law.
Copyright © 2026 Red Gate Software Limited. All rights reserved
Tools in this post
Redgate Monitor
Real-time multi-platform performance monitoring, with alerts and diagnostics
You may also like

Article
How to monitor the impact of patching on SQL Server performance
This article uses the Spectre/Meltdown bugs as means to demonstrate how you can use a tool like Redgate Monitor to assess the impact of patching on the throughput and performance of your SQL Servers.
Article
Migrating Between Monitoring Systems
This question comes up all the time: How do you migrate between monitoring systems? The answer is both simple and complicated. In order to understand this better, rather than just rely on my own knowledge, I reached out to a number of people to see how they accomplished this. I’m going to summarize their process for you here in order to help others who may find themselves in need of this information. Don’t Migrate The Data One of the first things I would have thought about when someone says the word “migrate” would be the need to move the data
Article
Introduction to Analyzing Waits using Redgate Monitor
Phil Factor sets out with the modest aim of giving you enough of an introduction to waits to better understand the wait information you get from a SQL Server monitoring tool like Redgate Monitor, and the rather overwhelming amount of information available in the underlying DMVs and Extended Events.
Article
Checking on Failed Server Logins, Server Errors and Warnings using Redgate Monitor
Provides a PowerShell monitoring script for errors, warnings and critical events on the Windows server hosting your SQL Server instance, including the failed server login attempts that would accompany a brute-force password attack.

Webinar
Key Signs Your Business Needs a Database Monitoring Tool
Join Redgate's database monitoring experts, Anderson Rangel and Steve Jones, as they discuss the telltale signs indicating the need for a dedicated database monitoring solution.
Article
Monitoring SQL Server Performance: What's Required?
A monitoring tool must provide us with an understanding of the often-complex performance patterns that databases exhibit when under load, so that we can predict how they will cope with expansion or increase in scale. It must also helps us spot the symptoms of stress and act before they become problems that affect the service, and understand better what was happening within a database when an intermittent problem started.
Loading comments...