Why is my SQL Server Query Suddenly Slow?
A SQL Server query is suddenly running slowly, for no obvious reason. Grant Fritchey shares a 5-point plan to help you track down the cause and fix the problem.
Sometimes performance problems sneak into SQL Server after a software release that involves database schema or code changes, or after SQL Server is upgraded to a new version or patched. Other times, SQL queries suddenly start performing poorly for no apparent reason at all.
I’m sure we’ve all experienced this situation: your system is humming along, and you’ve tuned queries, updated statistics, added indexes, and done all the good things to ensure that it continues to hum along. Suddenly, however, you get a phone call or instant message or text or an alert, possibly all four at once, telling you that an application process is “running slow”, and what the heck is going on?
Your job is to fix things quickly, but you don’t even know what happened. How do you deal with this sudden change in performance? Here’s one way to track down the cause of the problem:
- Find out the most expensive queries running in SQL Server, over the period of slowdown
- Review the query plan and query execution statistics and wait types for the slowest query
- Review the Query History over the period where performance changed. Did the execution plan change too?
- Investigate variations in performance metrics and server resource usage over the periods of “normal” and “bad” performance, and work out what changed and why
- Diagnosis and query tuning
I’ll show you how to implement this plan in Redgate Monitor.
1. What were the most expensive queries running when things were slow?
The first task is to investigate what was happening on the SQL Server over the time the application was running abnormally slowly. Redgate Monitor has raised a “Long running query” alert. To be alerted otherwise, you’d need to capture the diagnostic data manually (e.g. using Extended Events) and then set up associated alert conditions for SQL Agent.
Also, you’d need to have been manually tracking data from various sys.dm_exec_* dynamic management views, such as sys. dm_exec_query_stats or perhaps use Extended Events to set up query tracing. However, Redgate Monitor automatically collects all the data you need. Open Redgate Monitor, navigate to the affected instance and open the Overview screen and examine the interactive activity graph for the period in question. You can see the CPU, Disk IO and waits have all spiked over this period.
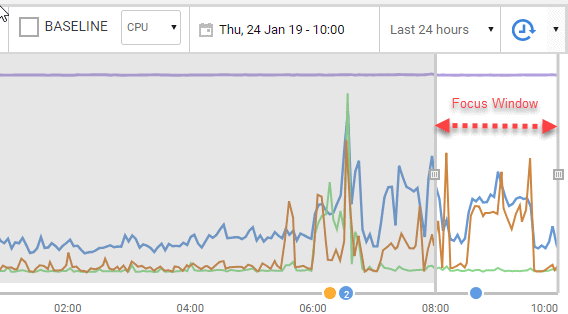
Figure 1.
Scroll further down the Overview screen and scan the list of Top 10 most expensive queries that have run over the period selected in the focus window of the interactive graph. By default, for the recent 24-hour period, this is the last 2 hours, but is adjusted using the grab bars.
In this list Redgate Monitor can show us a lot of details about the general runtime characteristics of for each query. You can see that one query is called far more frequently than any others and that the number of logical reads, per execution, is 93. That seems high to you, since you know that this query only returns a few rows each time. 
Figure 2.
2. Review the query plan and execution details for the slow query
You click on the query to see further details, including the execution plan, any significant wait types associated with the query, and the query execution history. Again, if doing this manually you’d need to query the Dynamic management views and the Query Store, manually, to get all this information.
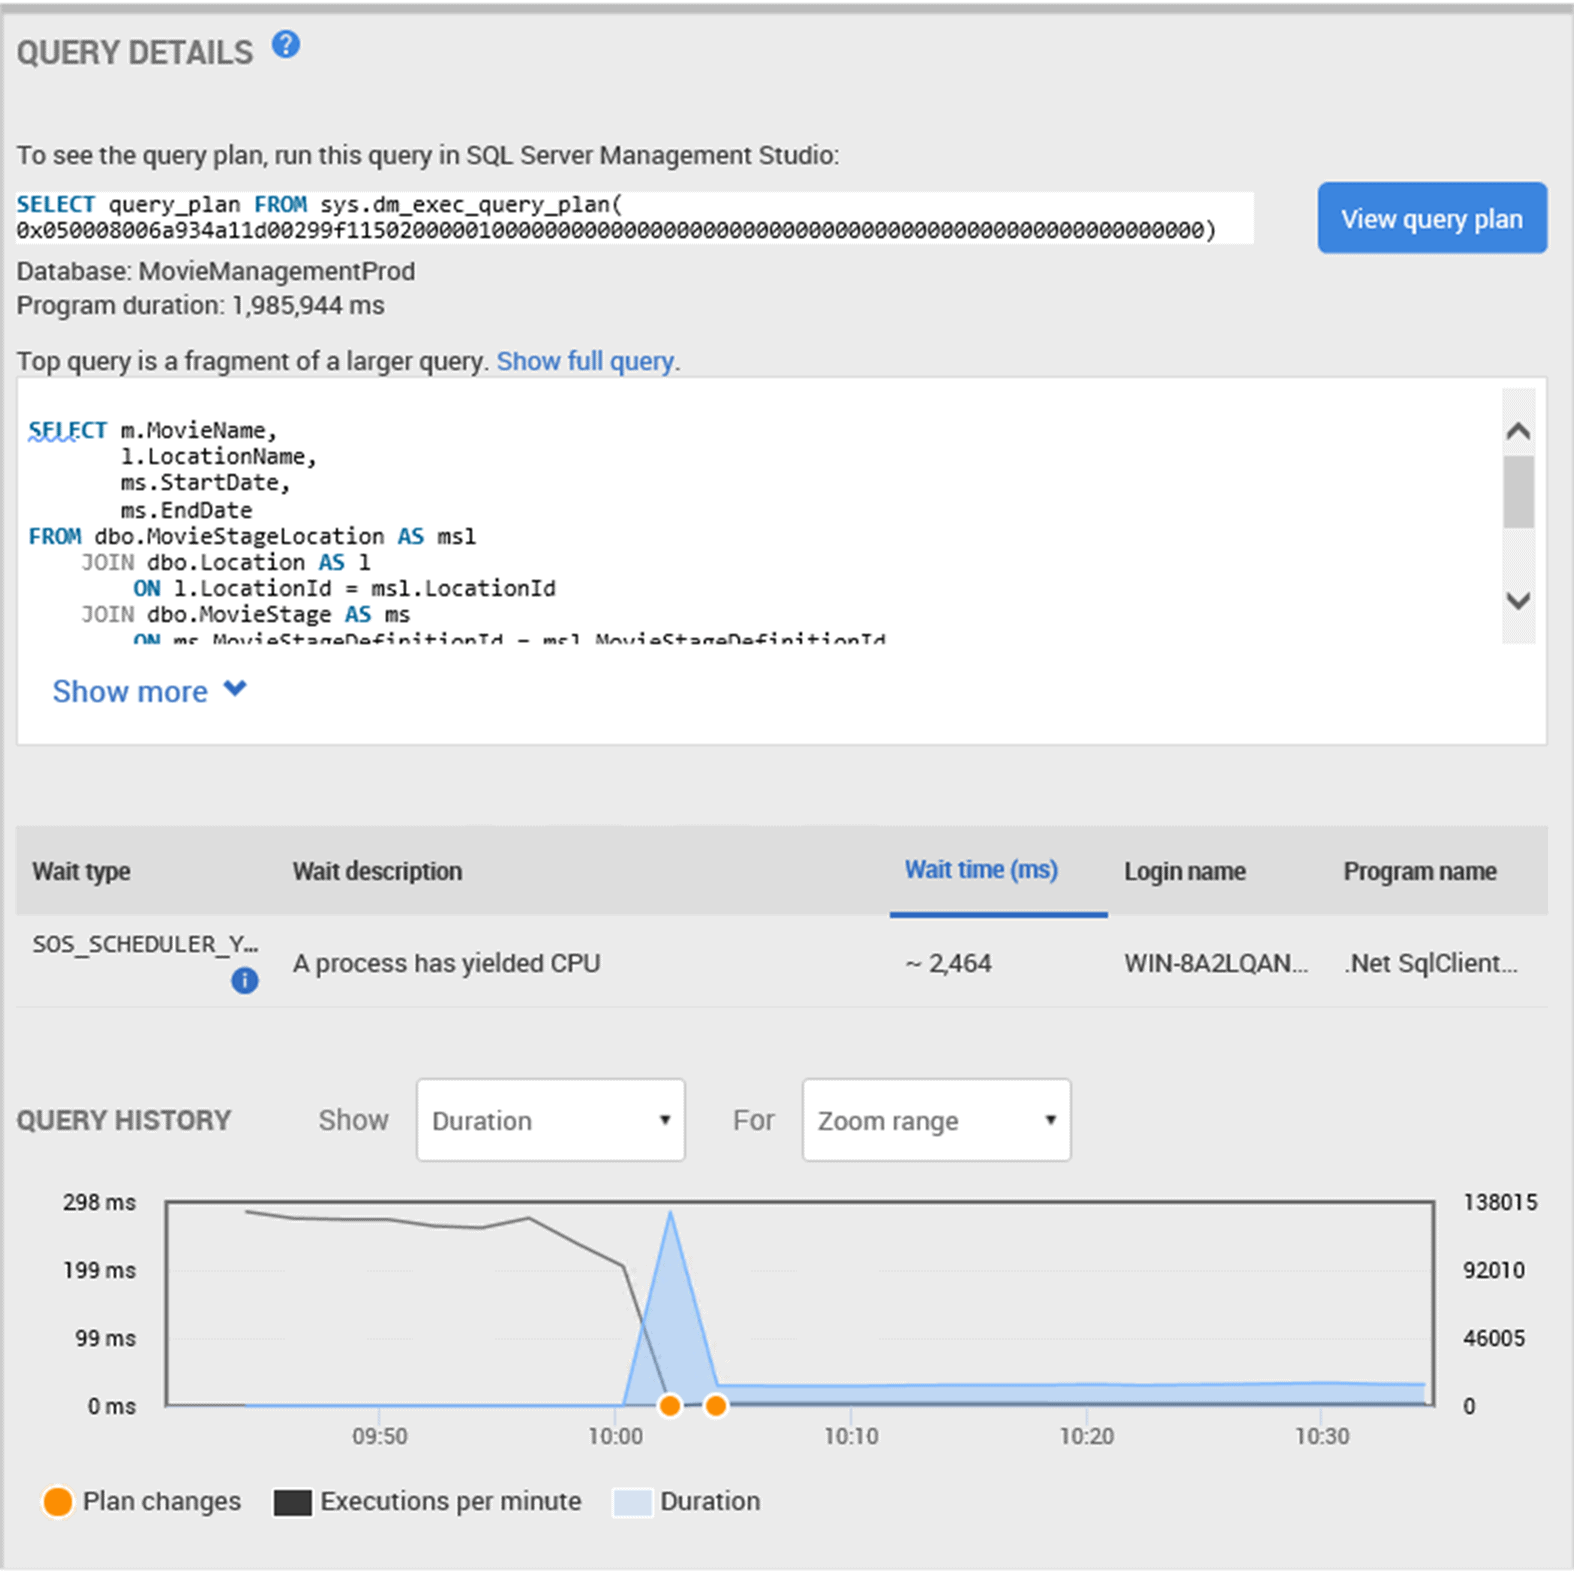
Figure 3.
At the top of Figure 2, Redgate Monitor provides a T-SQL statement to allow you to pull the plan from cache, or the option of simply using View query plan, to see it within Redgate Monitor. Directly below we see the associated T-SQL Statement. If the query is part of a larger batch, or a statement within a stored procedure, the Show full query button will reveal the full batch or procedure definition, which is incredibly handy when you’re trying to identify where a query originated.
Next, we show the top wait types associated with the query. This only wait type we can see is one associated with on the CPU. This doesn’t indicate a problem, necessarily, but it does mean that the query needs CPU resources and is often waiting to get them.
Finally, we have a history of the performance and behavior of the query over a given time frame, and this section is very interesting. You can see that the number of executions per minute has plummeted over the defined period. By contrast, the duration spiked from “zero” (or very low) to around 300ms, and then back down to a higher, by steady execution time of 30ms. There have also been changes in execution plan over the same time.
These metrics are captured from the Dynamic Management Views (DMVs) such as sys.dm_exec_query_stats. Redgate Monitor maintains the data over time, and you can control the behavior using the drop downs.
3. Review the Query History
At around 10 AM, the number of executions of this query, per minute, has fallen from somewhere in the range of 100,000 every minute to something much less. We can get the exact details by hovering the mouse over the dark line representing executions per minute, to get a pop-up detailing the information captured:
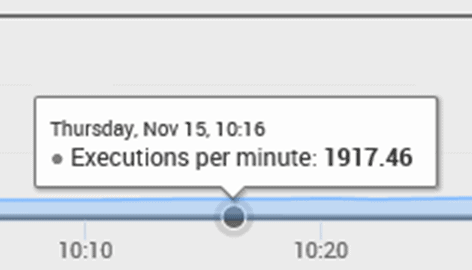
Figure 4.
So, instead of 100,000 executions a minute, we’re only getting about 2,000. While the cause might be completely benign, such as an application simply stopped calling the procedure, it might alternatively be the problem that explains why your boss and the CTO just showed up in your cube. Let’s gather some more metrics so we can give them the story.
We can hover over the Duration line, at a time shortly before and shortly after the change in behavior. Before, we see an average duration of 0.05ms, and once the massive spike up to 298 ms has subsided, the query settled out at a consistently longer duration of about 30 ms:

Figure 5.
This large bump up in average duration seems to be a very likely cause of the number of completed executions per minute plummeting. So, let’s examine the execution plan changes that occurred around that time, indicted by the orange Plan changes circles in the graph.

Figure 6.
We can click right on each of the plan changes to see what plan was implemented at each point. If we choose the second of the two, we’ll see the plan currently in use (which you could confirm by selecting View Query Plan in Figure 3).
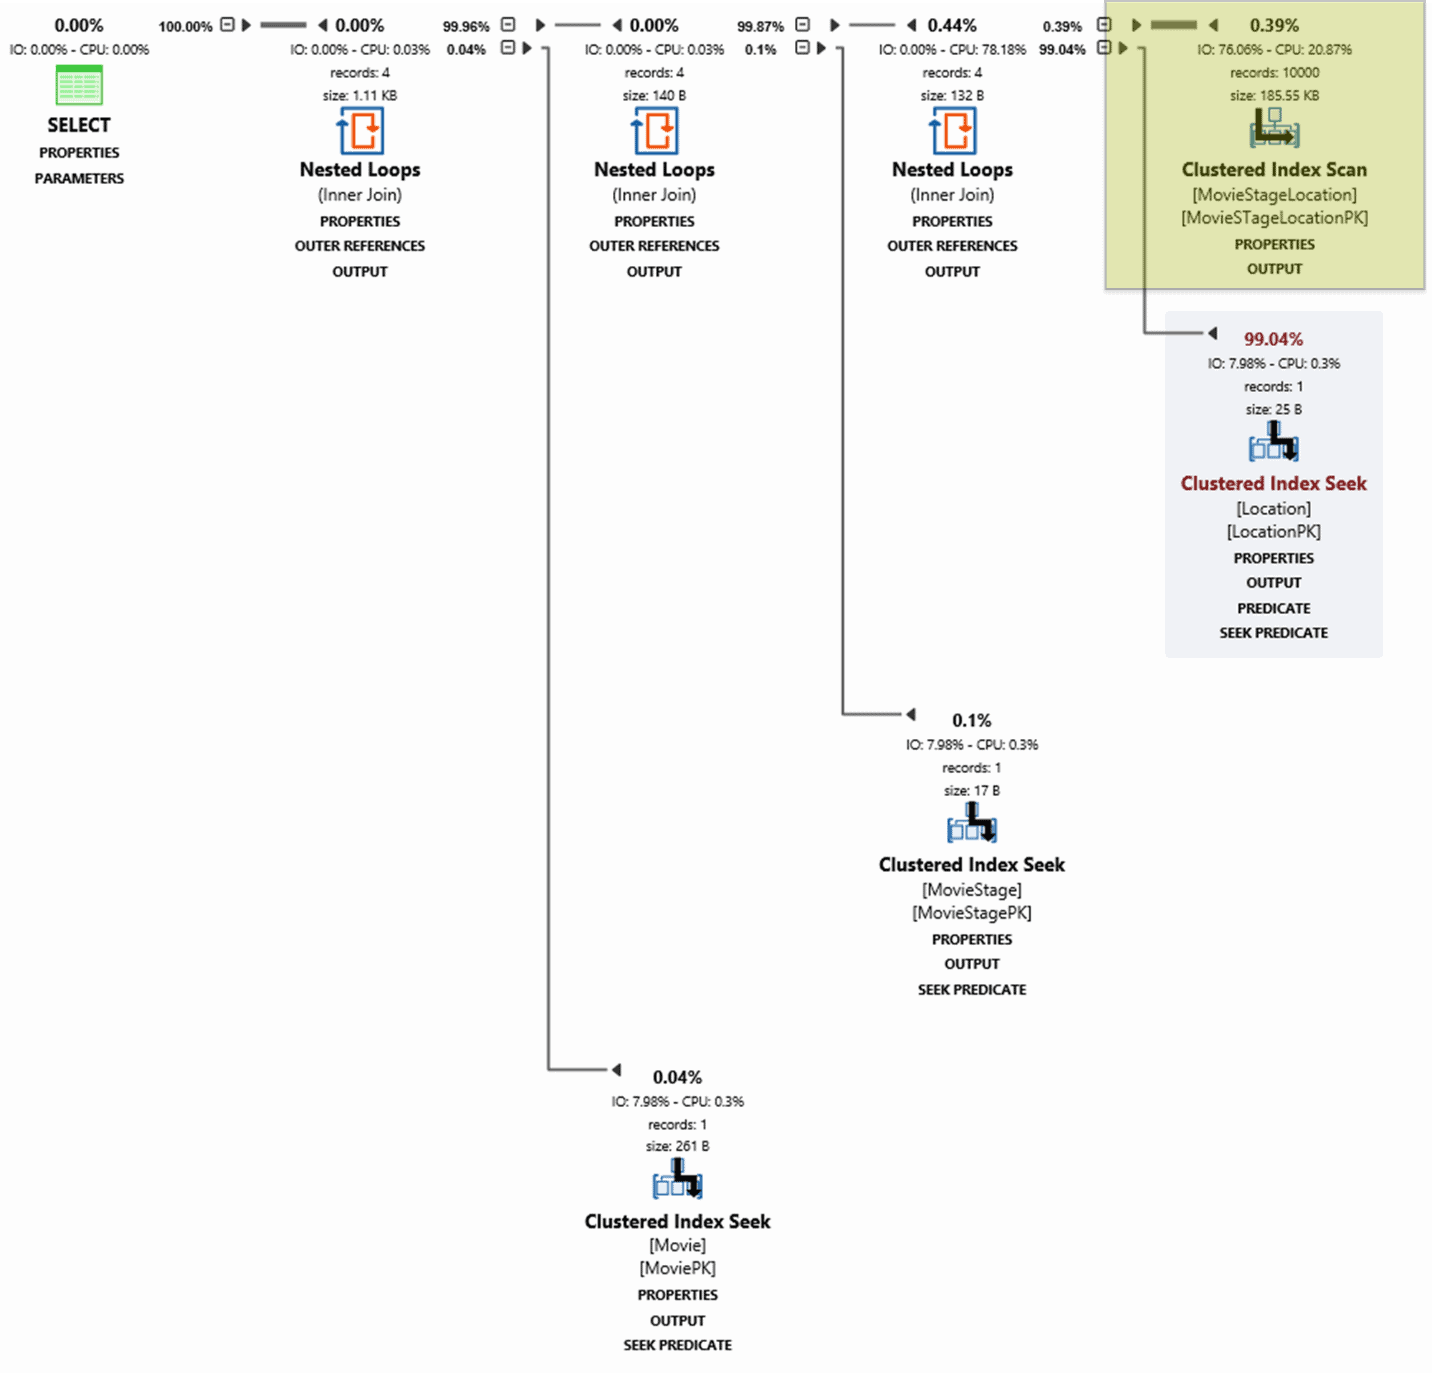
Figure 7.
Here the optimizer has chosen to scan the clustered index on the MovieStageLocation table, reading all 10K rows, looking for those with the requested LocationName. For each row it finds, it performs a seek of the clustered index on the Location table for matching rows. All the other tables are accessed with index seeks, and you’re suspicious of the scan on MovieStageLocation, since you know it only returns a small number of rows.
At this point, we want to confirm that the behavior we’re seeing in the immediate run up to the plan change is, indeed, representative of the “normal” behavior on our system. To do this we’ll need to compare the current behavior to a couple of previous periods over which the query was running normally.
4. Investigate what changed over the periods of good and bad performance
Generally, if someone had alerts you performance is slower than normal, you’d first want to confirm that this was true, by comparing the server activity over the period of slow performance to the “normal” behavior you expect to see. One way to do this is to use Redgate Monitor’s baselines, which allows us to compare resource use, activity and behavior for the current period with, for example, the same period yesterday, or the same period for each of the previous 7 days. This is especially useful if you’ve identified that the problem occurs during the scheduled execution of a job, or report. However, baselines only cover database and server metrics, not query metrics.
So, instead, we’re going to use Redgate Monitor’s “back in time” feature to compare query activity over the period of slow performance to a similar period, where the query is being called as usual, but performance is “normal”.
Since the data collected by Redgate Monitor is displayed through a web page, we can easily open more than one page. We already have a page open displaying activity over the slow period, so we simply open another page with a connection to the same SQL Server instance, go to the same Overview page, and at the top right of th activity graph, we find the rewind time feature, which allows us to display activity for previous periods of time.

Figure 8.
Clicking the date and time, I can select a point in time in the past when I know things were working correctly. Now, when I went home last night, everything was working fine. So, I’m going to select 17:00 on the preceding day:

Figure 9.
You can also display the period of data in which you’re in. I’m currently drilled down to show only a one-hour period, but you can easily broaden this out to see a les granular view of activity:
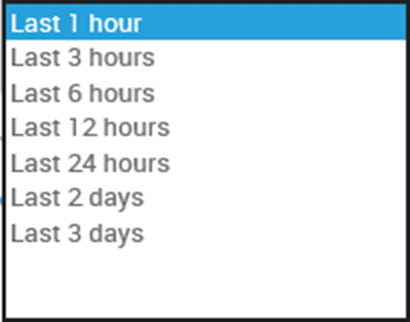
Figure 10.
Those are just the defaults. You can also adjust the range manually.
When you drill down on the queries, you can see that our currently-misbehaving query is also top of the Top 10 queries list, and in fact is called even more frequently over this period than the “slow period” shown in Figure 1. However, the number of logical reads per execution is only 7, compared to the 93 we saw before.

Figure 11.
Clicking on the query, we see the same query details screen that we saw earlier, in Figure 3.
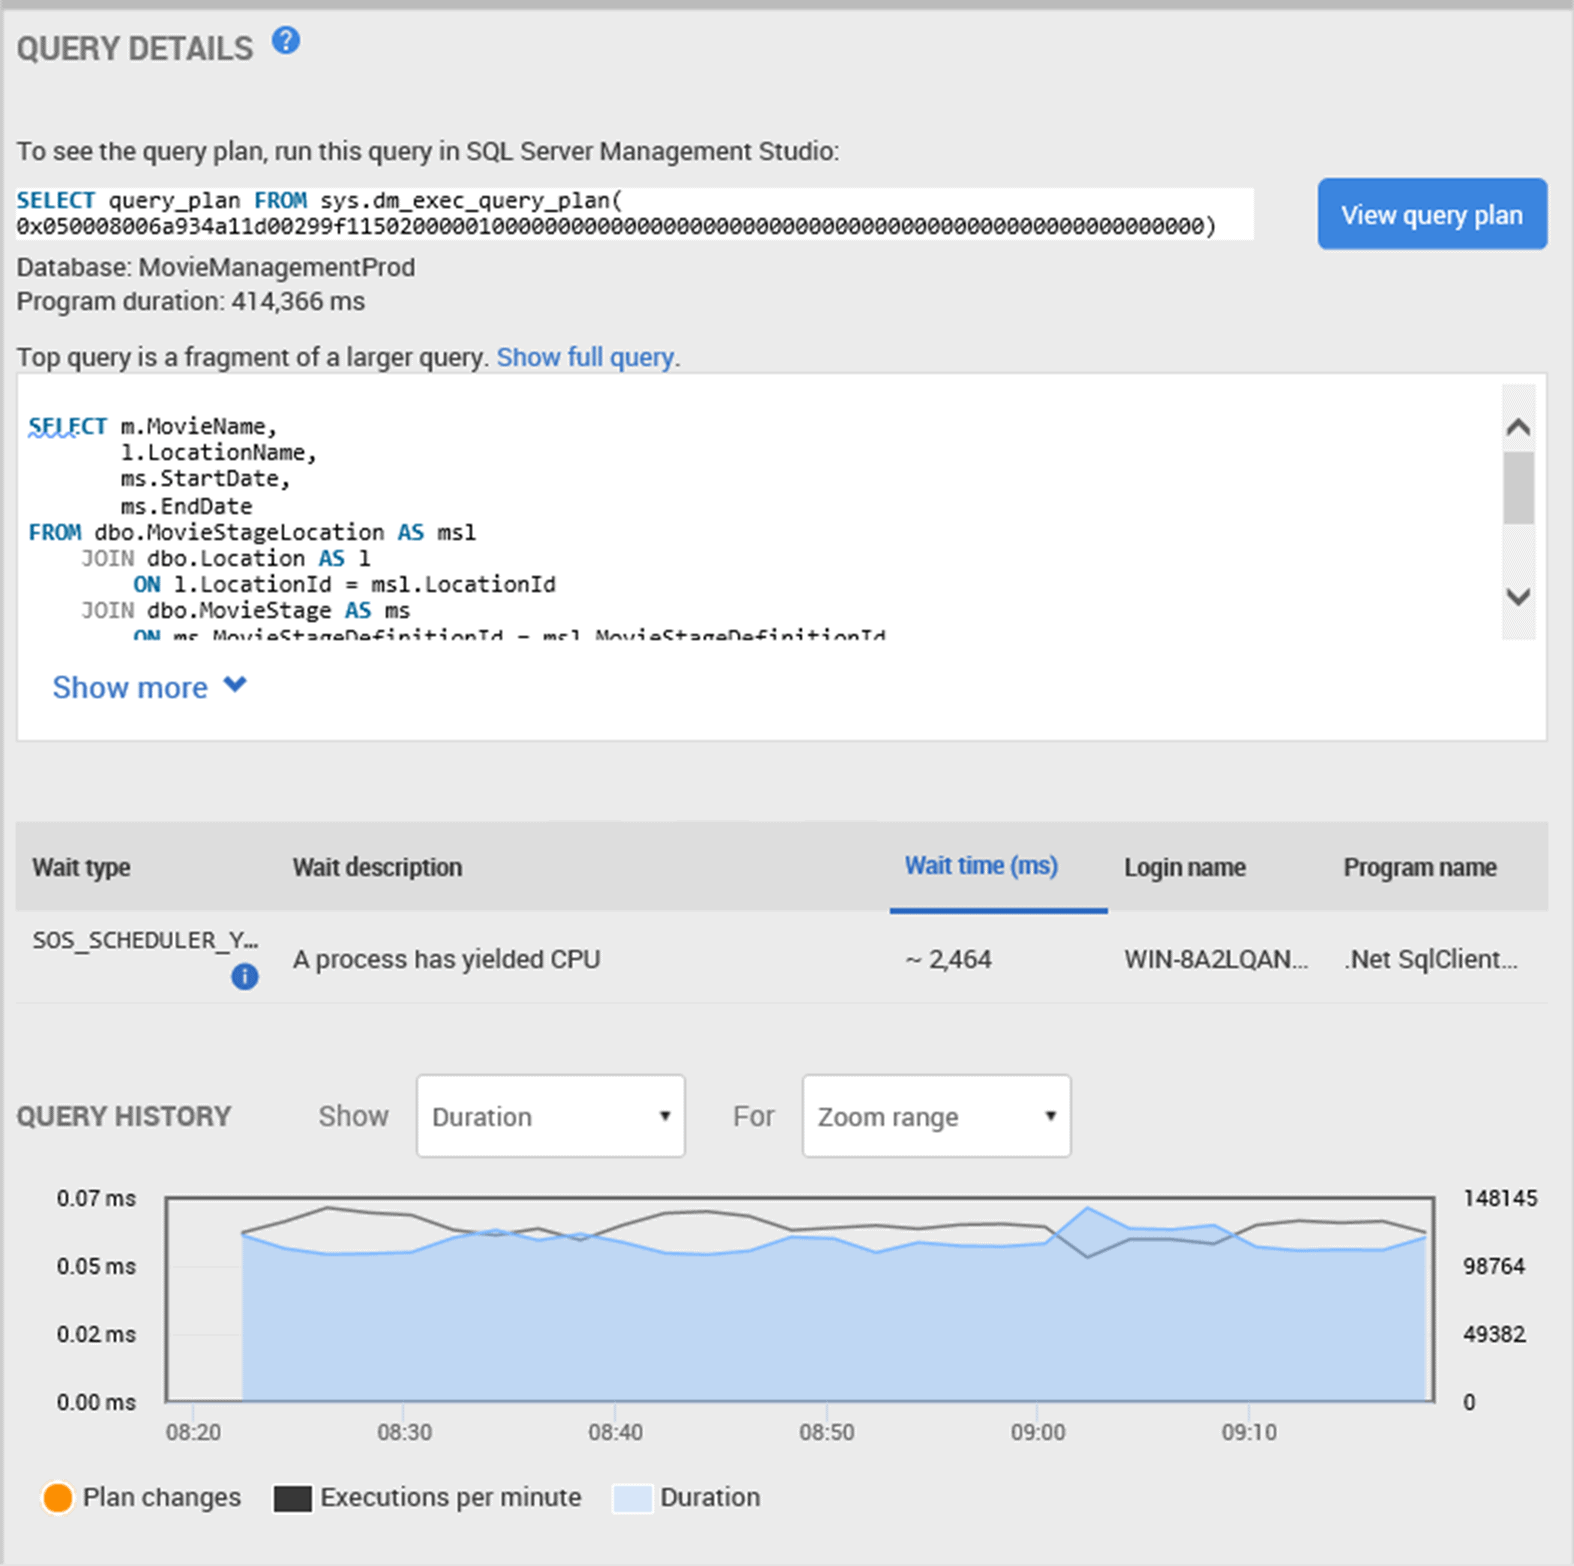
Figure 12.
The only wait type displayed is, again, the SOS_SCHEDULER_YIELD wait, associated with yielding of the processor by a process, then waits to get back on it, and is no cause of concern in this case.
In the query history section, we can see that the query performance and behavior has been consistent over this period, with the query generally running in just a little over 0.05ms, which tallies with what we saw earlier, in the period immediately preceding the plan change.
You click on View Query Plan, and you see a similar plan except that the Clustered Index Scan, which I highlighted in Figure 7, is gone. In this plan the optimizer is still performing a seek operation, to retrieve rows from the Location table, but is now is using a non-clustered index. For each row it finds, it performs a seek of the MovieStageLocation clustered index for matching rows.
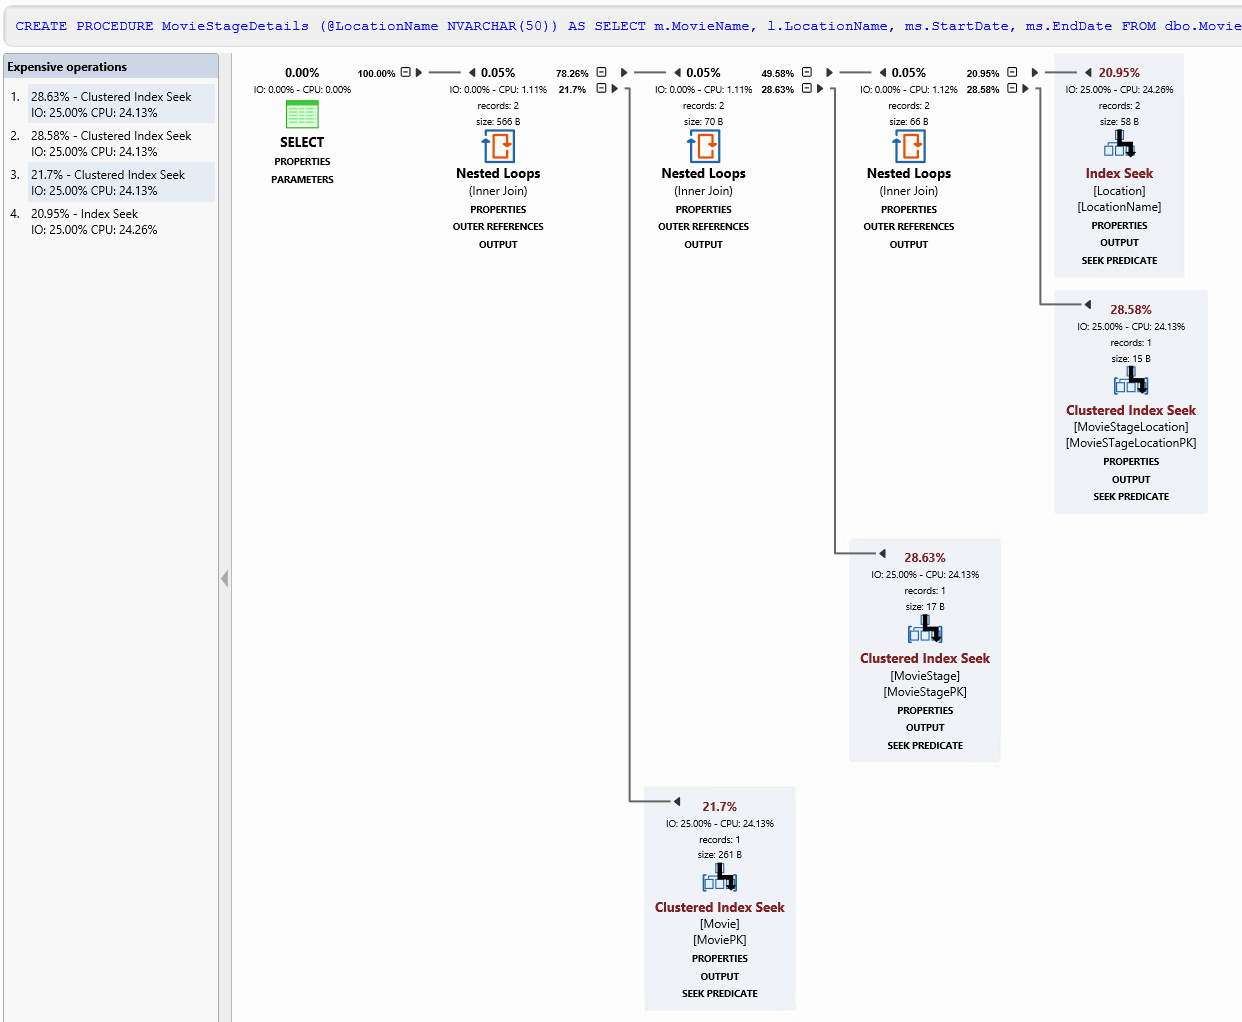
Figure 7.
We are starting to piece together a full picture of what seems to have happened. At this time, and in the period leading up to 10AM the next day, we had an efficient plan. The query returns only a small number of rows from each of the tables and is using the available indexes to perform seek operations. The optimizer combines the various inputs using Nested Loops joins, which are the most efficient join types when combining two small data sets.
Suddenly, the plan changes, and the optimizer is scanning all the rows in the MovieStageLocation table every time the query is called, and it is called very frequently, as we’ve seen. So, this would seem to explain why, after the plan change, the SQL Server is performing far more logical reads to return the required data, the query is running much slower, and the number of executions per minute plummets.
5. Diagnosis and Tuning
With the information in hand, we can now confidently state that “normally” we see around 100,000 executions of this query per minute, and it runs in about 0.05ms. The reason we’re now getting 2000 executions per minute instead is because, in the blink of an eye, the query started running in about to 30ms. The cause is a sudden change in execution plan, meaning that a 10K-row table is scanned on every execution.
The question is, why has the optimizer suddenly stopped using the non-clustered index? To answer this question, we would need to step outside of Redgate Monitor. It’s possible that statistics or data has changed, meaning that the optimizer no longer views it as the most efficient way to access the data. In fact, when I went to check on the statistics, our most likely culprit, I found that the index itself is missing entirely. Further investigation revealed that a junior DBA dropped the index by accident. Recovering the index from source control and putting through an emergency release, I was able to get the index back in place and performance resumed back on normal.
Conclusion
The root causes of changes to performance can vary wildly. It’s not always going to be as simple, or as catastrophic, as a dropped index. However, the diagnostic process, when SQL Server query performance suddenly degrades for no apparent reason, is always going to be roughly the same:
- Examine activity of the period of slow performance
- Compare this to “normal” behavior in the past
- Identify the differences and changes and investigate their possible causes
This simple process should allow you to diagnose a range of different causes, from server settings being changed leading to differences in behavior, to changes in data distribution leading to differences in behavior.
Regardless of the root of the problem, Redgate Monitor can help diagnose the cause of sudden changes in query performance, by presenting you with the resource metrics, waits, query execution statistics, execution plans and query history feature, which highlights changes in behavior as the relate to changes in plan.
Original publication: 28 Jan 2019
Tools in this post
Redgate Monitor
Real-time multi-platform performance monitoring, with alerts and diagnostics


