An Overview of PostgreSQL Monitoring in Redgate Monitor
An overview of how PostgreSQL monitoring in Redgate Monitor will help you improve performance and reduce downtime in your PostgreSQL instances.
Redgate Monitor fully supports monitoring PostgreSQL, offering rich diagnostics for PostgreSQL alongside SQL Server through a single pane of glass. The aim is a tool that is easy to use, providing a unified view of the health and performance of a mixed data estate, but without compromising on the depth of its diagnostic capabilities for PostgreSQL.
The growing need for PostgreSQL monitoring
Use of PostgreSQL is on the rise. A quarter of DBAs using Redgate Monitor tell us their organizations are adopting it alongside SQL Server for some workloads, and in a great many cases it’s those same DBAs being asked to manage both environments. The last few years have also seen a tipping point. While PostgreSQL has been around for decades, recent momentum has seen even the largest organizations adopting it for critical applications. And with that, monitoring PostgreSQL databases becomes more important.
That doesn’t mean other databases are going anywhere; indeed, the number and size of SQL Server installations continues to grow as fast as ever. What it does mean, however, is that the team responsible for ensuring the availability, integrity, and performance of an organization’s data systems are finding that they also need to monitor PostgreSQL instances, as part of a growing and increasingly complex mixed data environment.
A single global dashboard for all server types
In Redgate Monitor, PostgreSQL instances are managed right alongside SQL Server instances in the same UI, offering a single pane of glass across the entire environment. Here for example, Redgate Monitor’s Global Overview provides an at-a-glance view across a few dozen database servers. Four of the instances highlighted happen to be PostgreSQL, but while they can be pulled out into separate groups if desired, you’re free to treat them just as any other database instance. There’s no separate setup to maintain, and no separate interface to visit; just a single unified view over your data estate.

Consistent treatment of diagnostic information
Those who’ve used Redgate Monitor before will be instantly familiar with its interface. The goal is to provide an approach which feels intuitive and needs no re-learning, so wherever it makes sense you’ll see similar metrics, presented using the same visualizations, and the same approach to interactions and drill-down.

Because the recent rise of PostgreSQL means that many people responsible for its operation are less familiar with its intricacies than with other database platforms, the tool provides detailed in-product assistance, helping to interpret the data you’re looking at and guide you towards potential resolutions.
In-depth diagnostics for query tuning and PostgreSQL performance issues
Redgate Monitor’s PostgreSQL monitoring capabilities aim to provide you with the deep understanding needed to solve complex problems quickly.
That includes visibility into workloads running on those instances, so you can identify which queries are running slowly, or which are responsible for the greatest impact on the environment’s resources. Here for example, we can see the queries that are performing the most IO operations, and can then drill down to look at the history of that query’s performance over time across a number of dimensions, letting us understand whether the behavior we’re seeing is unusual.

It also offers deeper capabilities like built-in visualization of query plans, so you can understand why an individual query was running slowly. Doing that in a single click, without leaving the tool, makes it significantly faster to understand the root cause of any issues.

Dedicated PostgreSQL metrics
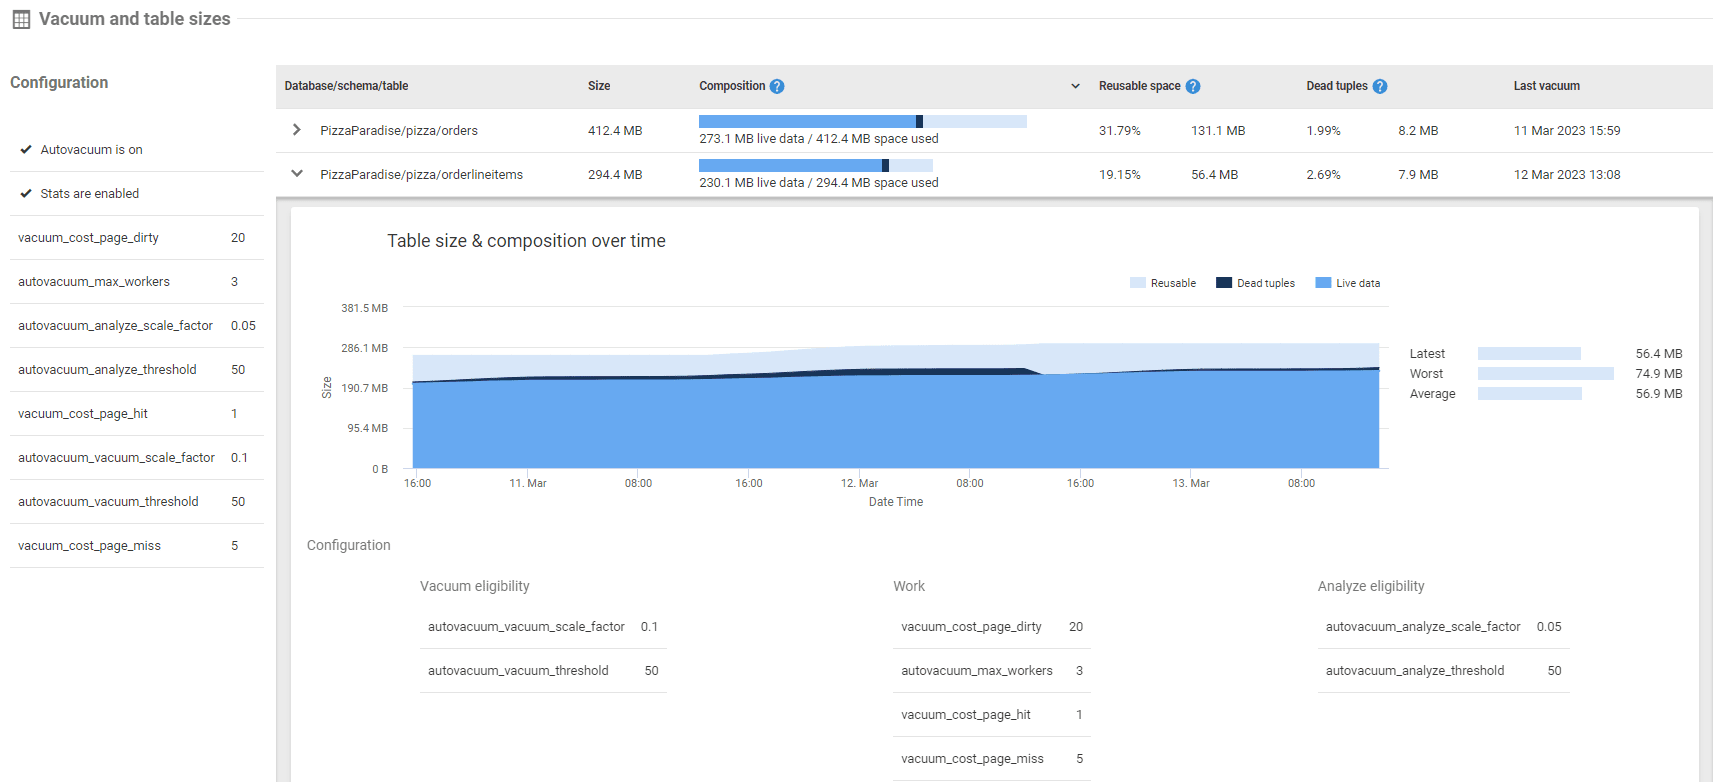
While a lot about using PostgreSQL will feel familiar to those coming to it from another database platform, there are important differences. One such difference is PostgreSQL’s vacuuming process, a result of the engine’s unique approach to concurrency control which, while offering significant advantages like reduced blocking, does introduce other challenges.
For that reason, it’s worth noting that although Redgate Monitor aims to offer an experience consistent with managing SQL Server, where appropriate it does deviate to add extra capabilities important for a PostgreSQL environment. Here, information about how vacuuming is configured is coupled with visualization of how dead space in a table is cleaned up, helping to understand the health of vacuuming and to prevent issues misconfiguration can lead to.

Cross-platform PostgreSQL monitoring
Redgate Monitor can monitor PostgreSQL instances running either on Linux, or on Amazon’s RDS. In both cases, information you see about the database engine is enriched with information about the operating system or PaaS environment, which provides valuable context when trying to understand what’s going wrong.
For example, Redgate Monitor will collect Amazon RDS machine metrics, providing measures of CPU, memory, and storage usage, as well as IO metrics like IO throughput (bytes read and written per second) and IOPS (reads and writes per second)
What’s next?
All these capabilities are available in v13 of Redgate Monitor, and later, with nothing extra to install. If you’re responsible for managing a PostgreSQL environment, give it a try.
Tools in this post
Redgate Monitor
Real-time multi-platform performance monitoring, with alerts and diagnostics


