


Checking on Failed Server Logins, Server Errors and Warnings using Redgate Monitor
When reading about yet another SQL Server exploit that was initiated by a brute-force attack on the Windows Server host, you will see a lot of 'hand waving' advice about the need to check the server logs continuously for the warnings.
I felt it was time to stop hand-waving and come up with a solution. I provide a scheduled PowerShell process that uses the Get-WinEvent cmdlet to read the Windows security event log data. Using a PowerShell script, with the help of a hash table, it searches the event log data for any critical security errors or warnings that occurred in the last 24 hours and perform a specific search on Windows event ID for "failed logins". The PowerShell script saves the data in a SQL Server database, so you scan through it there and be sure of having a permanent audit record of these security events. I then wrote a simple custom metric that returns the number of Windows events recorded in the last 10 minutes. Redgate Monitor will collect this data on a schedule and warn you when these events occur. This will give you alerts, and a baseline, for the occurrence of failed logins and a whole range of errors, warnings and critical events in the security log, and whatever other logs you choose.
I hope that this solution is still useful to readers even if they are using a different alerting system, since most tasks are in common.

Getting Windows Security Log Events
There are many Windows Security Log events; they are listed and explained here. Many are of no interest whatsoever, but some are gems for monitoring security. One might have thought that the level of a security event would be an indicator of its importance but no. Failed login attempts, which you'd expect in any brute-force attack, are considered 'informational'. However, the log errors and warnings in general are also useful and have saved me on several occasions.
Reading Windows Events and Classic Logs via PowerShell
SQL isn't suitable for this task because it is only possible to read the SQL Server error log and SQL Agent log via xp_readerrorlog. You have the Log File Viewer in SSMS that can be used to read the classic logs, which is fine for ad-hoc investigations. There are several ways of getting this information in PowerShell, as described in Laerte Junior's The PoSh DBA – Reading and Filtering Errors.
The Get-WinEvent cmdlet is probably the best tool for getting information from the over a hundred event logs on the local server, including the classic System, Security and Application logs. It also reads the event logs that are generated by the later Windows Event Log technology as well as the more recent events generated by Event Tracing for Windows. Individual logs can have thousands of entries.
This cmdlet allows you, if you are running as an Admin user, to list and investigate the logs, and read the contents. There is a lot of information here and filtering is essential, especially when you are reading the logs on several servers, one after another. When you are sensible about applying filters, Get-WinEvent can work fast. It can take a bit of experimenting before you find a search pattern that allows it to find an optimal way of searching through a log. If you get it right, it is dead fast.
The Get-WinEvent queries
There are three ways of specifying your queries. You can use XPath Queries or structured XML queries. For mere mortals like me, there are simple hash table filters that work very much like splatting the parameters, except that the parameters aren't all exposed. The best explanation of how to use it is here in Use FilterHashTable to Filter Event Log with PowerShell.
There are several different ways of slicing this huge pizza of events. You can select via a list of names of logs, names of Provider, Keyword enumeration values, Event IDs, severity level or from list of the paths to an archived classic log. You can specify the start of a time period, and the end of a time period, or the User ID that generated the error. This versatility suits us fine.
Creating the hash table filter is simple. Here we're just looking for any scary 'classic' events with levels critical, error or warning that occurred in the last 24 hours. If you need to scan other logs, you just add them to the list. We then simple use the filter as a FilterHashTable parameter for Get-WinEvents.
|
1
2
3
4
5
6
7
8
9
10
11
|
$Search = @{
LogName = 'application', 'security', 'system';
# we search the application, security and system logs
Level = 1, 2, 3;
# Verbose 5, Informational 4, Warning 3, Error 2, Critical 1, LogAlways 0
# we do events and errors of warning, error and critical levels
StartTime = (get-date) - (New-TimeSpan -Days 1)
# We go just one day back as we are calling this regularly
};
Get-WinEvent -FilterHashTable $Search -MaxEvents 1000 |
Select Id, TimeCreated, Level, LevelDisplayName, Message, ProviderName, LogName
|
While this will get you the basic warnings and errors, it doesn't get you failed logins. These aren't considered warnings, but informational events. This requires another search for any specific security events that we want to monitor, but which aren't considered to be warnings.
|
1
2
3
4
5
6
7
8
|
$FailedLogins = @{
LogName = 'security';
ID = 4625; #add any other security events you want that are informational
Level = 0;
StartTime = (get-date) - (New-TimeSpan -Days 1)
}
Get-WinEvent -MaxEvents 1000 -FilterHashTable $FailedLogins |
Select Id, TimeCreated, level, LevelDisplayName, Message, ProviderName, LogName
|
We'll stop at that point, but you might see other security events that you're interested in. I haven't demonstrated it, but you can do a lot of rapid searches by pipe-lining a whole bunch of hash tables through Get-WinEvent. You can even run a search on a list of servers.
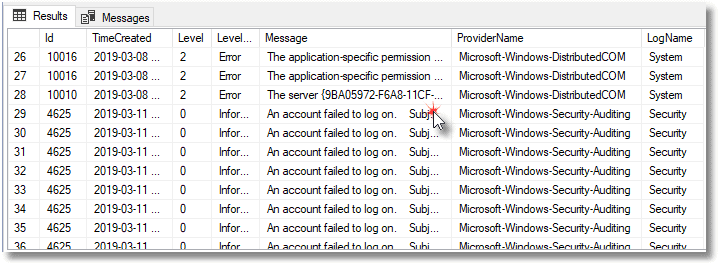
The PowerShell script for monitoring the Windows security event log
Now we just need to execute these queries on a schedule and store the results in a SQL Server database (called ServerEvents in my example). You must create the database, but the tables, a staging table called EventsStaging and the destination table called Events, are created by the scheduled process. The staging table is created automatically by using the -force parameter of the Write-SqlTableData cmdlet.
The script uses the sqlserver provider to do the boring work of copying the PowerShell objects, containing the event log data, into a staging table, and then executing the SQL code on the server that will create the destination table and add to it any events found in the staging table that are not already stored in the destination.
You must run the script on the same server as the ServerEvents database. You can run it remotely, if you specify, as a parameter of Get-WinEvent, the server from which you are monitoring events.
The admin user assigned to run this scheduled task must be a SQL Server login that is a member of the dbo role only on the ServerEvents database. Our script needs to do the routine work of picking up credentials of this admin user, stored in an encrypted form in the Windows user profile directory, the location of which is referenced via the environment variable $env:USERPROFILE. This is only necessary if you wish to avoid assigning a SQL Server login to a local windows user. The first time you run the script you will be asked for a password for your user. This will, hopefully, only happen once for any user.
Alternatively, if you use Windows authentication, the user you assign to the task can be given this login and the dbo user role for this database, and you just leave the $SQLUserName blank.
|
1
2
3
4
5
6
7
8
9
10
11
12
13
14
15
16
17
18
19
20
21
22
23
24
25
26
27
28
29
30
31
32
33
34
35
36
37
38
39
40
41
42
43
44
45
46
47
48
49
50
51
52
53
54
55
56
57
58
59
60
61
62
63
64
65
66
67
68
69
70
71
72
73
74
75
76
77
78
79
80
81
82
83
84
85
86
87
88
89
90
91
92
93
94
95
96
97
98
99
100
101
102
103
104
105
106
107
108
109
110
111
112
113
114
115
116
117
118
119
120
121
122
123
124
125
126
127
|
$SQLUserName = 'PhilFactor'
$SQLInstance = 'MyServer'
$SQLDatabase = 'ServerEvents'
$StagingTableName = 'EventsStaging'
$DestinationTableName = 'Events'
$Logfile = 'C:\Scripts\GetWindowErrors.log'
$Errors = @()
"$(get-date): started out getting errors">>$Logfile
Import-Module sqlserver -DisableNameChecking `
-ErrorAction silentlycontinue `
-ErrorVariable +Errors #load the SQLPS functionality
set-psdebug -strict
$ErrorActionPreference = "stop"
$SqlEncryptedPasswordFile = `
"$env:USERPROFILE\$($SqlUserName)-$($SQLInstance).txt"
# test to see if we know about the password in a secure string stored in the user area
if (Test-Path -path $SqlEncryptedPasswordFile -PathType leaf)
{
#has already got this set for this login so fetch it
$Sqlencrypted = Get-Content $SqlEncryptedPasswordFile | ConvertTo-SecureString
$SqlCredentials = `
New-Object System.Management.Automation.PsCredential($SqlUserName, $Sqlencrypted)
}
else #then we have to ask the user for it
{
#hasn't got this set for this login
$SqlCredentials = get-credential -Credential $SqlUserName
$SqlCredentials.Password | ConvertFrom-SecureString |
Set-Content $SqlEncryptedPasswordFile
}
"$(get-date): got credentials for $SqlUserName">>$Logfile
<#
#>
$Search = @{
LogName = 'application', 'security', 'system';
# we search the application, security and system logs
Level = 1, 2, 3;
# we do events and errors of warning, error and critical
StartTime = (get-date) - (New-TimeSpan -Days 1)
# We go just one day back
};
$FailedLogins = @{
LogName = 'security';
ID = 4625; #add any other security events you want that are
Level = 0;
StartTime = (get-date) - (New-TimeSpan -Days 1)
}
try
{
$Events = Get-WinEvent -MaxEvents 1000 -FilterHashTable $Search `
-ErrorAction silentlycontinue `
-ErrorVariable +Errors |
Select Id, TimeCreated, Level, LevelDisplayName, Message, ProviderName, LogName
}
Catch
{
$ThisError = "$(get-date): Failed to get WinEvent $($_.ErrorDetails.Message) "
$errors += $ThisError
$ThisError>>$Logfile
>>$Logfile
}
try
{
$Events += Get-WinEvent -MaxEvents 1000 -FilterHashTable $FailedLogins `
-ErrorAction silentlycontinue `
-ErrorVariable +Errors |
Select Id, TimeCreated, level, LevelDisplayName, Message, ProviderName, LogName
}
Catch
{
$ThisError = "$(get-date): Failed to get WinEvent Security log $($_.ErrorDetails.Message) "
$errors += $ThisError
$ThisError>>$Logfile
}
if ($errors[0] -ilike "*No events were found*" -and $errors.Count -eq 1)
{ $Errors = @() }
if (($Events.Count -gt 0) -and ($Errors.count -eq 0))
{
Write-SqlTableData -inputData $Events `
-ServerInstance $SQLInstance -database $SQLDatabase `
-Credential $SQLCredentials ` -SchemaName "dbo" -TableName $StagingTableName -Force `
-ErrorAction silentlycontinue `
-ErrorVariable +Errors
}
$sql =@"
USE [$SQLDatabase]
GO
IF Object_Id('dbo.$DestinationTableName') IS NULL
begin
CREATE TABLE [dbo].[$DestinationTableName](
[Id] [INT] NOT NULL,
[TimeCreated] [DATETIME2](7) not NULL,
[Level] [TINYINT] NOT NULL,
[LevelDisplayName] [NVARCHAR](40) not NULL,
[Message] [NVARCHAR](4000) NOT NULL,
[ProviderName] [NVARCHAR](40) NOT NULL,
[LogName] [NVARCHAR](40) NOT NULL
) ON [PRIMARY]
END
GO
INSERT INTO [$DestinationTableName](Id, TimeCreated, [Level], LevelDisplayName, [Message],
ProviderName, LogName)
SELECT $StagingTableName.Id, $StagingTableName.TimeCreated, $StagingTableName.Level,
$StagingTableName.LevelDisplayName, Left($StagingTableName.Message,4000),
Left($StagingTableName.ProviderName,40), Left($StagingTableName.LogName,40)
FROM $StagingTableName
LEFT OUTER JOIN [$DestinationTableName]
ON $DestinationTableName.Id = $StagingTableName.Id
AND $DestinationTableName.TimeCreated = $StagingTableName.TimeCreated
WHERE $DestinationTableName.message IS null
TRUNCATE TABLE $StagingTableName --because you don't need that data again.
"@
if ($Errors.count -eq 0)
{
Invoke-Sqlcmd -Query $sql -ServerInstance $SQLInstance `
-Credential $SQLCredentials -database $SQLDatabase `
-ErrorAction silentlycontinue `
-ErrorVariable +Errors
}
<# We collect all the soft errors and deal with them here.#>
if ($errors.Count -gt 0)
{
$errors | foreach {
"$((Get-Date).ToString()): $($_) the task was aborted">>$Logfile;
}
};
"$(get-date): checked for errors, found $($events.Count)">>$Logfile
|
I put this on the Windows task scheduler to run every 5 minutes, which is why all errors and warnings from running this script are piped to a local error log file (you wouldn't see them otherwise!)
This is a process best done in several phases, testing all the while. Firstly, run the task in PowerShell ISE on the server, logged in as the user ID you will assign to run the PowerShell task, in the scheduler. Then using PowerShell console, followed by a command console, as the same user, and finally on the scheduler, running it at five-minute intervals, and checking the local error log for any errors and reports.
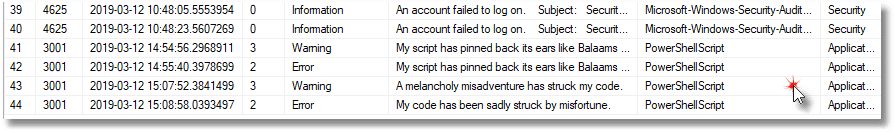
The obvious test to make sure this is working is to attempt to log onto the server with a false ID and/or password and see if anything comes up in the events table.
You can also add various spurious errors to make sure that they are recorded.
|
1
2
3
4
5
6
7
8
9
|
New-EventLog –LogName Application –Source PowerShellScript
Write-EventLog -LogName "Application" `
-Source PowerShellScript `
-EventID 3001 -EntryType Warning `
-Message "A melancholy misadventure has struck my code."
Write-EventLog -LogName "Application" `
-Source PowerShellScript `
-EventID 3001 -EntryType Error `
-Message "My code has been sadly struck by misfortune."
|
You need to check the event viewer and your SQL Server database in SSMS after five minutes have elapsed to make sure that all the events have transferred over.
Once you are sure that this is working, you can do the Redgate Monitor side.
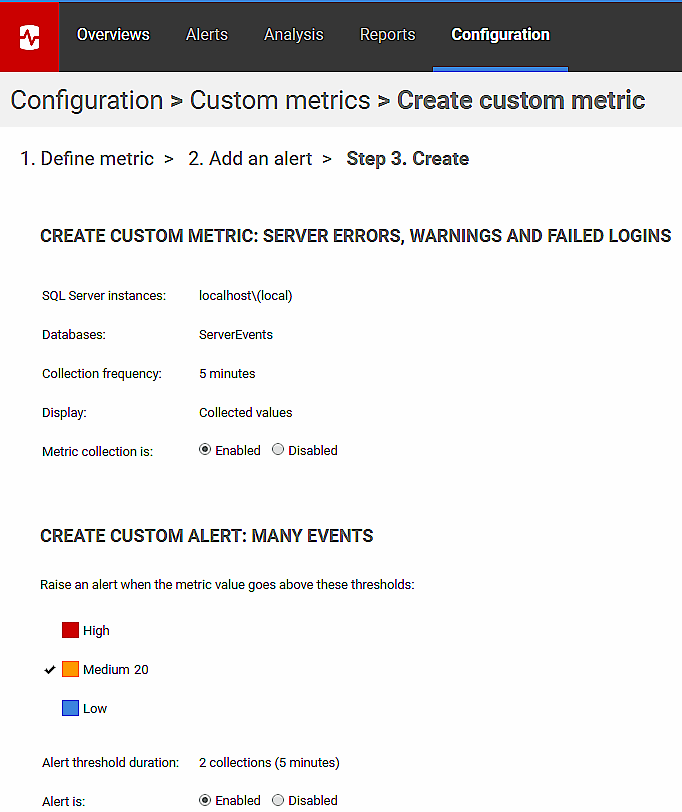
Creating the ServerEvents custom metric for Redgate Monitor
The following SQL simply counts the number of Windows events written to our Events table happened in the past ten minutes. We have the scheduled PowerShell job running every five minutes.
|
1
2
3
4
|
USE ServerEvents
SELECT Count(*)
FROM events
WHERE TimeCreated > DateAdd(MINUTE, -10, GetDate())
|
Alternatively, you might want to create two metrics, one that simple counts just the failed logins, and one that counts everything else. Here's the SQL to get just the failed logins:
|
1
2
3
4
5
|
USE ServerEvents
SELECT Count(*)
FROM events
WHERE TimeCreated > DateAdd(MINUTE, -10, GetDate())
AND providername LIKE 'Microsoft-Windows-Security-Auditing'
|
And, you can get the other events like this:
|
1
2
3
4
5
|
USE ServerEvents
SELECT Count(*)
FROM events
WHERE TimeCreated > DateAdd(MINUTE, -10, GetDate())
AND NOT providername LIKE 'Microsoft-Windows-Security-Auditing'
|
I used just one metric because it is so useful to check in SSMS anyway, whatever the cause, but however you choose to do it, you can now use these queries to create your custom metrics in Redgate Monitor, plus assoicated alerts. This is, obviously, not a database-level metric. You should specify running it only on master.
You can then check that it is working by making spurious attempts at logging into the server and running PowerShell scripts to write errors and warnings into the various logs that you are monitoring
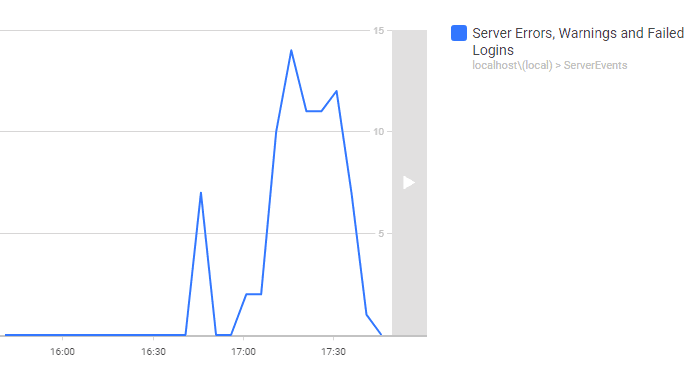
Yikes, someone is attempting to brute-force attack one of my logins! Err, no. In this case, I was just checking to make sure that 'water goes through all the pipes'. You'll detect a lot more than just failed logins too. While all this was running, a system upgrade ran on the server I was using as a test bed. So much went wrong, and now all of it detected.
Do I usually check all the logs? Do I heck. Now I had plenty of confirmation that the monitor was working well, and I was grateful for that belt-n-braces approach to the data gathering, of getting a whole days' data.
Querying and reporting on the security monitoring data
Having the error logs in a table is such a wonderful idea for a SQL Server developer like myself because I can now slice and dice all the data and search the messages. For example, I can search for specific strings:
|
1
|
SELECT Message, LogName FROM Events WHERE Message LIKE '%Vlad The Impaler%';
|
Giving:
|
1
2
3
4
5
6
7
8
9
10
11
12
13
14
15
|
message
-------------------------------
An account failed to log on.
Subject:
Security ID: S-1-0-0
Account Name: -
Account Domain: -
Logon ID: 0x0
Logon Type: 3
Account For Which Logon Failed:
Security ID: S-1-0-0
Account Name: Vlad the Impaler
Account Domain:
Security
(1 row affected)
|
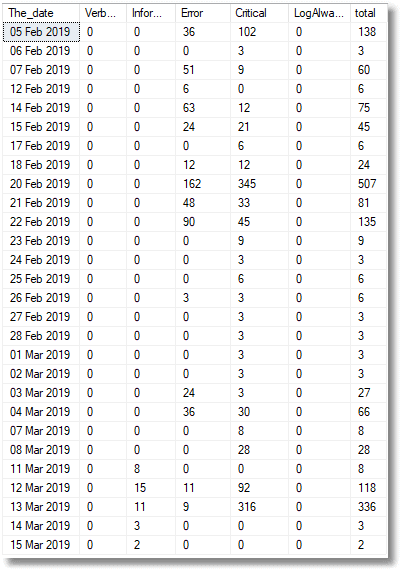
I can break down the errors by severity:
|
1
2
3
4
5
6
7
8
9
10
|
SELECT Convert(CHAR(11), TimeCreated, 113) AS The_date,
--Verbose 5,Informational 4,Warning 3,Error 2, Critical 1 LogAlways 0
Sum(CASE WHEN Level = 5 THEN 1 ELSE 0 END) AS Verbose,
Sum(CASE WHEN Level = 4 OR Level = 0 THEN 1 ELSE 0 END) AS Informational,
Sum(CASE WHEN Level = 3 THEN 1 ELSE 0 END) AS Error,
Sum(CASE WHEN Level = 2 THEN 1 ELSE 0 END) AS Critical,
Sum(CASE WHEN Level = 1 THEN 1 ELSE 0 END) AS LogAlways, Count(*) AS total
FROM Events
GROUP BY Convert(CHAR(11), TimeCreated, 113)
ORDER BY Min(TimeCreated);
|
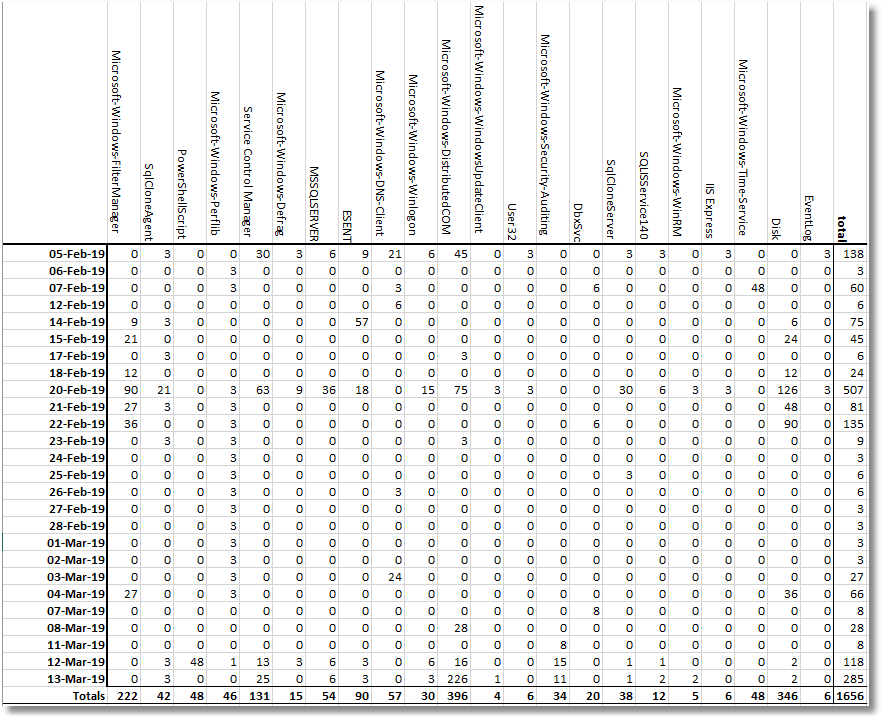
Or by provider, to see the number of errors by provider per day.
|
1
2
3
4
5
6
7
8
9
10
11
12
13
14
15
16
17
18
19
20
|
DECLARE @variable NVARCHAR(MAX) =
'Select Convert(CHAR(11), TimeCreated, 113),'
+
(
SELECT
String_Agg
(Convert
(NVARCHAR(MAX),
'sum(Case when Providername like '''
+ providername + ''' then 1 else 0 end) as ['
+ providername + ']'
), ', '
)
FROM (SELECT ProviderName FROM Events GROUP BY ProviderName) AS f(providername)
)
+ ',count(*) as [total]
FROM Events
GROUP BY Convert(CHAR(11), TimeCreated, 113)
ORDER BY Min(TimeCreated);';
EXECUTE sp_executesql @variable;
|
I can fix specific problems without having to do messy searches through logs. Also, because I can keep the data in a SQL Server database, I can keep a much longer history.
Extending the solution
I have rather left it to the imagination as to how to extend this to a group of servers. The Redgate Monitor side is easy, but to make it work, the Windows events need to be stored on each instance. You'd need to decide whether to do a collection from a central place and write copies of the records for each server as they are collected, or whether instead you run a script on each server. I reckon it depends on the size of the SQL Server estate, but it is a matter of judgement.
The advantage of a central error collector is in checking it. The Get-WinEvent cmdlet can collect log records across a network if you tell it the server to get them from, so the script and data model isn't much more complex, though the credential aspect could get messy.
Conclusion
If an alien spaceman were to fly down and ask me about relational database systems, I would have some difficulty explaining SQL Server Security to it. As database people, we pay close attention to the instance, but far less to the server hosting it. I can almost see the quizzical look on the alien's face as I tell it that I can't easily get alerts of critical or error Windows events.
Fortunately, assuming I can get agreement from the Ops people to run my scheduled PowerShell task, I now have no such risk of such social awkwardness when quizzed on how database security works on Earth by visitors from space. Here's hoping that the spirit of DevOps cooperation also extends to allowing me a scripted collection of these tasks, thereby saving me from intergalactic embarrassment.
Although an Azure SQL Database is in a nice, managed cocoon, like a contented insect grub, the same isn't necessarily true of databases hosted on a network. So many successful penetrations of SQL Server, such as brute-force password attacks, rely on security issues with the hosting server and it therefore seems right to be aware of security alerts and warnings at the Server level. Actually, one needs to be aware of all events. It is not just the malicious intruder that can hobble a Windows Server, but an automatic upgrade too, or a power brownout.
At least, now, with Redgate Monitor's help I can get alerts, and a baseline, for the occurrence of failed logins and other Windows security events, and then drill down into the detail in a SQL Server database. Yes, it is very useful to know what errors, alerts and warnings are happening at the server level, and when they happen!
Tools in this post
Redgate Monitor
Real-time multi-platform performance monitoring, with alerts and diagnostics
You may also like

Webinar
Datenbank Monitoring - News & Updates
In diesem on-demand Webinar erfahren Sie die neuesten Infos zu Redgate’s Monitoring Software. Marko Coha gibt einen Überblick zu neuen Features und wo die zukünftige Weiterentwicklung hingeht. Wenn Sie Fragen zu Redgate Monitor oder anderen Redgate Lösung haben, klicken Sie bitte einfach hier. Nutzen Sie diese Möglichkeit, um auf dem neuesten Stand zu sein.

Article
A Fresh Look at the NHS Autumn Budget: Opportunities for IT Teams
Over £2 billion has been earmarked for the IT modernisation of the NHS. Let's explore some of what this means for IT teams and how Redgate can help.

Article
Tracking the number of active sessions on a database using Redgate Monitor
Phil Factor creates a simple custom metric to track the number of sessions that have recently done a read or write on a database. Having established a baseline for the metric, you'll be able to spot, and investigate the cause of, any wild deviations from normal behavior.

Article
How to generate realistic text data using SQL Data Generator
To get the best results, you need to provide SQL Data Generator with some hints on how the data ought to look. Phil Factor nudges it towards realistic text data.
Article
How to build multiple database versions from the same source: object filters
How to use filters in SQL Compare to avoid deploying objects that exist only in the source to databases where they may not be required or appropriate.
Article
Redgate Monitor’s new Current Activity page
We recently released a minor version of Redgate Monitor, v12.1, that includes Tagging and a new ‘Current Activity’ page. This blog post will outline the latter feature. What is the new Current Activity page? Redgate Monitor provides a lot of information on individual servers collected through our samplers which run periodically. That information is useful for diagnosing issues that happened yesterday, or even a few minutes ago, but less helpful for diagnosing an issue that is going on right now. Previously when you were made aware of an issue happening you may have had to leave Redgate Monitor and use
Loading comments...