


Monitoring and Troubleshooting Deadlocks with Redgate Monitor
What is a deadlock?
Deadlocks occur when two or more sessions inside the database engine are waiting for access to locked resources held by each other. A deadlock is a circular locking chain: every process (SPID) in the blocking chain will be waiting for one or more other processes in that same blocking chain, such that none can complete.
How SQL Server resolves deadlocks
SQL Server has a lock monitor that provides automatic deadlock detection, by periodically checking for the existence of any circular locking chains. As soon as SQL Server detects a deadlock it will act to resolve it, by killing one of the deadlocked processes, and rolling back the transaction it was running.
For example, let's say session A holds a lock on one resource, but can't proceed until session B releases a lock on a resource it needs to access, and Session B can't proceed till Session C releases a lock, and session C can't proceed until session A releases its lock.
SQL Server will resolve the deadlock by killing one of these sessions (the deadlock victim), and rolling back its transaction, therefore releasing any locks it held. This allows the other sessions in the blocking chain to continue executing.
The unfortunate deadlock victim, receives the 1205 error message:
Transaction (Process ID XX) was deadlocked on resources with another process and has been chosen as the deadlock victim. Rerun the transaction.
Why do we need to diagnose deadlocks?
Just because DBAs don't need to intervene, manually, to resolve a deadlock, it doesn't mean they can ignore them. It's an important error condition, and they should investigate immediately to find out what caused the deadlock, and take steps to prevent it recurring.
Firstly, the deadlock victim may turn out to be an important business process. Deadlocks are disruptive to the deadlock victims, prevent forward progress of other queries, and cause applications to misbehave.
Secondly, some of the most common causes of deadlocks include poor database design, lack of indexing, poorly designed queries, unnecessary or overly long explicit transactions, and inappropriate choice of transaction isolation level. If these problems afflict your databases, it's likely that your applications are suffering not only from deadlocks, but also slow-running queries, severe blocking, and other performance problems. By monitoring, and diagnosing deadlocks, we can then go on to improve the overall database performance.
How do we handle deadlocks?
The DBA needs to ensure proper handling of this 1205 exception, to avoid UnhandledException errors in the application. Whether this is done using a BEGIN TRY/CATCH block inside the SQL being executed, or within the application code, the most common approach is to pause, and then retry the transaction a set number of times.
Diagnosing deadlocks: how to read the deadlock graph
The key piece of diagnostic data for understanding the cause of deadlocks in SQL Server is the deadlock graph, which shows us which processes and resources were involved in a deadlock, which one was chosen as the deadlock victim, and more.
One way to capture the graph is to set up a server-side Profiler trace to capture the Deadlock Graph event, and wait for the deadlock to recur. However, a much more convenient method is to use the Extended Events xml_deadlock_report event, captured automatically by the system_health event session, which is running by default on all installations of SQL Server 2008 and later. The xml_report field of this event holds the deadlock graph. Also, uniquely, the Extended Events deadlock graph allows diagnosis of multi-victim deadlocks, where SQL Server had to kill multiple sessions to resolve the deadlock condition.
If you're trying to resolve deadlocks on instances that pre-date SQL Server 2008 or for some other reason can't use Extended Events or Profiler traces then I'll refer you to Jonathan Kehayias' article, Handling Deadlocks in SQL Server, for other ways to do this.
The Deadlock Condition
The example we'll use is often referred to as an Update Order (or sometimes Reader-Writer) deadlock. The footprint of this type of deadlock is two processes that each update and then query the same two tables, in a different order, each within an explicit transaction.
You can download the ReaderWriterDeadlock code file to reproduce the deadlock.
Common types of SQL Server deadlock
For dissection of some of the other common types of deadlock, what causes them, and strategies to prevent their recurrence, see Gail Shaw's article, SQL Server Deadlocks By Example.
Reading the Deadlock graph
Figure 1 shows the resulting Extended Events xml_deadlock_report event in the event_file target of the system_health default event session.
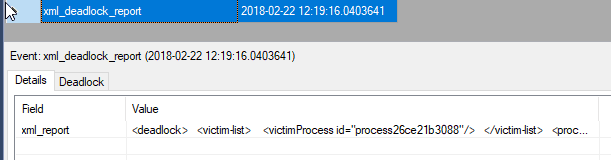
Figure 1: Capturing the deadlock graph using Extended Events
You can click on xml_report to open the full XML deadlock graph, as shown in Figure 2. I've added the colored boxes, manually, to highlight the three main sections of the deadlock graph (victim list, process list, resource list).
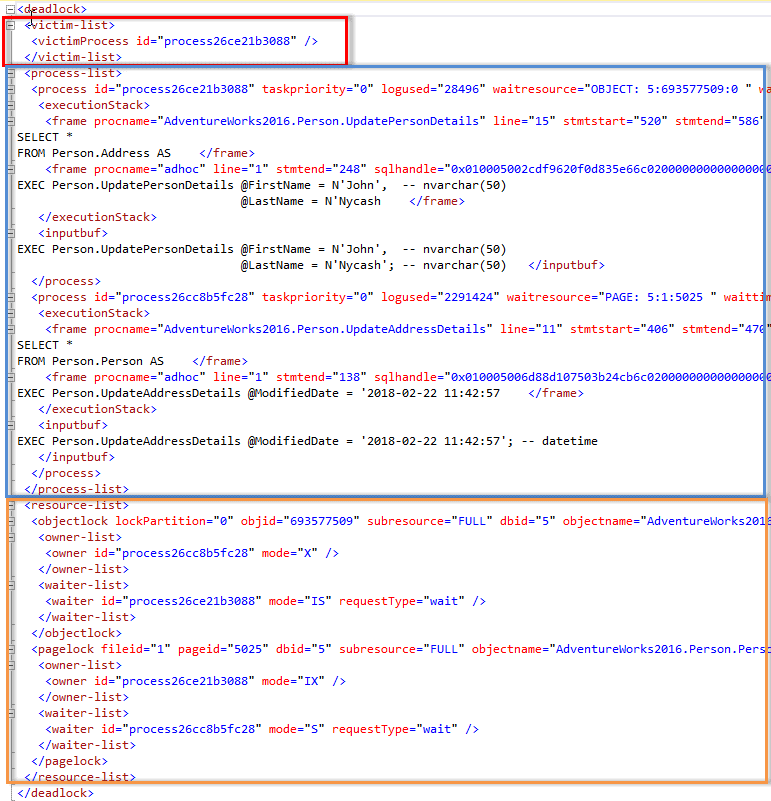
Figure 2: the XML deadlock graph
Reading an XML Deadlock Graph takes patience, and some of the elements, particularly the <process> elements, contain many fields, so you'll find yourself scrolling left and right to find some of the important details, such as the isolation level requested for each of the deadlocked processes.
However, once you've mastered the basics, all the information you need to diagnose the deadlock condition is in there. The alternative is to switch to the Deadlock tab, in Figure 1, to see a basic, visual representation of the graph.
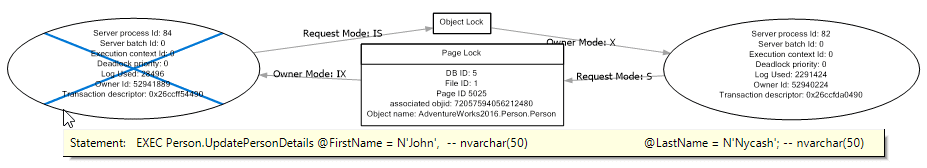
Figure 3: Visual representation of the deadlock graph is SSMS
The blue cross indicates clearly which process (SPID 84) was the deadlock victim. Clicking on it brings up a tooltip showing the last SQL batch it issued, a stored procedure execution. We can see that, to execute this batch, process 84 issued a request for an Intent Shared (IS) lock on an object, although which object isn't immediately obvious (it's Person.Address), but was blocked. We can also see that process 84 already owned a IX lock on a page in on the Person.Person table.
The other process (SPID 82) already owned an Exclusive (X) lock the object on which 84 had requested in IS lock, which is why 84's request was blocked. We can also see that process 82 made a request for a S lock on a page in Person.Person, to read it, but was blocked because process 84 held an IX lock on it. So, we can get a feel at what's happened here, and the processes and resources involved, but the full details are elusive.
Generally, not many developers or DBAs find SSMS's visual depiction of the deadlock graph easy to read and understand, and so often stick to wading through the XML version.
Monitoring Deadlocks in Redgate Monitor
Redgate Monitor's key mode of operation is to raise alerts based on abnormal or undesirable conditions and properties or error, on any of the monitored servers, instances and databases. It provides a range of alerts for specific SQL Server errors and problems, including deadlocks.
Redgate Monitor includes a built-in alert, called Deadlocks (Extended Events), which will, by default, raise a medium-severity alert whenever a deadlock occurs, and captures the Extended Events Deadlock Graph. This means you get through Redgate Monitor the same XML Deadlock Graph as you get from Extended Events, but with some useful enhancements and advantages.
Firstly, Redgate Monitor presents a much simpler, clearer, graphical version of the deadlock graph, which includes all the important information you need to diagnose the problem. Secondly, it provides all the important contextual data you need to understand about the activity on the server, and on the affected database, at the time of the deadlock.
Armed with all this diagnostic data, you can build a full picture of why and when the deadlocks occur, what other process might be affected, and you can formulate the best strategy for eradicating the problem.
Redgate Monitor's graphical deadlock graph
In Redgate Monitor, we can see immediately that a deadlock alert was raised on one of our SQL Server instances.
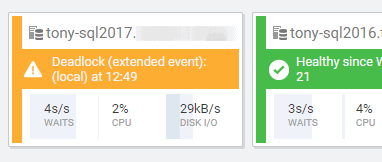
Figure 4: A deadlock alert was raised
Clicking on the deadlock alert will, as for any alert, takes us to the Details tab of the Alerts screen. For every alert, the top of the Alerts screen (not shown) will indicate the time the alert was raised (and ended, if relevant) and the status of the alert.
In the body of the Details tab, we see the details that are specific to the alert. In this case, we see graphical depiction of the deadlock graph, as shown in Figure 5.
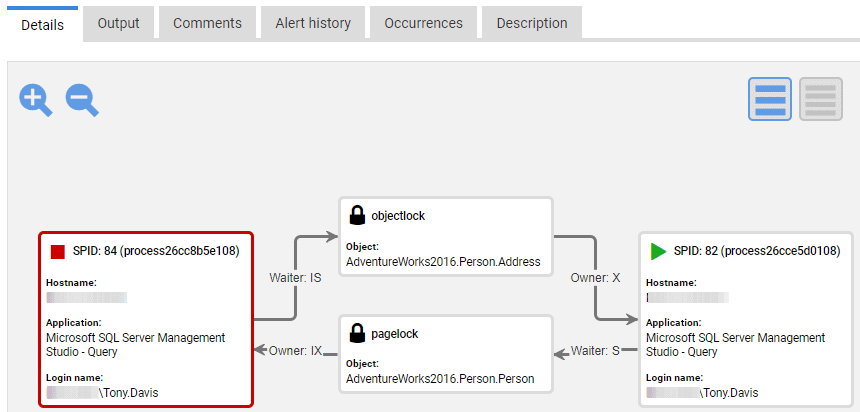
Figure 5 – The Details tab for a Deadlock alert showing a graphical deadlock graph
The source of the Extended Events XML Deadlock Graph is still fully available; just click on the Output tab to see it. However, in Redgate Monitor, the graphical version makes it very easy to see all the critical details.
We can see straight away that processes 84 and 82 were engaged in a deadlock and the red border indicates that SQL Server chose process 84 as the deadlock victim, and rolled it back. For each process, we can see the machine, application and login name for the client who issued the SQL batch.
Process 84 needed to acquire a lock on the Person.Address table, to read it, but was blocked since process 82 held an X lock on this object. In turn, process 82 needed to acquire a lock on a page in the Person.Person table, to read it, but was blocked since process 84 held an IX lock on this page. At this point, SQL Server's lock monitor detects a circular lock chain and kills the suspended thread that is running the process with the lowest rollback cost.
If we click on either of the processes, we further important diagnostic details including the text of the SQL batch issued by that process. In Figure 6, we see that process 82 issued a batch to execute a stored Procedure called Person.UpdateAddressDetails, and that the last SQL statement executed was a SELECT * query on the Person.Person table.
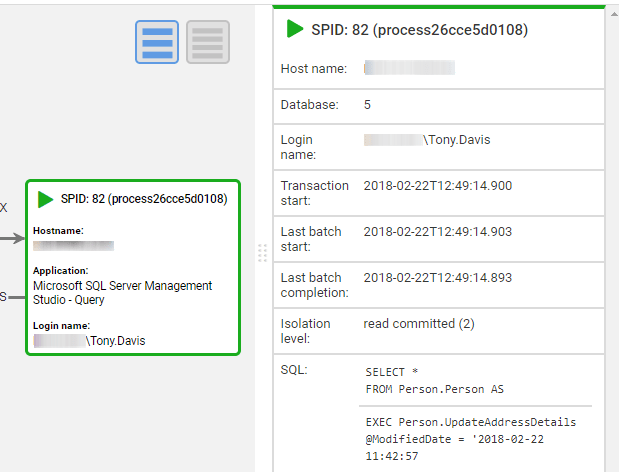
Figure 6: Details of each process involved in the deadlock
Likewise, if we examine the deadlock victim, we'll see that it was executing an UpdatePersonDetails stored procedures, and the last SQL statement it issued was a query on the Person.Address table.
We also see the transaction isolation level for the SQL Server session, which in this case was the default READ COMMITTED level. However, it's worth knowing if the application specified use of a more restrictive transaction isolation level (such as REPEATABLE READ or SERIALIZABLE), which forces SQL Server to lock resources for longer, and is a common cause of blocking and deadlock issues.
Root cause analysis
The advantage of using a tool like Redgate Monitor is that not only do we see the deadlock data, we get to see it within the full context of the activity occurring on the SQL Server instance around the time of the alert.
Server and database-level diagnostic data for the alert
Scroll down on the alerts screen and you'll see a host of performance data, arranged by tabs, showing snapshots and summaries of resource usage and activity levels on the host machine, and SQL Server instance, at the time of the alert, as well as details of SQL Server queries and processes, or other server-level processes. For example, the SQL Server tab shows a spike in the average lock wait time metric, around the time of the incident.
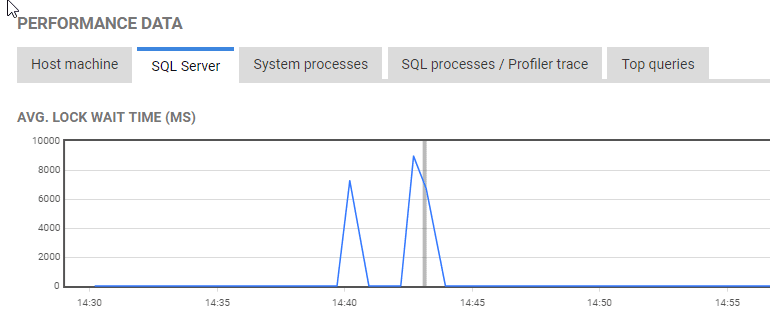
Figure 7: SQL Server instance-level metrics around the time of an alert
On the Top queries tab, we see queries that were executing around the time of the alert. By default, Redgate Monitor lists them in order of duration, but by clicking on the desired column (such as Logical reads), we can reorder the results by that column.
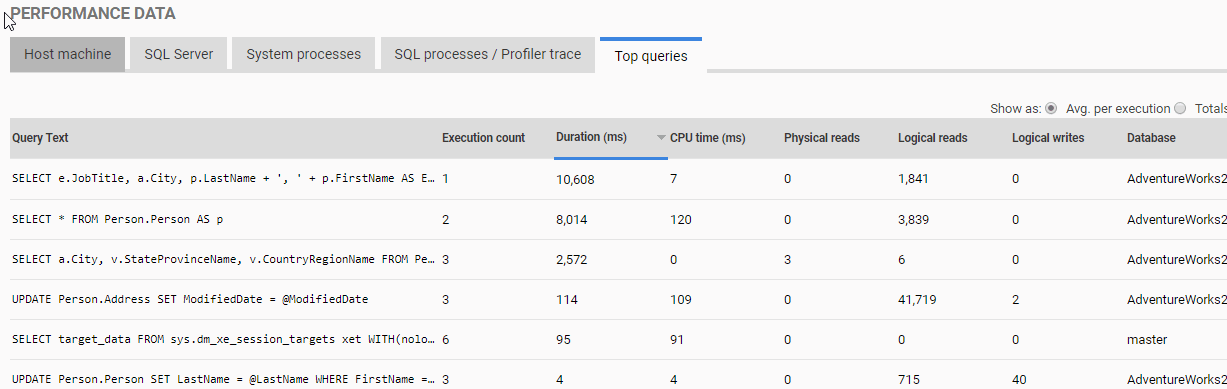
Figure 8: Top queries from the time of the deadlock alert.
We recognize a few of these queries to be part of the stored procedures involved in the deadlock. If we click on the SELECT * query on Person.Person, we see the text of the query, a link to view its query plan, from the plan cache, and a list of any significant waits associated with the query. In this case, we can see that it was forced to wait when trying to acquire a shared read lock.
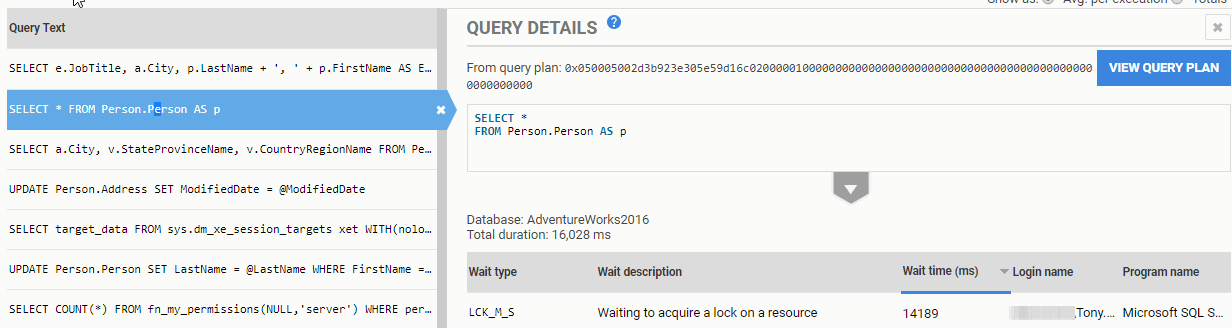
Figure 9: Details of one of the top queries.
Figure 10 shows the associated query plan. This query is part of the Person.UpdateAddressDetails stored procedure (executed by SPID 82), and we see the plans for each statement in the stored procedure. In this case, the stored procedure (written purely for demo purposes!) starts an explicit transaction, updates the Address table, and then queries the Person table (before rolling back).
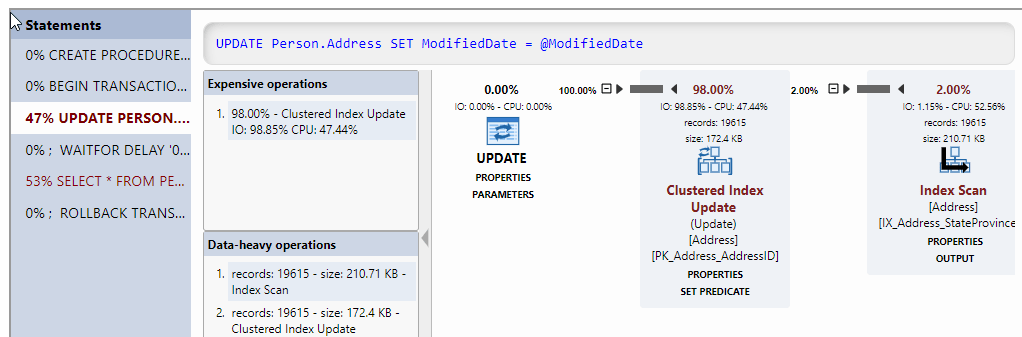
Figure 10: Query plan for one of the stored procedures executed to cause the deadlock.
If we were to examine the sixth query in the list from Figure 9, we'd see that it's a query from the Person.UpdatePersonDetails stored procedure (executed by SPID 84, the deadlock victim), which access the same tables in the opposite order, first updating the Person table and then querying the Address table.
We can also see details of other processes and queries that may have been affected by the incident. In this case, the longest running query in the list was a separate ad-hoc query that also needed access to the Person and Address tables, and suffered locking waits, caused by the occurrence of the deadlock.
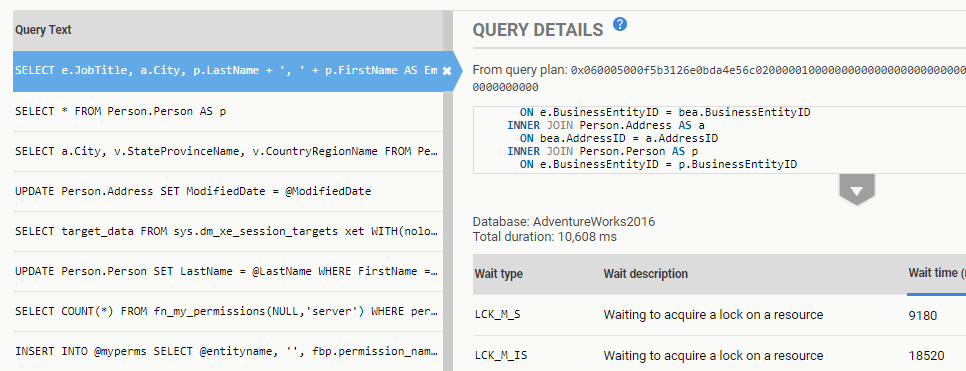
Figure 11: Other affected queries.
The Interactive Incident timeline
Alongside the specific diagnostic data for an alert, it's also very useful to review the Overview graph for the affected SQL Server instance, which displays CPU, Memory, I/O and Waits over a selected period, along with an "incident timeline" showing the occurrence of alerts. In this case, we see a cluster of alerts, including the deadlock alert we investigated. We can see a 'bump' on waits around this period, and a significant peak in disk IO activity.
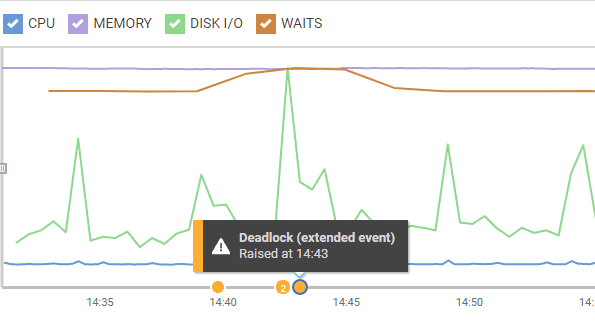
Figure 12: Interactive Overview graph and incident timeline
Scrolling down the Overviews page, we see top queries and waits that occurred in the set period, along with snapshots of server- and database-level metrics, as well as specific summaries of processes running at the time of the alert, such as Blocking Processes (Top 10 by time), and others.
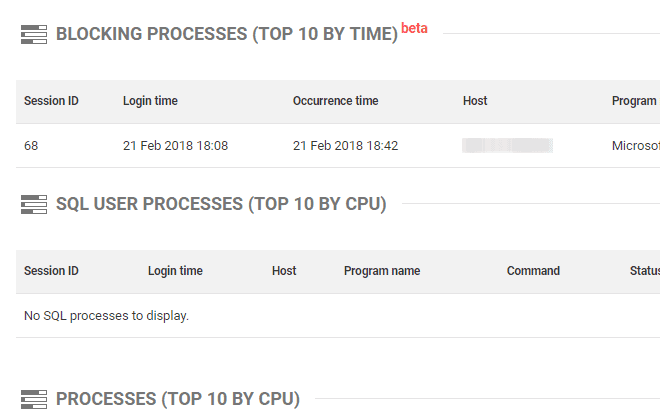
Figure 13: Blocking Processes (Top 10 by time)
Preventing the recurrence of deadlocks
Armed with knowledge of the queries involved in the deadlock, and with the broader knowledge of concurrent activity on the server, we can take steps to resolve the problem, to ensure it does not recur. This might involve query tuning, adding a new index, or modifying an existing one, or some other standard mitigation for deadlocks. Often the cause is unnecessary transactions, held open for too long, or statements within a transaction that have no need to be in there.
Th deadlock in this article, albeit contrived and simplified for demo purposes, was an example of an Update Order deadlock, caused by two processes that each updated and then queried the same two tables, in a different order, within an explicit transaction. Questions to ask in resolving this problem would include:
- Given that in neither case does the stored procedure include multiple data modification statements that need to form an atomic unit, is the explicit transaction necessary?
- Can we move either
SELECTstatement outside the transaction? - Can we reverse the order of either, or both, sets of statements?
If any of these changes are possible, the deadlock will be prevented, though the third solution on the list relies on use of the default Read Committed isolation level, where shared locks are released no later than the end of the query.
For more general advice on coding techniques to help avoid deadlocks, see Diagnosing Deadlocks, in the Redgate Monitor documentation.
Summary
With Redgate Monitor you will be alerted to deadlocks as they happen, giving you the chance to recover any lost processes and put procedures in place to minimize their occurrence in the future.
Redgate Monitor supports the extended events deadlock graph, and adds much simpler and clearer visualization than is available in SSMS. With the added benefit of snapshots of historic data, from the time of the alert, you can start to build a full picture of what happened and what was affected as a result.
You can download a free 14-day trial of Redgate Monitor to start monitoring deadlocks. And if you'd like any help, just get in touch.
Further Reading
- SQL Server Deadlocks by Example, Simple-Talk article by Gail Shaw
https://www.red-gate.com/simple-talk/sql/performance/sql-server-deadlocks-by-example/ - Handling Deadlocks in SQL Server, Simple-Talk article by Jonathan Kehayias
https://www.red-gate.com/simple-talk/sql/database-administration/handling-deadlocks-in-sql-server/ - Detecting and Ending Deadlocks, Microsoft TechNet resource
https://technet.microsoft.com/en-us/library/ms178104(v=sql.105).aspx
This document contains proprietary information and is protected by copyright law.
Copyright © 2026 Red Gate Software Limited. All rights reserved
Tools in this post
Redgate Monitor
Real-time multi-platform performance monitoring, with alerts and diagnostics
You may also like

Article
Checking for Database Drift using Extended Events and Redgate Monitor
Phil Factor uses Extended Events and a Redgate Monitor custom metric to detect when the metadata of a database has 'drifted', meaning that a database object has been created, deleted or modified outside of the official change management process.

Article
Why Database Deployments Sometimes Go Bad
Phil Factor shares some of the common ways database deployments go wrong, and the testing strategies and sanity checks that will stop them happening to you.

Article
Query Executions in Redgate Monitor
Query Executions in Redgate Monitor captures individual query executions for long-running queries, providing deeper insight into database workload and resource usage. This helps DBAs diagnose performance issues with greater accuracy.

Article
Redgate Monitor Product Updates - May 2026
Redgate Monitor ships new features every month and the past few months have brought some exciting new additions to empower your workflows. Spanning AI-powered tooling, cloud deployment, cross-database platform support and enterprise security, these updates reflect some of the biggest areas shaping how database teams work today. Whether you’re managing compliance requirements, trying to get on top of alert management or looking to get a better grip on cloud costs, there’s something here for you. Stay ahead of potential issues with smarter alerting and AI-powered diagnosis Dynamic Alert Thresholds (v14.00) and AI Alert Analysis (v14.15) work together to shorten the time a DBA spends on alerts. Dynamic Alert Thresholds uses machine learning to set thresholds against

Article
A Faster Way To Spot What's Slowing Down Your PostgreSQL Database
When a PostgreSQL database starts misbehaving, your instinct might be to jump straight into query plans and index statistics. But often, the real story hides one level higher, in wait events: the moments where PostgreSQL pauses and tells you exactly what it’s waiting for. Redgate Monitor now surfaces this data visually for PostgreSQL customers. Here’s why that matters. What Are Wait Events, and Why Should You Care? Every time a PostgreSQL session can’t proceed immediately, it registers a wait. These waits are grouped into Wait Event Types, which are high-level categories that tell you immediately “why” the wait occurred: Lock
Article
Troubleshooting Blocking in SQL Server using Redgate Monitor
Redgate Monitor tells us immediately when significant blocking occurs, and where, during busy periods, and provides the full blocking chain, in an easy-to-digest graphical format, so we can diagnose and resolve the blocking quickly.
Loading comments...