Better Database Incident Management with Redgate Monitor
This article demonstrates how Redgate Monitor helps teams manage database incidents efficiently, by providing the right data to the right people, at each stage of a tiered incident response system. With fewer distractions from routine issues, specialist staff can focus on core tasks while teams resolve problems faster and prevent future disruptions.
Unpredictable database incidents like deadlocks, blocking, and long-running queries are inevitable. The speed and precision with which a monitoring solution enables teams to respond to these events is what separates a system focused on prevention and continuous improvement from one that keeps IT teams stuck in reactive firefighting.
Many monitoring systems provide metrics and alerts but fail to support an efficient response. Alert flooding, missing data, or a lack of context make it difficult to diagnose root causes. Even when the right data is available, it’s typically only accessible to a small group of experts—sometimes only the DBA—making it harder to scale responses across larger teams and organizations. Redgate Monitor seeks to tackle this problem. It provides all the in-depth data DBAs need to resolve issues like deadlocks, blocking, and slow queries and delivers this data in a way that makes it accessible and useful across the organization. This accessibility allows DBAs to collaborate more effectively with other teams.
This article uses a typical database deadlock incident to demonstrate how Redgate Monitor’s data, combined with a coordinated, tiered incident response, ensures that these incidents are always managed efficiently — reducing DBA distractions from core tasks, minimizing service disruption and downtime, and promoting team collaboration. Over time, you develop a culture of continuous optimization that reduces the need for crisis-driven responses, while keeping DBAs in control of complex database diagnostics.
Why a tiered incident response?
A database monitoring solution tracks various database events, generates alerts, and sends notifications to the right personnel, often a DBA. However, relying solely on a DBA, or small group of experts, to handle all database alerts doesn’t scale well in enterprise environments. Instead, we need a structured and integrated approach that helps quickly identify serious incidents requiring an urgent response while making diagnostic data accessible to all relevant teams. This ensures that issues are resolved efficiently and that DBAs and other specialists in the Ops team can stay focused on strategic projects, rather than being pulled into every minor issue.
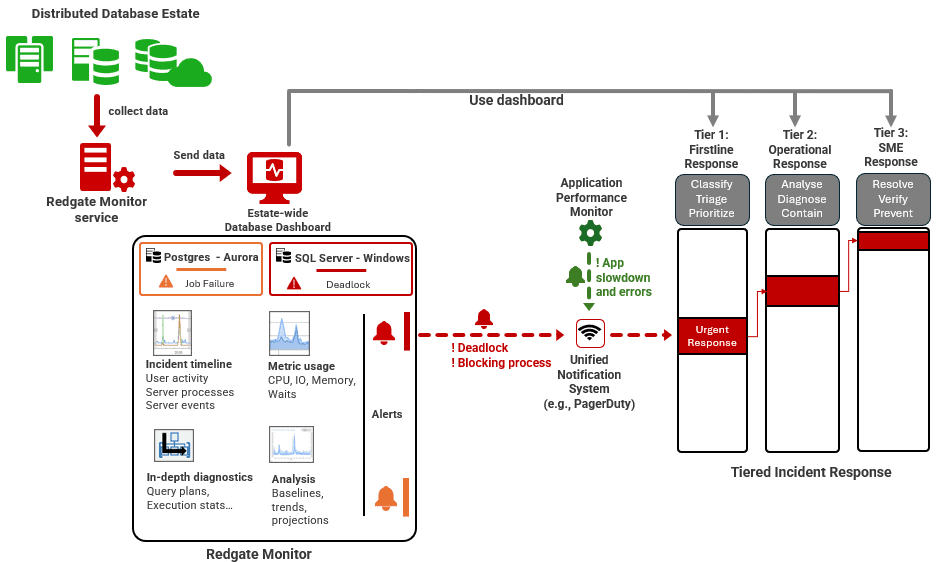
My recent whitepaper, An Integrated Approach to Enterprise Database Monitoring and Incident Management, proposed a strategy that integrates Redgate Monitor’s database metrics and intelligent alerting into a 3-tiered incident response system. Via simple webhook integration, Redgate Monitor sends notifications for urgent alerts to the organization-wide notification system (e.g. PagerDuty, Opsgenie, ServiceNow, etc.), as do any other integrated monitors in the system such as application and network monitors.
Urgent alert notifications are ‘triaged’ by the first line (Tier 1) response team. They use them to locate the likely source of any problem, prioritize the response based on the scale of its impact, and escalate incidents to the appropriate operational and technology specialists for initial diagnosis (Tier 2). The final response tier is the subject-matter experts responsible for testing and implementing fixes and improvements (Tier 3). This tiered approach ensures that DBAs and other specialists are not constantly distracted by routine issues, and only step in when their expertise is truly needed.
Redgate Monitor’s global dashboard makes consistent and detailed diagnostic data available across all tiers of the response. All the data, from the alert details and server and user activity summaries used by the Tier 1 response team to the advanced metrics and analytics used by Tiers 2 and 3, comes from the same source. This makes collaboration and reporting, in incident management, much simpler.

Efficiently responding to deadlock errors
Let’s see how this might work in practice, using a SQL Server deadlock incident as an example.
Why do we need to respond to deadlocks?
A deadlock occurs when two or more sessions in the database engine are waiting for access to resources that are locked by each other, creating a cycle where none can proceed. SQL Server’s lock monitor automatically detects and resolves this by killing one of the deadlocked processes and rolling back its transaction. This ‘deadlock victim’ receives a 1205 error, which the application should handle, typically by retrying the transaction.
This removes the deadlock, but this is still a serious error that must be investigated. It could be an important process that was rolled back. Also, the root cause is usually an issue such as overly long transactions, inappropriate transaction isolation level, or poorly designed indexes. While these may cause deadlocks intermittently, they will likely cause ongoing blocking issues, if not addressed.
Other deadlock-related diversions include advice in the Redgate Monitor documentation, a product learning article, and a Phil Factor poem.
A tiered response to a deadlock incident
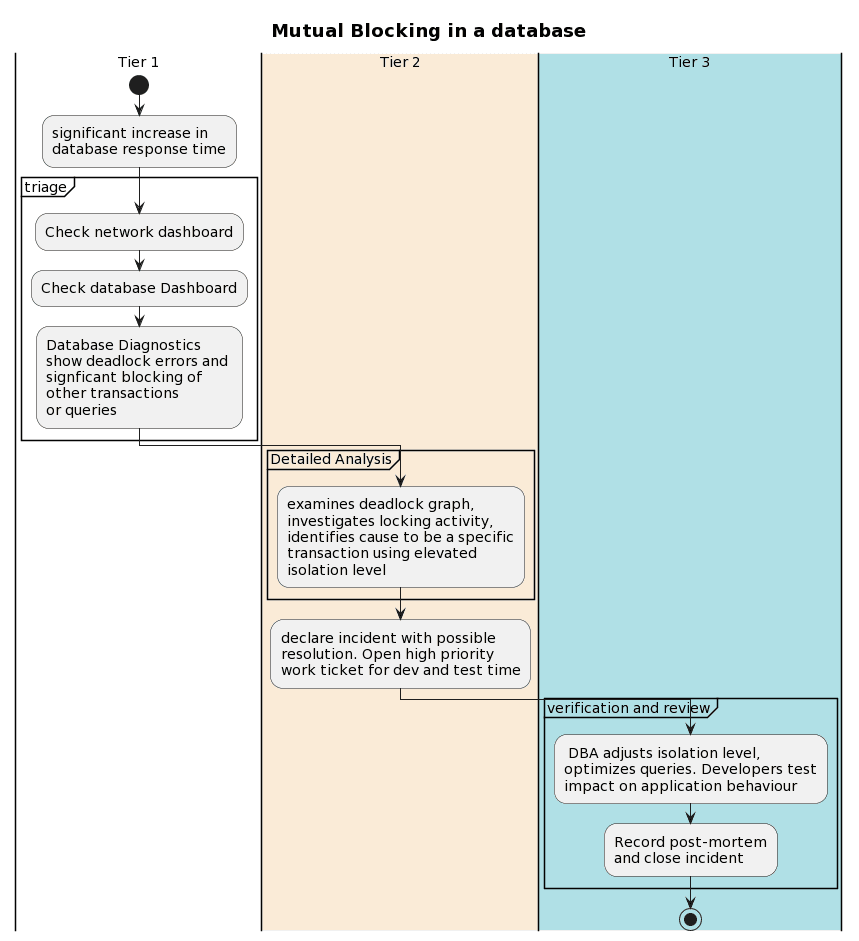
The frontline response team (Tier 1) receives an urgent notification that an application is showing slow response times and intermittent ‘failed transaction’ errors. After a quick triage, they identify SQL Server deadlocks as the source of the errors and blocking of other processes as the likely cause of the performance degradation. They escalate the incident to Tier 2, the Operations team.
Using Redgate Monitor’s detailed diagnostics—including deadlock graphs, query performance data, and blocking analysis—Tier 2 investigates the root cause. They document their findings and pass the incident to Tier 3, which involves both DBAs and developers, for testing and resolution.

The frontline (Tier 1) response: classify, triage, prioritize
The incident response starts with the timely detection of any threats to the availability or service level of the business systems, services and processes. This information is essential for the frontline (Tier 1) response team since it will identify the location and nature of the problem. After all, there is little use in having Tier 2 dive into the detailed diagnostics for the database system if the problem is elsewhere in the network.
In this case, the unified notification system shows alert notifications from the application monitor for poor response times and application errors. At around the same time, they can see that Redgate Monitor has raised deadlock alerts for a SQL Server instance, and associated blocking process and long running query alerts.
It looks like a database problem, so the frontline responder reviews the full alert details for the deadlock alerts in Redgate Monitor’s global dashboard. The Details tab of the Alerts screen in Redgate Monitor shows a graphical depiction of the deadlock graph:

The Tier 1 responder does not need the full details of the deadlock graph, but from this simple visualization, they can see the machine, application, and login name for the client who issued the SQL batches. This confirms that the associated application is the same one that reports slow response times and errors. They classify it as a database-related incident, document their findings, and immediately escalate the incident to the Operations team (Tier 2).
The operational (Tier 2) response: analyze, diagnose, contain
The Tier 2 responder immediately drills into the details of the deadlock incident. The graphical deadlock graph makes it easy to review the important details:
- Processes 52 and 55 are deadlocked:
- Process 52 needed to acquire an exclusive (X) lock on a page in the
dbo.Customerstable to update it, but was blocked since process 55 held an X lock on this page. - Process 55 needed to acquire a RangeI-N lock on rows in the
CustomerNameindex, to insert a new row, but was blocked since process 52 held a RangeS-S lock on this index on an overlapping range of rows.
- Process 52 needed to acquire an exclusive (X) lock on a page in the
The red border around SPID:52 indicates that SQL Server chose this process as the deadlock victim and rolled it back since the lock monitor estimated that it had the lowest rollback cost. This session receives the 1205 error, which was detected by the application monitor.
The Ops responder clicks on the deadlock victim to see additional details, including the full SQL text of the SQL batch issued by it:
|
1 2 3 4 5 6 7 8 9 10 |
SET TRANSACTION ISOLATION LEVEL SERIALIZABLE; BEGIN TRANSACTION IF EXISTS (SELECT 1 FROM Customers WHERE CustomerName = 'Tony Davis') UPDATE Customers SET <OrderDetails...> WHERE CustomerName = 'Tony Davis'; ELSE INSERT INTO Customers (<Columnlist>...) VALUES ('Tony Davis', <'OtherValues'>...); COMMIT TRANSACTION; |
Each session executes SQL to modify customer details, and the code uses the “upsert” pattern, which means “update the row if it exists or else insert it“. It requires use of the SERIALIAZABLE transaction isolation level to work correctly.
The Tier 2 team documents their findings and escalates to Tier 3 with the recommendation to investigate whether the code can be rewritten to avoid the need for the SERIALIAZABLE isolation level, and therefore prevent the associated blocking and recurrent deadlocks.
The SME (Tier 3) response: resolve, verify, prevent
Tier 3, led by a DBA, reviews the analysis and confirms that the deadlock stems from use of the SERIALIZABLE isolation level, which must acquire locks on a range of rows, rather than just the row to be modified, to prevent phantom reads. They also review the blocking process alerts and see that other processes trying to access the Customers table suffered delays. From the History tab for the alert, they can see the database has occasional deadlocks and an ongoing history of blocking issues.
For the deadlock alert, Redgate Monitor makes available the full Extended Events XML Deadlock Graph in the Output tab of the Alerts screen, which verifies this with details of the locking sequence:
|
1 |
<waiter id="process2ef3…" mode="RangeI-N" requestType="convert" /> |
So, both sessions receive RangeS-S locks on overlapping ranges of rows in the CustomerName index. Process 55 ‘gets in first’ and acquires an X lock on the underlying page in the Customers table, blocking Process 52’s request to lock that page. Process 55 then needs to convert the RangeS-S locks it holds on the index into the RangeI-N lock, to insert a row into the range. This lock is not compatible with the RangeS-S already held by process 52 so this request can’t be granted either and we have a deadlock.
The DBA proposes two possible solutions: rewrite the query to use the MERGE statement instead of the “upsert” pattern or switch to the READ COMMITTED SNAPSHOT isolation level, which avoids range locks while preventing phantom reads. After testing both options, the DBA selects the best solution, tests it, and requests the developer run the necessary tests to ensure it has no unforeseen impact on application behavior.
Once verified, the incident is documented, the fix is deployed, and the case is closed. As Tiers 2 and 3 start documenting known issues, their “footprints” and resolutions, the Tier 1 team can start using these documented remediation steps, resolving more incidents before they escalate.
Summary
The impact of database incidents like deadlocks, blocking, and long-running queries depends on how quickly and precisely your team, especially DBAs, can respond. Redgate Monitor detects and alerts your team to these and many other potentially disruptive events. It provides the detailed diagnostics they need to resolve incidents before they affect end users and the business. Redgate Monitor’s data, combined with a tiered incident response, creates a system where multiple teams can coordinate effectively on the response. From Tier 1’s rapid triage to Tier 3’s root cause analysis and long-term improvements, it ensures that each incident is handled by the right team, with the right data, at the right time. Over time, this system shifts the focus from firefighting incidents to preventing them through continuous improvement.
Tools in this post
Redgate Monitor
Real-time multi-platform performance monitoring, with alerts and diagnostics


