Understanding PostgreSQL’s Cache Hit Ratio
This article explores PostgreSQL's buffer cache hit ratio (BCHR), a metric tracked by Redgate Monitor to help you assess the health and performance of your databases. By correctly interpreting this ratio and using it with other relevant memory and IO metrics, you can identify potential bottlenecks in query execution before they impact users.
A high cache hit ratio generally indicates efficient memory usage in PostgreSQL, where most of the data pages required are being read from cache, minimizing costly disk reads. But how is this metric measured and tracked in Redgate Monitor?
What exactly is the cache hit ratio in PostgreSQL?
The cache hit ratio metric in Redgate Monitor refers to the buffer cache hit ratio (BCHR). It measures the percentage of data pages retrieved from PostgreSQL’s shared_buffers, an allocated region of server memory for caching. It’s computed using the blks_read and blks_hit metrics, which Redgate Monitor retrieves from pg_stat_database:
- Blocks hit (blks_hit in PostgreSQL) – the number of blocks retrieved from the shared_buffers memory (i.e. a cache hit).
- Blocks read (blks_read in PostgreSQL) – the number of blocks that were not in
shared_buffersand had to be read from disk (either the disk or the OS disk cache). - Buffer cache hit ratio – the percentage of total data pages within a particular timeframe, available from the
shared_bufferscache:
BCHR = ((blks_hit/ (blks_hit+blks_read)) * 100).
From this definition, we can see that high values of cache hit ratio indicate that the majority of data pages are being served from the buffer, which is much faster than an alternative disk read, and so will tend to be beneficial in maintaining sufficient query performance.
However, be sure to monitor additional memory and I/O-related metrics in conjunction with the cache hit ratio to validate any potential findings, such as block read time (available in the server overview). Overreliance upon cache hit ratio in isolation could otherwise be misleading.
In Redgate Monitor, you can view this cache hit ratio metric under the Efficiency section within the server overview page:

Graph of the cache hit ratio metric in the efficiency section of the server overview page
Interpreting cache hit ratio
How you interpret your cache hit ratio values will depend on the type of workload being executed. OLTP workloads typically have a smaller working set and more predictable data request patterns, so you’d expect BCHR to be high (above 95%, ideally close to 99%). OLAP workloads, on the other hand, will likely have a lower acceptable value (closer to 90%) due to the complexity of queries, and size of the working set.
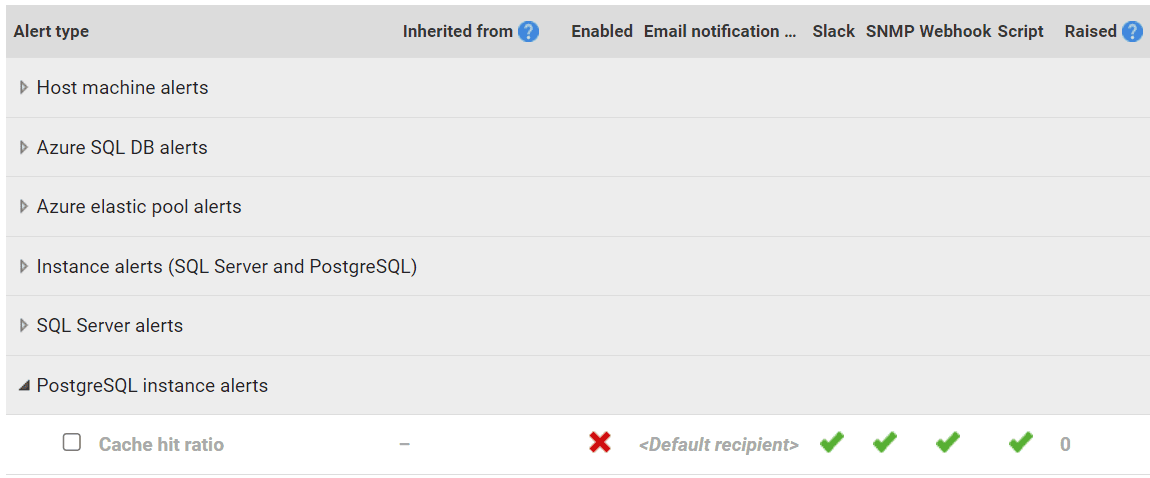
From version 14.0.27 and onwards, Redgate Monitor offers low cache hit ratio alerts for PostgreSQL. To configure alerts for this metric, navigate over to the alert settings page. Under ‘PostgreSQL Instance alerts’ you should see the ‘Cache hit ratio’ alert type:

Redgate monitors alert settings page with the cache hit ratio alert type
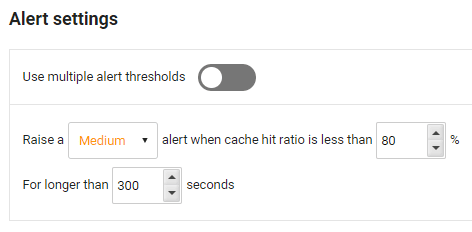
Clicking on this alert type will take you to a configuration page, where you can enable and specify single/multiple thresholds. This will notify you when your cache hit ratio falls below a certain percentage:

Configuration page for the cache hit ratio alert with a single alert threshold
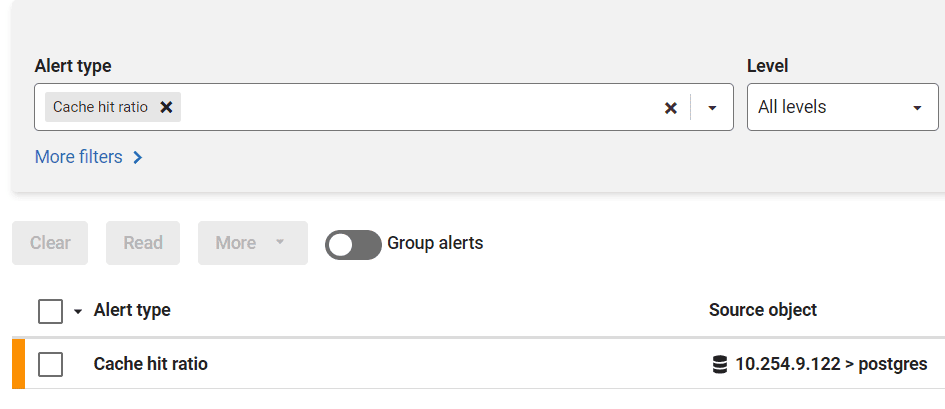
In the alert dashboard, we see a medium severity alert was raised for the cache hit ratio on a PostgreSQL instance:

How to improve a low cache hit ratio
A low cache hit ratio is often a cause of concern given the potential performance hit and may indicate insufficient allocation to shared_buffers. If your PostgreSQL configuration doesn’t allocate enough memory to shared_buffers, it will have to keep swapping pages in and out of the buffer from disk. Every time a page cannot first be located and read from shared_buffers, we refer to that as a cache miss. The higher the percentage of cache misses, the more likely query performance will deteriorate.
The default value for shared_buffers is 128MB but, provided enough memory is available, this setting should be modified to at least 25% of the total available memory, but certain workloads might benefit from settings as high as 40%
To view the current shared_buffers allocation in Redgate Monitor, got to the server configuration options section, within the server overview page:

A table of PostgreSQL server configuration options, as displayed in Redgate Monitor
If, after tuning the value of shared_buffers to suit the requirements of your workload, your cache hit ratio does not improve, this typically means that you need to tune your workload and queries to more efficiently access the data, or else increase the amount of total server memory to allocate more shared_buffers.
Another method for improving your cache hit ratio is through better indexing strategies. This may involve identifying (large) tables with excessive sequential scans from pg_stat_all_tables. By investigating queries using those tables, you’ll typically find that the predicate in their WHERE clause doesn’t have an index. Providing them with indexes should lead to a reduction in full table scans and potentially increase your cache hit ratio.
Measuring cache hit ratio in other database platforms
The utility of the cache hit ratio may vary depending on the type of database platform you are using. For example, in SQL Server the cache hit ratio is ineffective, proving to be unresponsive to memory issues. Using a combination of other metrics, such as page reads per second, is more informative. Oracle database also provides a computable buffer cache hit ratio using metrics available in its system statistics performance view. Similarly to SQL Server, however, its cache hit ratio has been largely disregarded in favor of alternative metrics, due to its approach to memory management. The cache hit ratio is typically more useful in PostgreSQL as it is directly related to the memory available specifically for data pages.
Summary
The cache hit ratio is an important value in PostgreSQL and can help to diagnose any causes of slow query performance. By tracking this metric with Redgate Monitor, you’ll be able to quickly identify points of concern. Whether it be an indication to upgrade your server or simply a configuration discrepancy, it provides valuable insight into optimizing your PostgreSQL setup.
Tools in this post
Redgate Monitor
Real-time multi-platform performance monitoring, with alerts and diagnostics


