Monitoring SQL Server Performance: What’s Required?
A monitoring tool must provide us with an understanding of the often-complex performance patterns that databases exhibit when under load, so that we can predict how they will cope with expansion or increase in scale. It must also helps us spot the symptoms of stress and act before they become problems that affect the service, and understand better what was happening within a database when an intermittent problem started.
There are three good reasons for monitoring and optimizing the performance of a database:
- Chronic performance problems: If a database is responding slowly, consistently, it is easy to assume that it is because you need more resources, or a different technology. Buying ‘more metal’, or increasing your cloud resources, is expensive once the full costs are factored in. Likewise, the cost of a new technology escalates quickly, once one factors in licenses and staff training. Such investments may seem like a logical solution, but without being able to investigate the cause of slow responses, it is reckless. You need to know why it is running slowly, what is causing the problem, before you can assume that an upgrade is the answer. Fixing a few rogue queries can result in a surprisingly rapid rejuvenation of a tired database and avoids these unnecessary costs and delays.
- Intermittent performance problems If a database has an intermittent problem, it is easier to solve if you can determine when it happens and under what circumstances. If you have a historical record of the most reliable performance indicators, or metrics, then you can compare activity over different periods, and it is then much easier quicker to and track down, and fix, the problem.
- Acute performance problems If you aren’t monitoring your database’s performance, you are in effect relying on your users to complain when the database is too slow for them to do their work. This isn’t a good idea, because few organizations will tolerate anything that impedes their business.
With responsibility for just a few servers, it is feasible to use SQL Server’s own tools to collect the diagnostic data you need to help you spot worrying changes or trends, but even then, it’s not an effective use of time. Unless the person responsible for providing an initial response to performance issues knows where to look to investigate, the mass of information available in SQL Server is little more than a distraction. The difficulty is often one of seeing the wood for trees, in other words of finding the root cause within the vast set of server metrics that might indicate resource contention, error conditions, and bottlenecks on the SQL Server.
Instead, the first stage is to have a monitoring tool that provides the equivalent of the eyes, ears and memory, will alert you to SQL Server databases not being ‘right’, and provide just enough information with the alert to direct you towards a probable cause. Once the nature of the problem is reasonably understood, you can then use various additional performance metrics available in SQL Server, if required, to drill into the details and confirm the diagnosis.
What should you look for in a monitoring tool?
What are the main requirements of a tool for monitoring performance issues? It must not only collect all the required performance metrics, over time, but also present, at the right moment, the relevant metrics, graphs and summaries that will give the investigator a reasonable clue as to the general category and likely cause of the problem. Additionally, it should:
- Detect whether any metric or combination of metrics is behaving unusually. It should present metrics in context, using a baseline. For example, is current usage typical of the day of the week, or the month of the year?
- Provide alerts with diagnostic information that is easily understood by a ‘first-responder’, who may lack detailed domain knowledge, and will also lead the experienced investigator intuitively towards the root cause.
- Alert you before an issue becomes a problem, providing graphs and data that can allow the DBA to estimate when abnormal trends in resource use, or server stress conditions, are likely to escalate into a performance problem that will affect the business It is harder to pinpoint the cause of poor performance once the phones have started ringing.
- Scale easily to monitor as many servers and database as required, across a range of platforms,
- Be non-intrusive and have minimal impact on the monitored servers and databases. A monitoring system must never, itself, cause performance problems.
Before discussing which metrics are required and why they are relevant, and what constitutes a useful graph and summary, I need to explain in more general terms the common signs of performance problems.
Tell-tale signs of potential performance problems
There are several trends that will give you advanced warning of performance problems. Amongst the more important are:
- Current performance is unusually slow.
- There is high processor pressure on the server.
- There are more incidents than usual of blocking, deadlocks and long-running queries
- There are an increasing number of waits of certain types
- Performance is degrading significantly worse than one would expect as the database size increases
- The use of memory and the disk-space required for logging is rising rapidly
As Grant Fritchey suggests, a good test of any monitoring tool is to write scripts to reproduce a couple of the main performance problems from which your systems suffers, and then assess how quickly the tool helps you spot the problem and determine a possible cause.
Collecting the diagnostic data
Both Windows Server and SQL Server have built-in performance tools, and we also have several popular tools from the community, such as sp_whoisactive, to troubleshoot performance. Some of these tools give general metrics, whereas others are designed to check very specific conditions that can confirm a theory of what is causing a problem. For example, is the cause of a long-running query a missing index, poor query logic such as an unSARGable filter, or an inappropriate hint? They may use extended events, perfmon, dynamic management views (DMVs), and traces to provide this data.
If performance issues persist after the DBAs are alerted to the problem, they are likely to be able to find the root cause using these tools. However, if the problem is transitory and intermittent, then it can get very difficult, because the detail you need has gone. By the time the issue is reported, it’s too late, and they must wait until it occurs again.
DBAs need a tool that collects the required diagnostic data continuously, at periodic intervals, so they can troubleshoot problems quickly, regardless of when they occur. Before effective database monitoring tools became available, DBAs had no choice but to create homebrew solutions, but it was always a tiresome distraction to create a tool to monitor the performance of SQL Server.
The work was extensive. An effective monitoring system must work across a large group of servers to ‘join all the dots’, across the entire server landscape. This entails writing scripts to collect performance metrics from all the databases being monitored and storing them in a dedicated database so that there is a history in place that can be researched and played back to the point when slowness occurs.
Writing the scripts and developing processes to gather the information requires a huge effort, especially for multiple versions of SQL Server, and this work distracts from other important responsibilities and tasks. The data from each of these sources is in a different format, and it’s also difficult to decide exactly what to collect. One set of metrics, for example, will be great for troubleshooting I/O issues while another set will be better for discovering the cause of blocking. As the number of monitored servers and databases grows, and server workload increases, you need to add new ways of spotting these tell-tale signs, and then diagnosing the cause, quickly.
Requirements for performance monitoring
There are any number of ways in which you’d want your monitoring tool to help you identify and diagnose performance problems, using the diagnostic data it collects, and here I can cover only some of the more obvious possibilities.
Connect server stress conditions quickly to their cause
Why collect and record so many metrics? That’s because it’s easy to be misguided about the cause of server stress conditions, if you only have one or two performance metrics to go on. High CPU use isn’t necessarily indicative of CPU pressure, just as high disk IO doesn’t necessarily indicate an overwhelmed or underpowered disk subsystem. The inter-relationship between CPU, IO and memory use on the database server is often complex. If users run complex queries that request large volumes of data, this will place demands on CPU, disk IO, and on memory required in the buffer cache to store all the data. Any or all of these could limit performance. You need to look at how individual metrics inter-relate.
Let’s say users are reporting slow database performance, and your monitoring tool tells you that CPU use is “high”. Does this mean that “processor pressure” is causing the performance issue? It depends! After all, if the server is busy then your processors are supposed to be working hard, to process all the users’ queries! A good monitoring tool will help you to quickly correlate this one metric with others that will confirm (or rule out) CPU pressure, and to the specific queries running at the time of the problem.
Is the CPU busier simply because the server is busier? Are the number of connections, or number of user requests per second higher than normal? You can only know for sure if your monitoring tool has a baseline for each of these metrics; in other words, if it enables you to quickly compare current levels to levels for the same metrics at the same time yesterday, or the same time over the past several days or weeks.
Is the CPU increase accompanied by a significant increase in the time that user processes spend simply waiting to get on the CPU? These frequent signal waits, together with high CPU usage, might indicate CPU pressure. Again, you’ll need a baseline for signal waits to establish this, and your monitoring tool should make it very easy to add a metric to collect this data, if required.
Your performance metric baselines might reveal that CPU pressure is normal in the last week of every month. At that point in the performance investigation, you’ll want to connect the server stress condition, whether high CPU, memory or I/O utilization (or all three), directly to long-running queries over that period. Often, excessive CPU use is caused by long-running, complex queries that simply require a lot of processing power. Poorly tuned T-SQL statements, and poorly designed indexes, can cause severe demand on all resources.
If you confirm the diagnosis of CPU pressure, for example, you’ll then want your monitoring tool to reveal the most CPU-intensive queries that were running at the time. In other words, you’ll want to see the costliest queries in the cache, ordered by total worker time (i.e. CPU time):
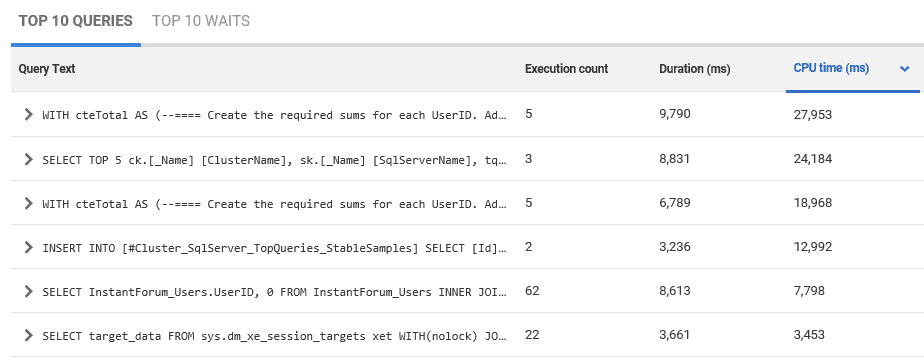
Perhaps they turn out to be the end-of-month business reports? You’ll want to see the SQL text and execution plans for these queries:

Are there opportunities to relieve the pressure by tuning these queries, or the database indexes? If not, can you take steps to optimize CPU allocation for that period. For example, if these are cloud-based servers, can you elastically expand to use more processors, and so optimize the performance of your important reporting queries?
Without the tools to see whether the bottlenecks are caused by poorly written queries or missing indexes, there is a temptation to increase the number of cores. With the help of a monitoring tool, a small number of queries can often be found that are causing most of the bottlenecks. Once those queries are identified, it is just a matter of tuning the queries and indexes involved.
Analyze server waits
Wait statistics area powerful tool in establishing most significant bottleneck on your SQL Servers. Every time a request is forced to wait, SQL Server records the length of the wait, and the cause of the wait (the wait type), which generally indicates the resource that the request was waiting for but couldn’t acquire. Waits may be related to parallelism, I/O slowness, or locking, for example. This is reported as overall aggregate values, collected since the last time the server was restarted. DBAs typically review waits to understand the stresses on the server.
Again, knowing that a certain wait type metric is “high” does not on its own indicate a problem. Your monitoring tool must help you correlate these with other metrics, and to drill-down on these waits to find the actual queries affected by them:

A good monitoring tool will also report the top waits over a period, so that the DBA can easily spot trends or outliers.
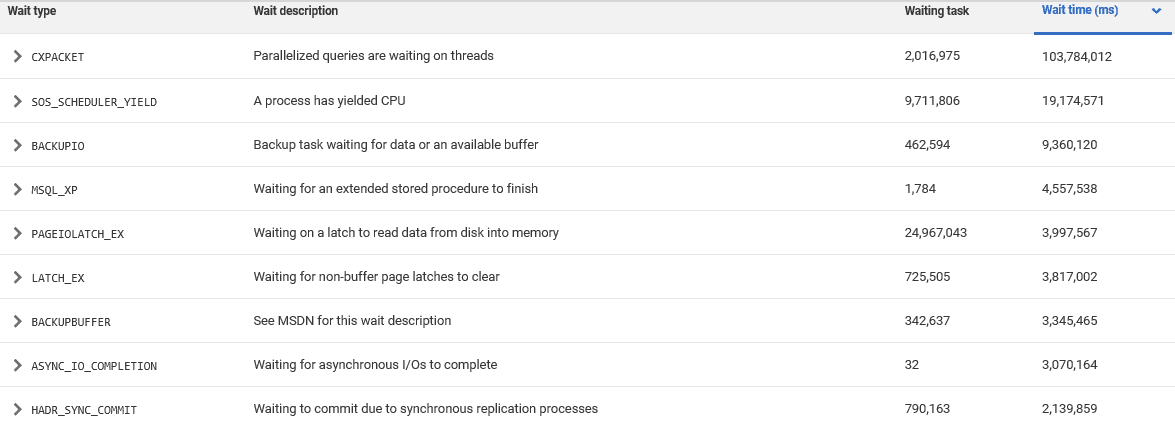
Let’s say you observe ‘high’ CXPACKET waits. Is this a problem? This type of wait will always occur when queries are running in parallel across multiple processors. A common misdiagnosis on seeing very high CXPACKET waits is that the parallel workload is saturating the disk IO subsystem. However, first, check the queries affected by these waits. If this is an OLTP system, where transactions ought to be short and fast, you’ll want to investigate those queries that are getting parallel plans and look for tuning possibilities. Similarly, excessive I/O waits, for example, could simply be a sign that a large table is being scanned, repeatedly, and that an index might help the query.
Fast real-time troubleshooting
As proactive as a DBA would like to be in heading off issues, before they become real problems, the monitoring tool will always still have an important role to play in helping resolve real-time performance issues.
If an important business server is experiencing severe performance problems, right now, then you’ll want to know very quickly what connections and sessions are affected, and what activity is occurring on the server. One of the ways a professional monitoring tool can really help, is not just detecting excessive ‘blocking’, or reporting that a deadlock occurred, for example, but also providing within the alert a list of the active processes and some simple visualizations of the blocking or deadlocking chain. The following image visualizes a blocking chain:
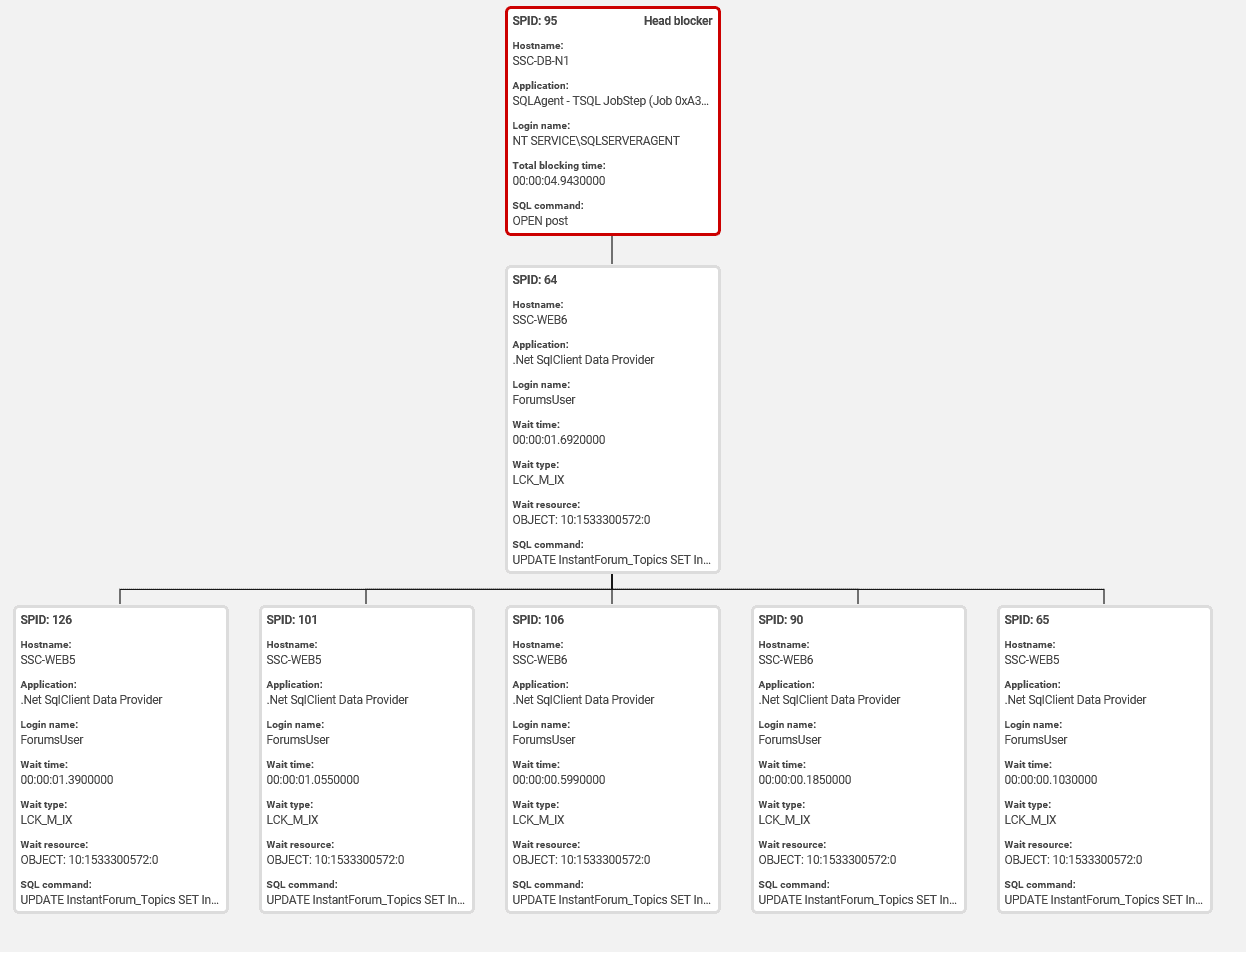
Blocking in SQL Server is like an intersection in a traffic jam. The query at the heart of the problem affects other queries, making them wait until the problem query is done running or killed. Frequent causes are excessive I/O because of scans against large tables or transactions left open after errors. Solving the problem in the short term involves finding the offending query and possibly killing the connection. A good monitoring tool will identify the cause of the blocking so that appropriate action can be taken.
A deadlock is a circular locking chain, because every processing the blocking chain will be waiting for one or more other processes in that same blocking chain, such that none can complete. This is a serious error condition that SQL Server resolve by killing and rolling back one of the processes. The DBA will need to investigate immediately to find out what caused the deadlock and take steps to prevent it recurring.
Before and After: Baselines
Another critical use of the monitoring data that we collect is to create visual baselines. These will help the DBA to understand if performance degrades predictably during certain time periods or if the current performance of the server is typical or out of the ordinary. They can also watch for changes as the data grows or the system becomes busier over time.
It is easy to assume that a baseline requires that you know what a metric looks like with no load on it at all, but that’s the wrong way to think about it. A baseline for any metric represents at least one reference point, but more often a series of previous reference points, against which we can compare the current value.
How frequently do we hear: “The server was slow yesterday” or “It was faster before we released the upgrade” or “It’s slow right now“? To validate the such claims, and find out the cause, we need resource usage data from yesterday in order to be able to compare it to today. For example, this chart shows one machine’s CPU usage behavior over a seven-day period:
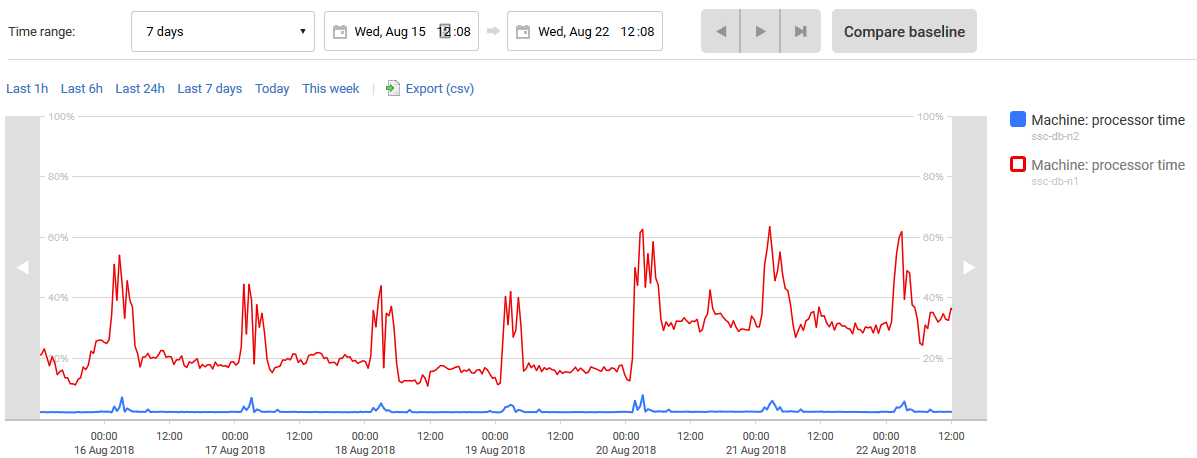
You can see that one processor has been running at a very low level, while the other has stepped up from processing at mostly below 20% to having sustained averages nearer 40%. If this trend continues, doubling every three or four days, we might be in trouble. So, let’s extend this to see the same information from the preceding week:
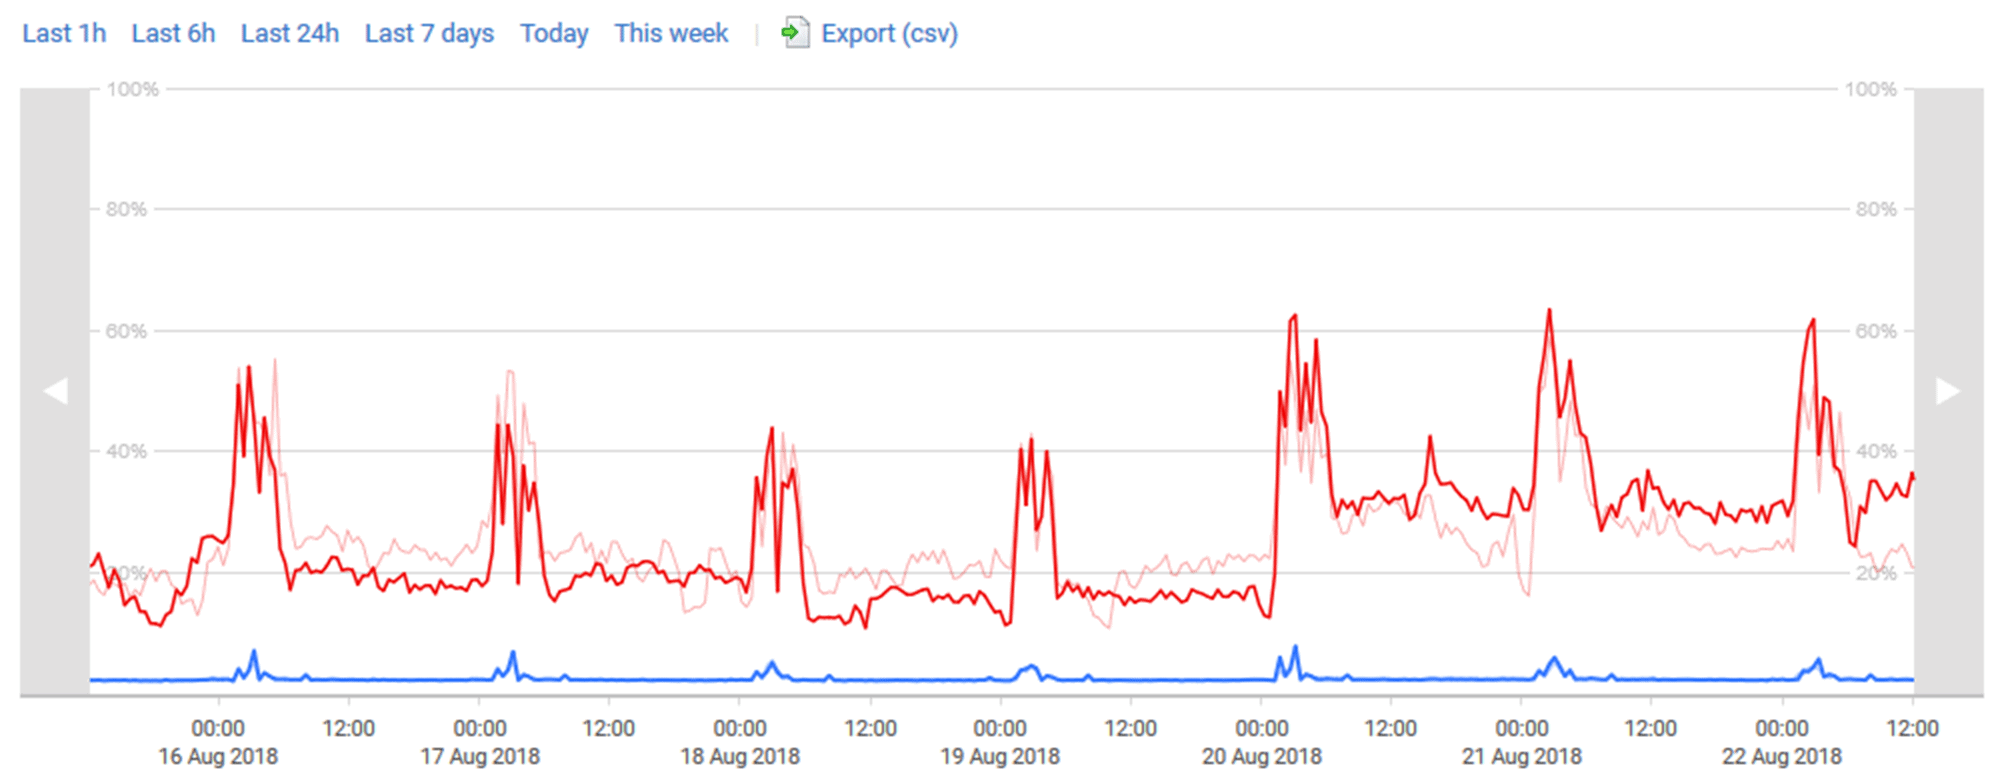
OK, we can relax just a little because we can see from the preceding week’s baseline that the behavior then was also characterized by several days of lower CPU use followed by a spike to more sustained use for a few days, on the busy processor.
However, we can see also that CPU usage on this processor is higher now than last week. Is this a disturbing trend? In support of possible optimization efforts, we need to determine if we’re seeing what can best be described as normal behavior, or if we are in fact seeing a trend that will lead to pressure on this this resource unless we take action, such as looking for ways to spread the load better over available processors during those busier periods.
Sometimes, if we look at data that is recorded over an insufficient period, we’ll fail to spot a worrying trend that requires corrective action. Continuing our example, one of the processors seemed to indicate that its behavior was changing. However, with only the two data sets for comparison, all we can really say is that they are different. If we add a bunch more data sets, say, the previous seven weeks’ worth of data, we might be able to spot if we’re seeing a trend in the information:
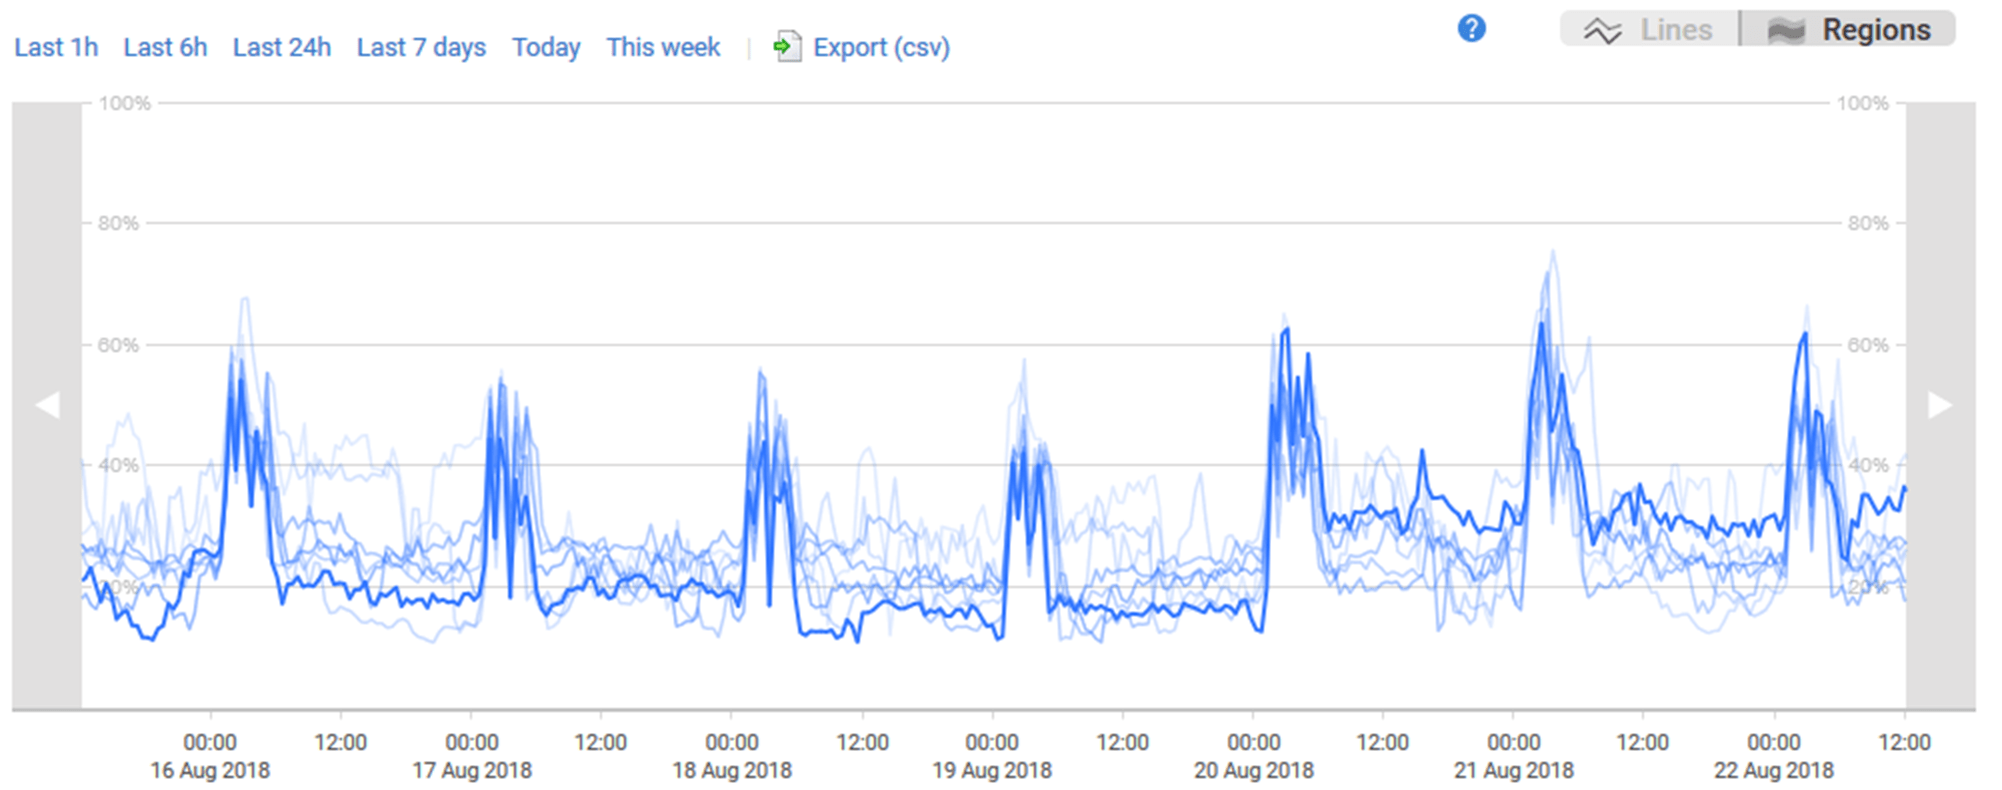
The darkest line is the current set of measures. Each dimmer line is going back in time. From this we can start to see that we’re probably not seeing a major shift away from normal behavior. Instead of looking all the raw data for the past, we can average the information out to get a better picture of whether the current data set deviates from normal:
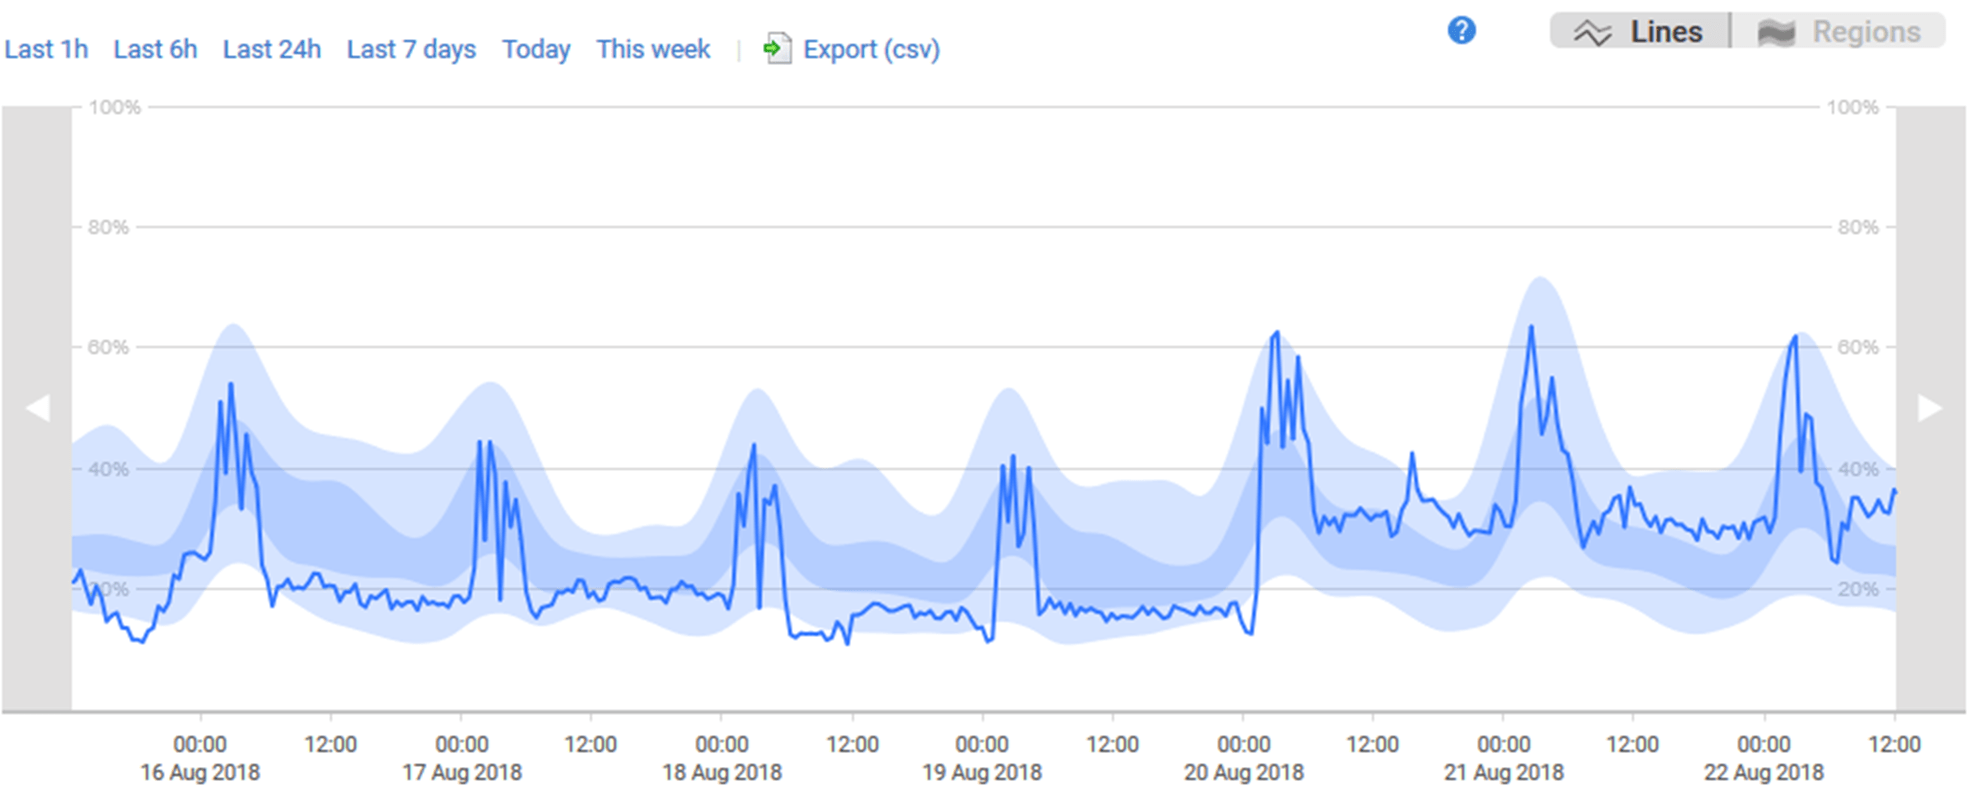
With the averages over time, we can tell for certain that the behavior of the last week falls well within normal behaviors. The darker zone represents the average behavior and the lighter zone represents the peaks and valleys. So, while there are some areas where normal behavior comes near the peaks, it doesn’t exceed them in any way.
In this case, it’s safe enough to say that this is within normal variance and we can focus on other potential issues. Similarly, this understanding of what is normal will also allow you to dismiss anomalies, and odd behavior, when that anomaly is just an outlier and not an indication of a broader problem.
Conclusion
Databases are extremely complex even before we try to understand their behavior under load, in production use. We need that understanding about performance in order to predict how they will cope with expansion or increase in scale. We need to prevent symptoms of stress becoming problems that affect the service. We need the information that allows us to make intelligent decisions about hosting. We also need an understanding of what was happening within the database when an intermittent problem started.
All RDBMSs have diagnostic tools, but they are best used after the general nature and context of a performance problem is understood, especially if time is short and issues need to be tackled before the users complain. As the workload of operational staff increases, it pays to have a system that can maintain a watchful eye on the whole landscape of servers, and will provide alerts when any combination of metrics show a disquieting trend.
Tools in this post
Redgate Monitor
Real-time multi-platform performance monitoring, with alerts and diagnostics
