


Per-backend IO stats in PostgreSQL 18
One of my favorite new PostgreSQL 18 features which hasn't had much attention yet is tracking session-level IO stats. It's going to be really helpful for more quickly finding problematic queries in real-time – kudos in particular to Bertrand Drouvot for the work on it!
What's the problem?
It's easy enough to know when you're under IO pressure - views like pg_stat_io give you a high-level understanding, as can OS-level or disk-level tools & metrics. But until now, working out where that activity is coming from could be quite an involved process.
For in-flight queries, often I've had to ssh into a machine, using tools like iotop to work out which processes are heavy on IO, before marrying those up to process ids in pg_stat_activity to work out which query is responsible. It's fiddly, and of course if you're using a DBaaS offering to run PostgreSQL, you most likely won't have that option anyway because of the limited access to the underlying environment.
You'll also see a query's IO impact in pg_stat_statements by looking at columns like shared_blks_read (assuming that extension is installed). But that logs queries only after they've finished executing, which won't help you if the guilty one hasn't finished running yet. That's often the case for example with ad-hoc reporting queries, which can be notoriously IO-heavy, and are invisible in pg_stat_statements while they're still in flight. Even assuming a query has finished running, the pg_stat_statements view typically shows each query's cost over all time, so unless you use snapshotting techniques it's also tricky to work out whether the reported IO activity is recent, or just relates to something which might have happened months ago.
Enter per-backend IO stats
PostgreSQL 18 introduces two new functions, pg_stat_get_backend_io() and pg_stat_get_backend_wal(). When passed the id of a process, those two functions provide a wealth of information covering reads, writes, evictions, fsyncs, timing (if track_io_timing / track_wal_io_timing are enabled), write-ahead log use, and more.
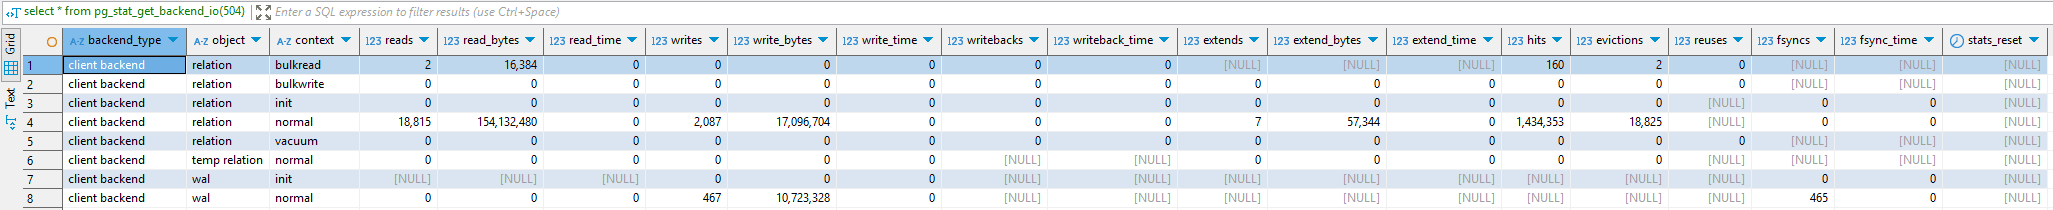
Example output of pg_stat_get_backend_io(pid)
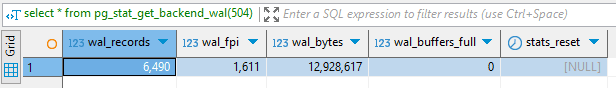
Example output of pg_stat_get_backend_wal(pid)
More importantly, you can combine this information with pg_stat_activity, allowing you to identify which sessions are responsible for most IO. For example:
|
1
2
3
4
5
6
7
8
9
10
11
12
|
SELECT
a.pid,
any_value(a.query) query,
pg_size_pretty(sum(io.read_bytes)) read,
pg_size_pretty(sum(io.write_bytes)) written,
pg_size_pretty(sum(wal.wal_bytes)) wal
FROM pg_stat_activity a
LEFT JOIN pg_stat_get_backend_io(a.pid) io ON true
LEFT JOIN pg_stat_get_backend_wal(a.pid) wal ON true
GROUP BY a.pid
HAVING sum(io.read_bytes) > 0
ORDER BY sum(io.read_bytes) DESC
|
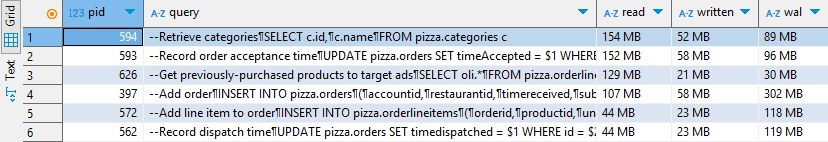
Example output of identifying sessions with most read activity
This data is so useful that in pgNow, Redgate's free PostgreSQL troubleshooting tool, we show it by default when looking at live session information on a PostgreSQL 18 instance. It's the ideal way to quickly determine which sessions are most likely to be worth exploring, without the complexity that other approaches have needed in the past. Having identified a session of interest, the drilldown lets you dig into richer information like stats on the tables referenced by the query, an explain plan, and more.
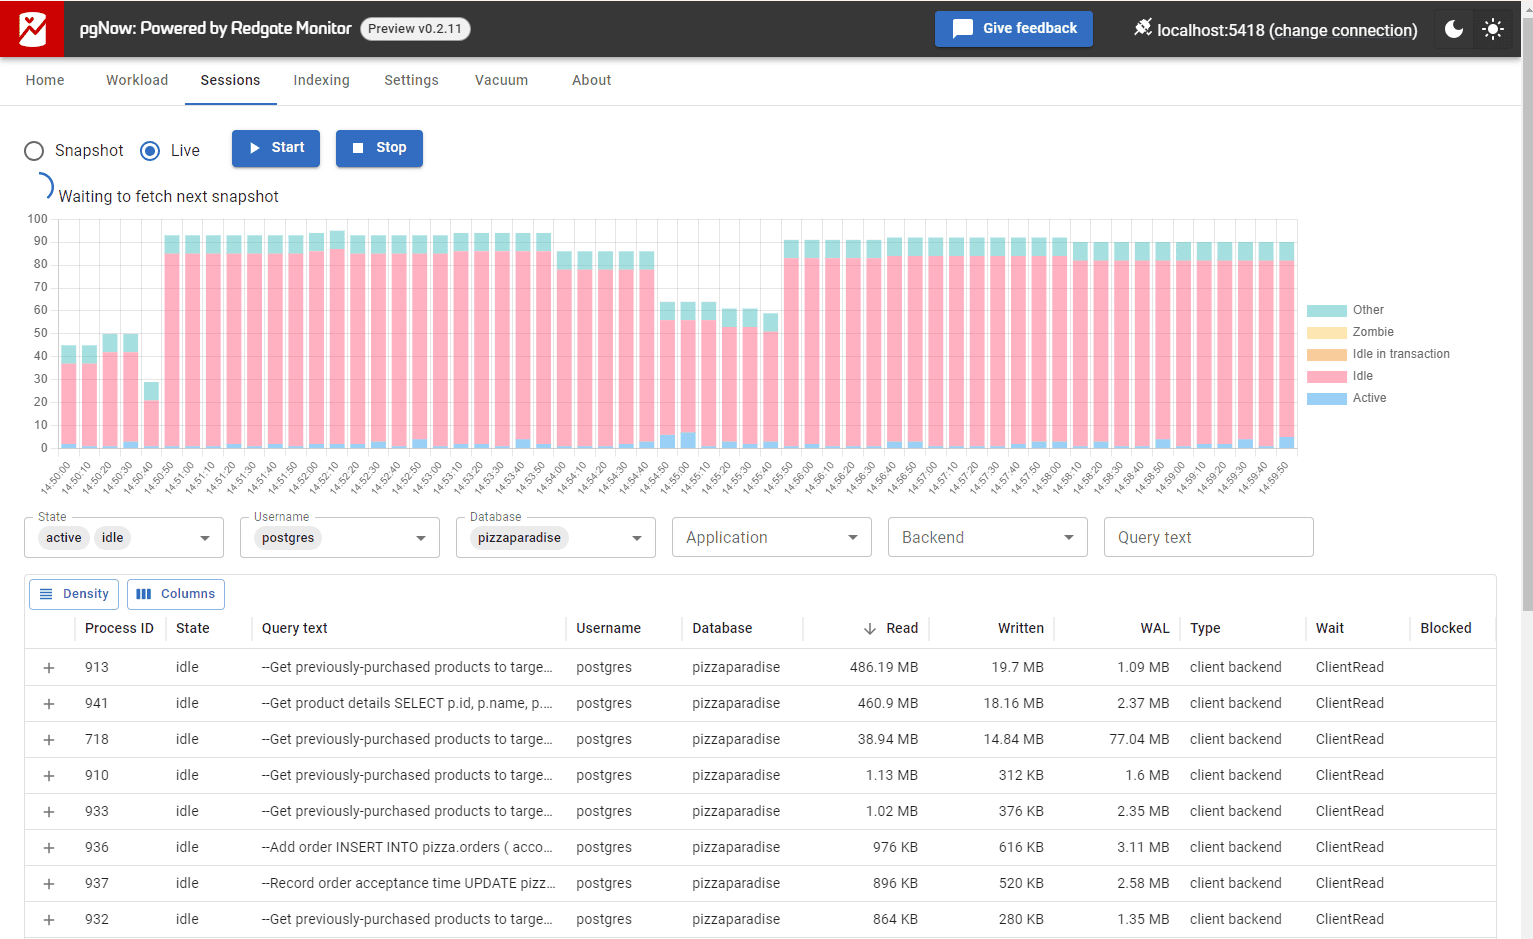
Session-level IO activity in pgNow
You can also easily use this data to group IO activity by other facets, like the Login or Application, further simplifying exploring the data.
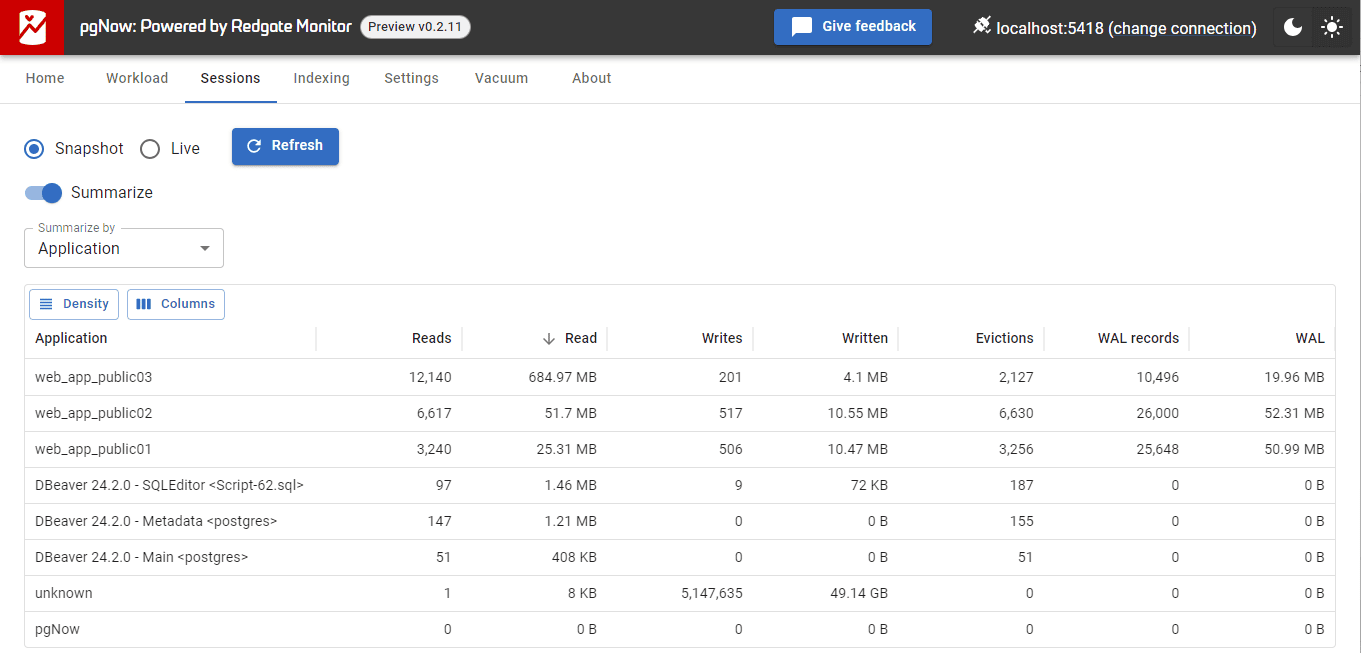
Session-level IO activity grouped by application in pgNow
A word of warning
PostgreSQL records these stats for the lifetime of a session, so when a connection gets reused to run multiple queries, the data you're seeing is the total cost of all queries which have been executed on that connection.
That means, for example, that if you have a web app which uses connection pooling to maintain a few live connections, what you're seeing in this view is the cost of all the workload which happens to have been run on that same connection, while the reported query is just the most recent one which was executed on it.
When looking at a session with high IO, it's certainly therefore possible that it was a previous query on the connection, rather than the most recent one, which was responsible for that IO activity – do bare that in mind.
When can you use this?
We're a few months away from the official PostgreSQL 18 release so it's not quite ready for production use yet, but Beta 1 is available for testing now. This information is shown in pgNow v0.2.12+.
I'd be interested to hear whether you're similarly excited about this capability!
This document contains proprietary information and is protected by copyright law.
Copyright © 2026 Red Gate Software Limited. All rights reserved
You may also like

Blog
Loading comments...