Security and compliance
Ensure data security and compliance with data masking, monitoring, and change traceability
When you want to add or remove data, use lists instead of arrays. Lists grow dynamically and don't need to reserve more space than is needed, whereas resizing arrays is expensive. This is particularly useful when you know what the pattern of growth is going to be, and what your future pattern of access will be.
The Garbage Collector is very good at working out appropriate times to run, influenced by factors like .NET memory usage in the application and OS memory pressure. It's almost never necessary to call it explicitly.
Worse, running a Garbage Collection has an impact on application performance. The performance hit is proportional to the number of objects in memory which survive Garbage Collection, so running the Garbage Collector earlier or more frequently than necessary can seriously harm performance.
Over time the .NET GC has become more advanced (most notably the Background Server GC Mode in .NET 4.5), but there are still situations where the GC can have an adverse effect on your application's performance.
Understanding how to detect these situations and more importantly how to fix them is a useful skill. For example, in many applications there are some actions which are more performance-critical than others, and it would be preferable for Garbage Collection to run during the less critical periods. Setting a GCLatencyMode is a useful way of asking the Garbage Collector to be more conservative about choosing to run during these times.
Memory leaks can have an impact on performance as well. When I suspect memory leaks, I often start my investigation by plotting managed vs. unmanaged memory usage against the target process in Performance Monitor. I find this can often give some preliminary and qualitative indications about the number and nature of the memory leaks and the way they change with time or in response to external input.
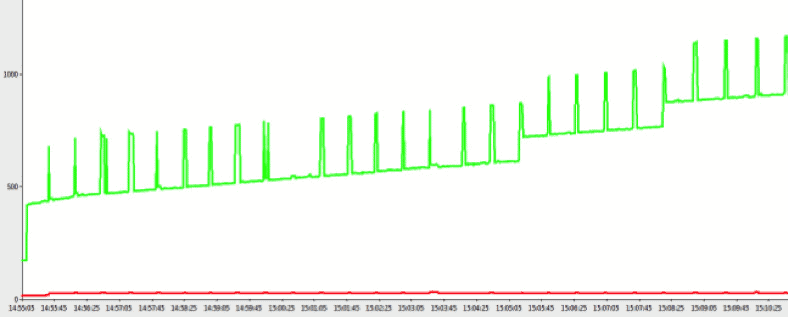
As an example, on one occasion I started with:

This confirmed the process was leaking unmanaged memory. It also gave me some initial indications that there could potentially be several causes because the graph shows some random steps in addition to the constant gradient slope. Fixing the cause of the constant leak resulted in the following:

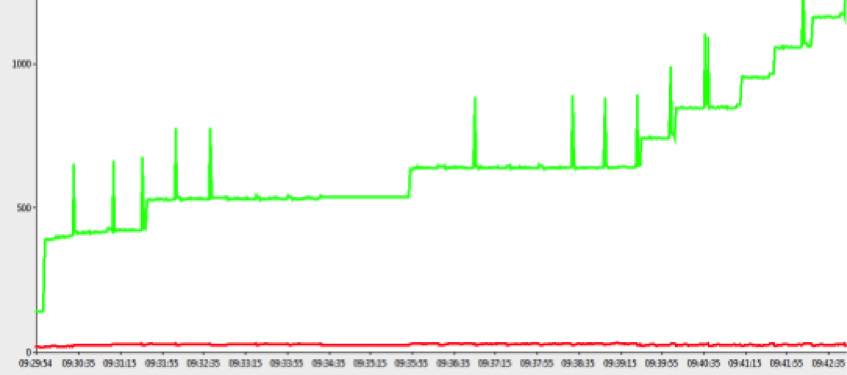
The slope was clearly gone but the occasional random steps were still present. This was harder to find but it soon became clear what component was responsible for it because after disabling it I obtained a flat tracing with occasional spikes:

Finally, having located and fixed the leak in the identified component, the following graph provided me with the reassurance that all issues had been found and addressed:

Many objects like memory stream, list, and dictionary will double their size as needed causing wasteful copying and allocations. If you know your list will have 100,000 items, initialize it as such to avoid problems in the future.
String referencing duplication is one of the major memory hogging performance issues. String interning is a useful solution if you're generating a lot of strings at runtime that are likely to be the same. It calls IsInterned to see if an interned string exists as follows:
class Program
{
	static void Main()
	{
		// A.
		// String generated at runtime.
		// Is not unique in string pool
		string s1 = new StringBuilder().Append("cat").
		Append(" and dog").ToString();
		// B.
		// Interned string added at runtime.
		// Is unique in string pool.
		string s2 = string.Intern(s1);
	}
}
My own benchmarking showed that string interning can improve performance by more than four times when the string comparison is always true.
File I/O, network resources, database connections, etc, should be disposed of once their usage is complete, rather than waiting for the Garbage Collector to handle them. This can take anything from milliseconds to minutes, depending on the rate you consume memory in your code. If you don't use a lot of, it will take a long time.
These types of resources typically implement the IDisposable interface so that unmanaged resources can be released once use of the object is complete.
Ideally, use a 'using' {..} block to automatically dispose the object once out of scope, or ensure you manually call Dispose().
For more information, see: https://msdn.microsoft.com/en-us/ library/498928w2.aspx
