VMware Monitoring in Redgate Monitor
Jon Hayman reviews how the metrics available in Redgate Monitor can help you diagnose problems that might come from SQL Server running in a virtual environment.
Over the years, running SQL Server inside a virtual machine has changed from being a bit of a strange and risky idea to being commonplace and offering a range of benefits: more effective distribution of load, more flexible provisioning and allowing additional tiers of redundancy to be put in place.
Though these factors are compelling, running your database inside a virtual machine introduces an additional set of variables to worry about. While a situation might look completely fine from inside the virtual machine, for example, other virtual machines running on the same physical host might have a dramatic effect on SQL Server performance by contending for the CPU, memory, network or physical I/O subsystem. If you’re running SQL Server on a VMWare box, and its performance is suffering, the task of diagnosing the root cause of the problem is no different from any other SQL Server. However, when a SQL Server is running within a VM, the way that the host machine allocates resources to the individual VMs is an extra factor that you’ll probably need to consider. This requires a few additional, ‘specialist’ metrics, tailored specifically for SQL Servers running on VMWare, so that you have diagnostic data about the VM side with the SQL Server metrics.
Performance metrics for monitoring SQL Server in a Virtual Machine
When SQL Server is running in a VM, we need to collect some additional metrics to help us understand resource allocation, use and contention, both on the VMWare server and on the individual Virtual Machines running the SQL Server instances. Generally, the host machine’s resources are over-committed. For example, the hypervisor can overcommit CPU by allocating two vCPUs to each of ten virtual machines, even if there are only twelve physical CPUs on the host machine. Likewise, the host’s memory is likely overcommitted too, since the hypervisor can share memory among machines to cope with demand and, if necessary, recover memory from VMs that aren’t using it and redistribute it to those that need it.
This is fine generally, but if the host is too over-committed, then during busy periods it can cause resource allocation contention within the VMWare system. These specialist VMWare metrics will help you spot signs of these problems. For example:
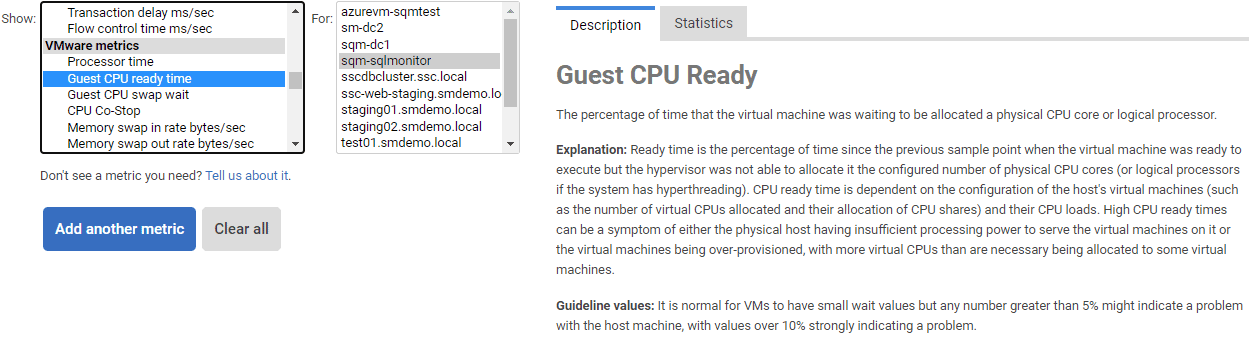
- Guest CPU ready time – consistently high values indicate that the vCPUs for a VM are often waiting in a queue to be allocated processing time (in the example above, although there are 20 vCPUs allocated, only 12 physical CPUs can ever be running tasks for each of the VMs, at any time).
- CPU co-stop – often caused by over-allocation of vCPUs to a VM, this indicates the extent to which vCPUs are being forced to pause processing, during parallelized execution of a request, in order to reduce “skews” in progress across all the vCPUs.
- Effective VM speed MHz – if values are consistently a lot lower than the theoretical maximum (host processor speed times the number of vCPUs) you’ll need to investigate why a VM is not getting its allocated “CPU power” from the hypervisor.
- Guest Memory Ballooned – If the host is under memory pressure, it will use techniques like ballooning to reclaim memory from the guest VM.
- Memory Swap Out Rate – more drastically the host may use memory swapping, forcing in-memory pages on the VMs to be written to disk.
Ballooning and memory swapping will cause SQL Server to take sometimes drastic measures to reduce memory usage and can cause severe performance problems, so you’ll want to detect these problems quickly and set alerts.
Collecting the metrics: Adding a VMWare host
We’ve tried to make getting started with monitoring SQL server running in VMware as straightforward as possible. Simply enter details of the vCenter, or the ESXi host if you’re running a standalone host, and Redgate Monitor will automatically detect any SQL Server instances controlled by it. You’ll need to convince whoever runs your vCenter to give you read-only access: they should be receptive to the argument that keeping track of the hardware SQL Server is running on is an essential part of your job.
Once you’ve done this, simply click on a server from Redgate Monitor’s dashboard, and from the Server Overview page, you can scroll down to the VMWare Metrics section to see plots of some these dedicated metrics, which will help you to diagnose CPU, memory, and IO uses, on your VMWare machines:
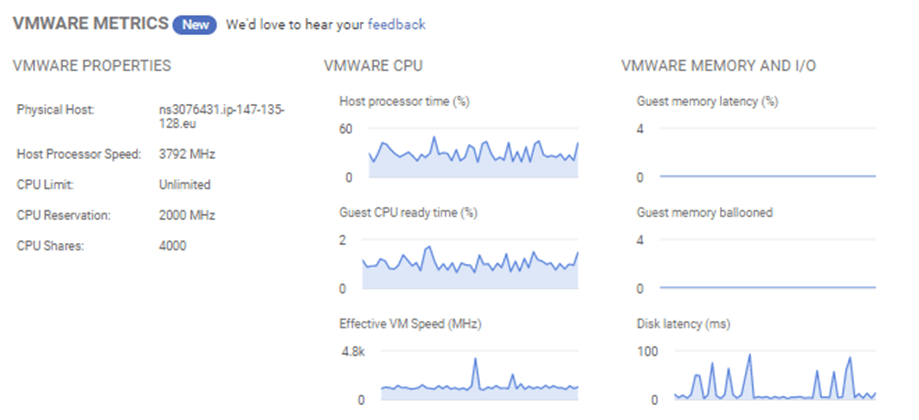
You can find a full list of the available VMWare metrics, with descriptions of each, by going the Analysis page in Redgate Monitor, and scrolling down to the VMWare Metrics section of the Show: box, below the Analysis graph.
Diagnosing performance issues on a SQL Server running in a VM
Over time, as Redgate Monitor establishes baselines for these metrics, you can identify if a guest virtual machine, or host server, is being overutilized (or even under-utilized). This will also help you maintain a healthy balance of resource allocation, determine appropriate “reservations” for a VM, if necessary, and so on. If a guest VM’s CPU or memory or IO resources are under-allocated, then SQL Server performance will suffer. However, if a VM is over-allocated, then it can cause problems on other VMs.
On the Analysis page you can plot the VMWare metrics on an analysis graph, which allows you to correlate their behavior directly with other standard machine and SQL Server metrics. You can also compare behavior of a set of metrics over a certain period to the baseline behavior and quickly spot unusual patterns of behavior.
This will help you see if a SQL Server instance is memory-bound or CPU-bound. This will also help you determine, quickly, if the cause of a problem is SQL Server-related (inefficient queries, poor indexing, and so on), which Redgate Monitor in turn will help you diagnose, or rather a problem with resource allocation in the VMware system.
Let’s look at a few examples of how the new metrics available in Redgate Monitor can help you diagnose problems that might come from SQL Server running in a virtual environment.
Server/host metrics
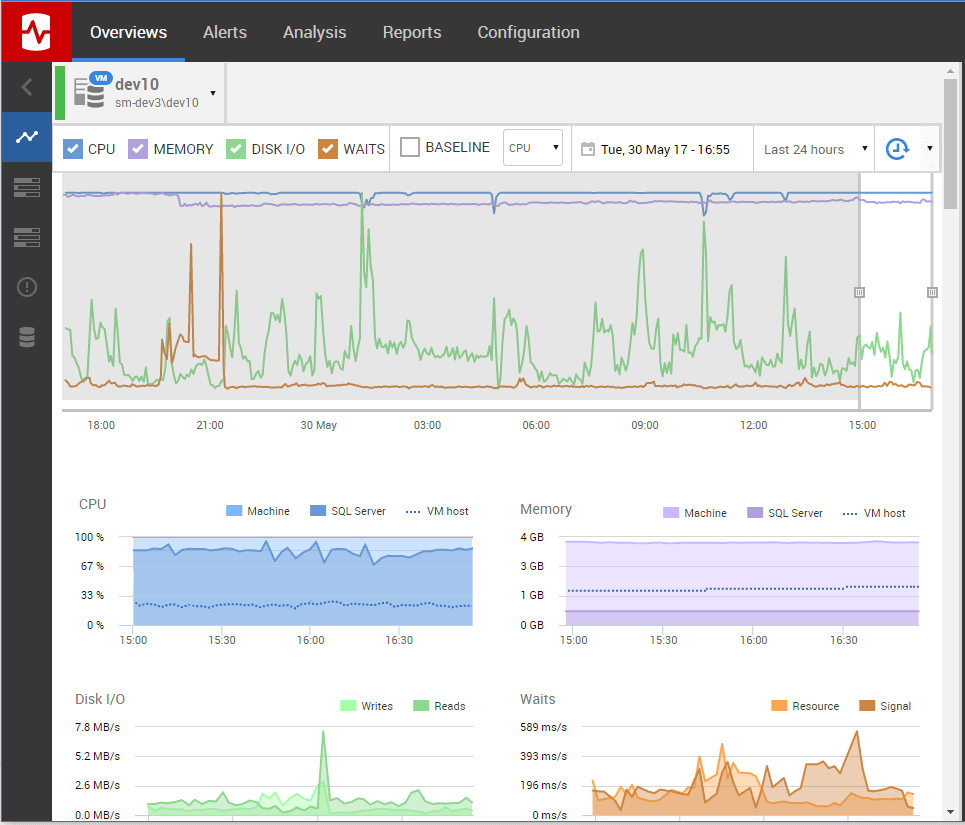
The following screenshot shows the Server Overview screen for a SQL Server instance running inside a VM. We can see that SQL Server is taking up almost 100% of the CPU on the virtual machine, but the physical host’s CPU (indicated by the dotted line) is low. This helps you straight away: it suggests that your virtual machine might be under-provisioned and could be reconfigured with more vCPUs or with a lower CPU limit.
Diagnosing CPU problems
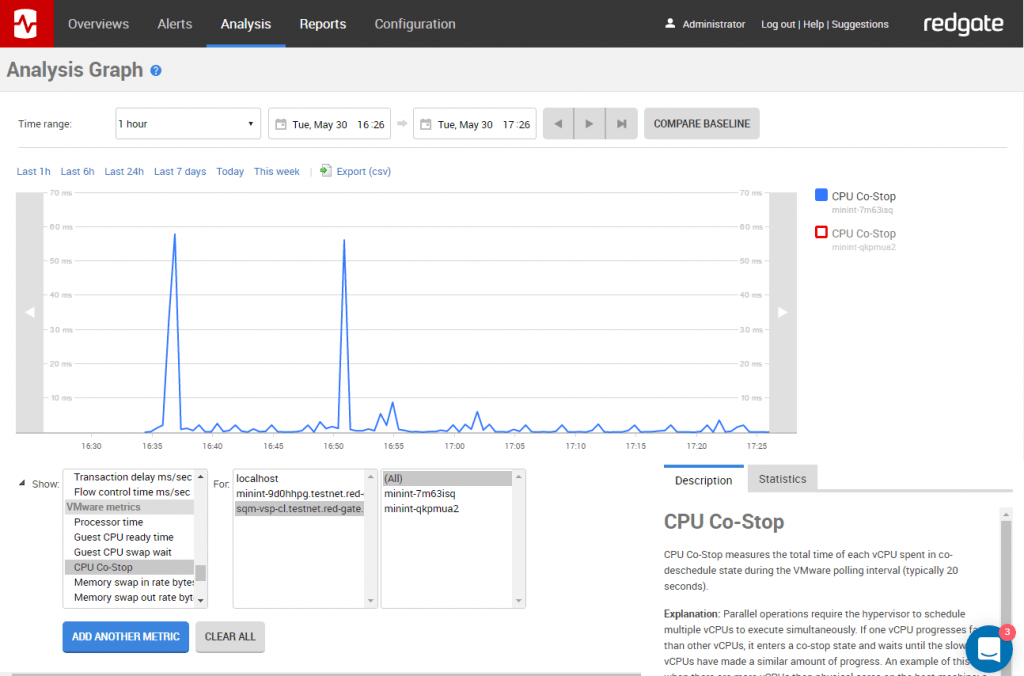
We can review CPU metrics such CPU ready time, CPU co-stop as described above, to investigate whether CPU allocation issues are causing performance issues for SQL Server. When running an expensive query that needs to be parallelized, all the vCPUs allocated to a VM need to be scheduled to run simultaneously, and the hypervisor needs progress across each vCPU to be relatively “synchronous”, meaning that is has to be able to allocate physical CPU to all the vCPUs. Sometimes, if the virtual machine is configured with too many virtual CPUs or the physical host is under significant load, it’s not possible, and some vCPUs are forced to “co-stop” waiting for other vCPUs to catch up. This will significantly degrade SQL Server performance over this period.
The following screenshot shows the CPU co-stop metric for a virtual machine (different from the one above), showing frequent significant spikes in the total co-stop time across all vCPUs. The normal recommendation is for this to be almost zero, so you’d want to investigate potential over-allocation of vCPUs as well as other possible action such as tuning the parallelized operation, or shifting its execution to another host.
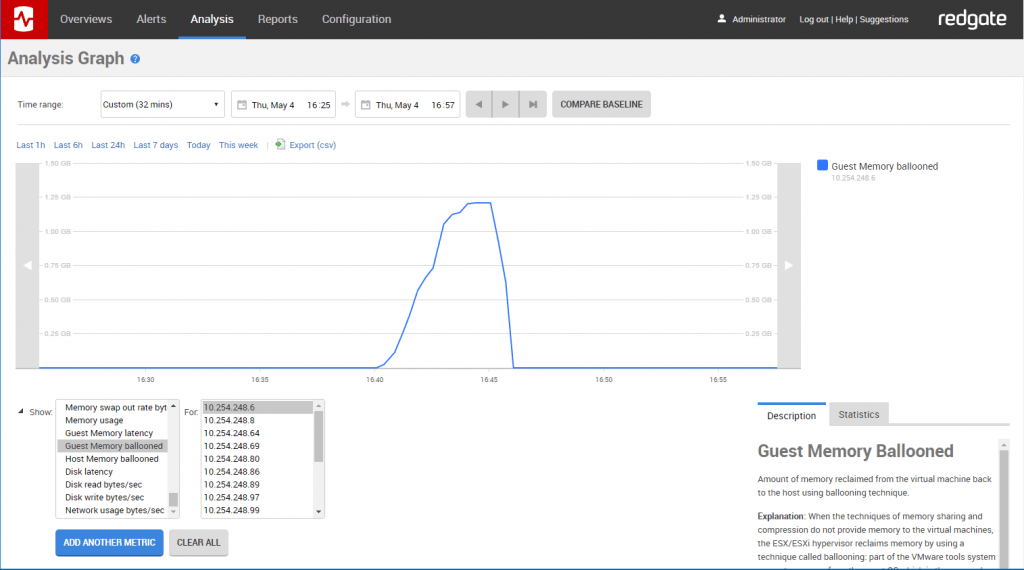
Diagnosing memory pressure: guest memory ballooning
In the following example, we can see ballooning, one of the techniques used by the VMware hypervisor to reclaim memory from virtual machines. It works by a fake device driver requesting memory from the operating system, which in turn prompts running applications to garbage-collect or otherwise release memory. This can have a dramatically adverse effect on SQL Server performance: SQL Server typically takes as much memory as possible for its cache, and ballooning can force the operating system to page this cache out to disk.
Summary
These are only three of the new metrics available in Redgate Monitor. We’ve tried to give you the metrics that are most important to understanding SQL Server performance, and they’re all accompanied by comprehensive explanations of what they mean.
However, we are always looking to do more. As this is in beta, we’d love your feedback on this feature. We’ll be looking very closely at any suggestions and making some changes along the way. To make the feedback process easier we’ve added Intercom Messenger chat so you can talk directly to us (there’s a little icon that pops up when you’re using the new VMware parts of Monitor). You can also get in touch through User Voice.
If you’re running your SQL Servers on VMware, be sure to download the latest version of Redgate Monitor now and tell us what you think.
Tools in this post
Redgate Monitor
Real-time multi-platform performance monitoring, with alerts and diagnostics
You may also like
-

Article
PostgreSQL Explain Plans in AWS Aurora
I recently wrote about a project I created on AWS Aurora PostgreSQL where I’m capturing APRS data from a radio. I focused on the ease of use, getting a database, some Lambda Functions, and a few schedulers working together with a web page. It was easy. However, I’d like to focus on a slightly different
-

Article
Tagging SQL Server Changes in Redgate Monitor
How to use RAISERROR() in T-SQL to send annotations to Redgate Monitor, so you can observe the direct impact of application tasks, or server changes, on the SQL Server metrics.
-

Webinar
Monitoring in the cloud: managing migrations and performance
In our 2020 State of Database Monitoring report the challenge of migrating your databases to the cloud, and monitoring them once they are there, came out as the biggest theme. Join us to discover the best practices for migrating to the cloud and how you can go about monitoring your cloud-based databases.
-

Webinar
Database monitoring in Azure
More and more organisations are managing some part of their SQL Server data in the cloud or across hybrid environments. According to Gartner, by 2022, 75% of all databases will be deployed or migrated to a cloud platform. In this webinar, we will be discussing what organisations need to consider when migrating to Azure, and why having a monitoring strategy is critical for ensuring the performance and availability of its databases and servers. Join Redgate’s Anderson Rangel, in conversation with Microsoft Cloud Solutions Architect, Tanya Smith
-

Business leaders webinar
Gain the competitive edge with a monitoring tool
Regardless of industry, data is one of the most valuable assets a company has. Every senior leader should be thinking about how to reduce risk, meet audit and compliance requirements and protect their business’ reputation. Robust database monitoring is at the heart of ensuring business continuity, customer satisfaction and protected revenue, and this webinar will clearly demonstrate why.