The Changing Role of SQL Server Monitoring
Grant Fritchey explains how a modern monitoring tool must adapt, as our SQL Server databases grow in number and size, and migrate onto new cloud-based, containerized or virtual machine-based SQL Servers.
In organizations that need to monitor a large population of SQL Servers, many of which are highly available, it’s inevitable that an increasing proportion of server supervision will be done by an operations team who are skilled and resourceful but haven’t the specialized knowledge of an experienced DBA. Any modern monitoring tool must account for this broad range of skills in its users. The data that the monitoring tool provides must be accessible, and can’t assume prior knowledge. The role of the tool becomes not just to collect the metric values and return them, but to analyze the data and present it simply and visually, with baselines. The tool must allow any first responder to decide how to act, or at least determine who else needs to be informed of the issue.
The tool must also make it very easy for the team to add new servers to the monitored estate, regardless of where they reside, without adding significant monitoring overheard. It must also allow them to adapt the monitoring strategy quickly, for the specific needs of certain servers, according to the platform on which the reside, or data they store, or the business processes they support.
Intuitive, web-based diagnostics
It’s often stated that the best test of your organization’s disaster recovery plan is whether the documentation is of sufficient quality that, with an impending problem, a ‘first responder‘ can take urgent remedial action, rather than wait for the expert. The same rule applies to the monitoring tool that ‘documents’ the health of your SQL Servers.
Therefore, a good test of any monitoring tool is to write scripts to reproduce a couple of the main performance problems, or error conditions, that your systems currently experiences, and then assess how quickly the tool helps a ‘first responder’ to detect a problem and determine a possible cause.
Like many DBAs, I’ve spent a lot of time, over the years, building out a monitoring solution of my own. We wrote scripts, created a few reports based on the data collected, and relied on SQL Agent to deal with any alerting necessary. To any DBA, this will seem like a common-sense approach. However, as the number of servers and database grows, you start to run into difficulties, one of which is that the output of these tools tends to be a ‘wall of numbers‘ that only an experienced DBA can penetrate, so it immediately fails the ‘first responder’ test. Eventually that DBA becomes a bottleneck as only he or she knows how to interpret the diagnostic data.
Any tool that will flag up problems anywhere in a large population of servers needs a web-based, graphical front-end that makes the diagnostic data accessible to any authorized users, on any device that has a web browser. It should provide, at the top level, an easy-to-digest picture of activity and any issues and alerts, across all your monitored servers.
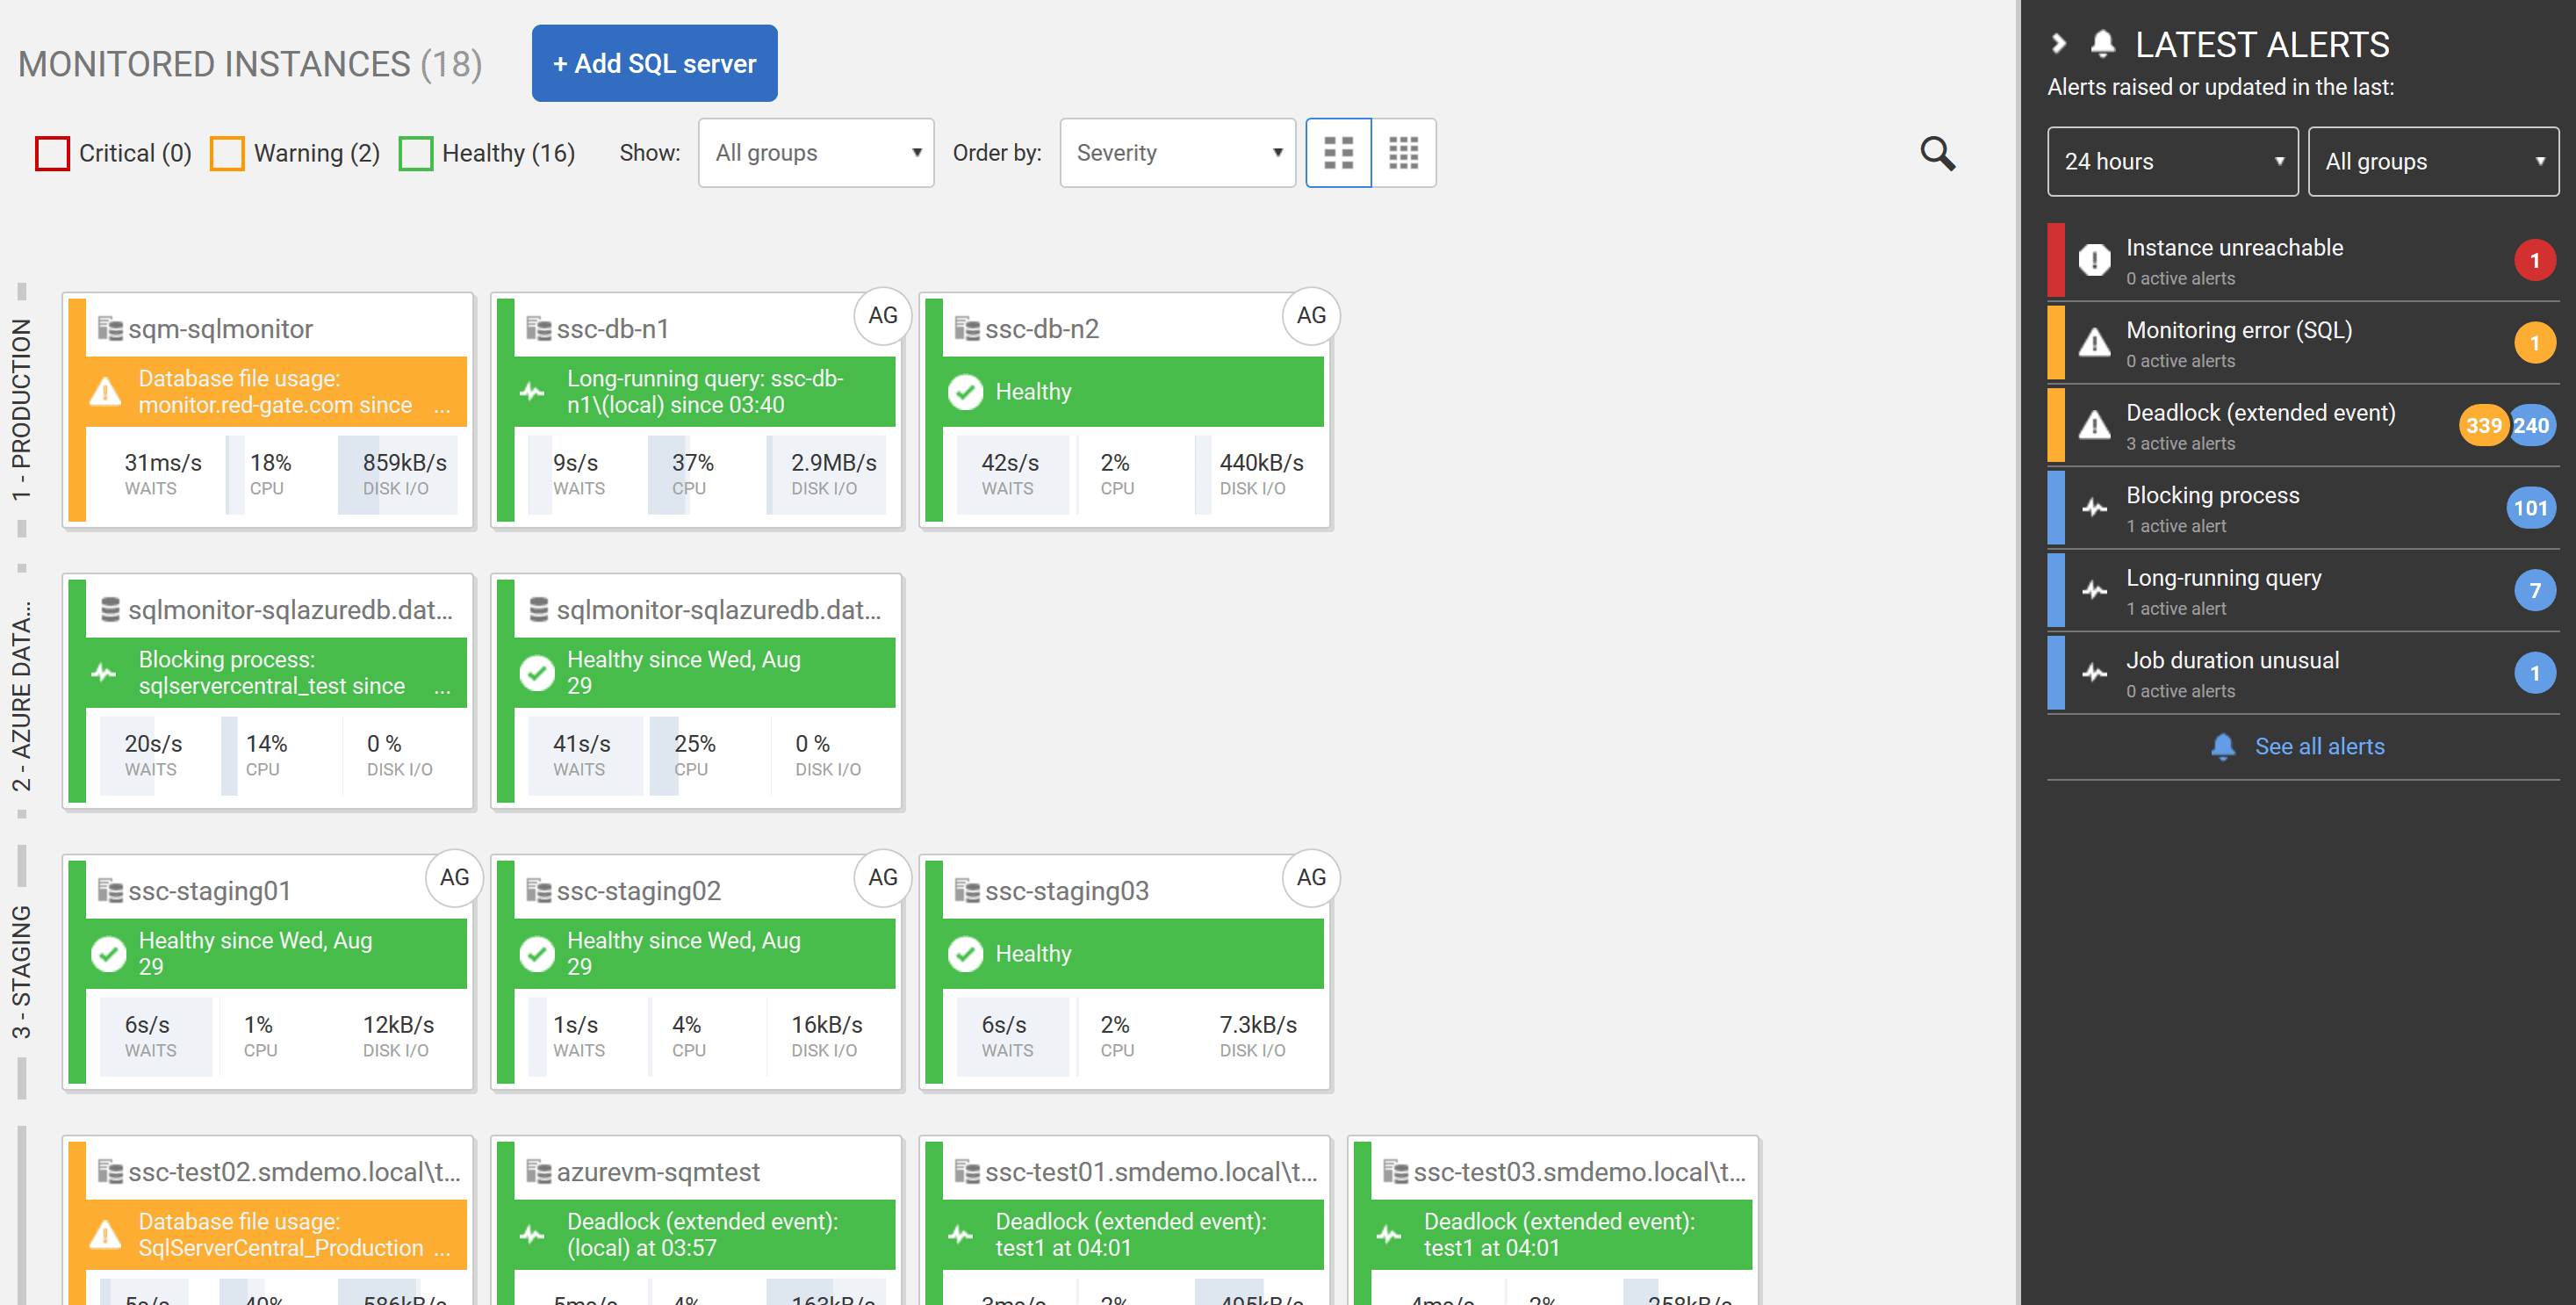
Figure 1: A monitored set of servers, their status, the latest alerts and current behavior, all in a single view.
This web dashboard must work as a central point of information that allows the first responder to work out enough about the problem to resolve it, in simple cases, or to get the DBA out of bed in urgent ones, or to understand it’s a problem they need to refer elsewhere, such as to the network team, or to whoever runs the SAN.
Simple analysis graphs and timelines
Another problem with the ‘wall of numbers’ output of legacy and homegrown monitoring tools is that it isn’t easy to check what’s happened in the past. It is very difficult to provide a way of establishing baselines and generating graphs to spot trends, and to see how two or more metrics inter-relate. It is trickier to spot what is normal for a period and what isn’t. A graph can present information with a far greater impact than a row of numbers.
A good monitoring dashboard will provide simple, visual features such as a timeline that makes it easy for any user to see resource usage (CPU, IO, memory, disk space and so on) patterns for an instance, over the recent period, and where on the timeline any alerts occurred, as well as any system changes (such as a deployment).
It should also display graphs and top-level summaries of other useful diagnostic data, for each SQL instance, for the period under investigation, such as when an alert was raised. This data might indicate what queries were being executed in that period, how long they took to run, the main reasons why SQL Server requests were forced to ‘wait’ before starting or continuing processing, and more.
This is often similar diagnostic data to that which your legacy or manual monitoring tool mined from various dynamic management views, system catalog views, perfmon counters and so on. The important difference is that instead of it’s now presented graphically, so that it’s accessible to a board ranger of users, and directly with the context of a specific period of server activity, to make troubleshooting much easier.
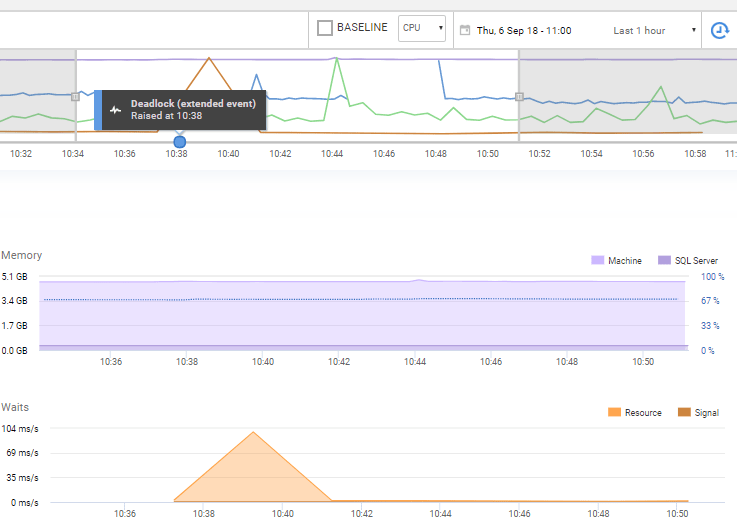
Figure 2: A graphical timelines of resource use and occurrence of alerts
Easy comparison of metrics to their ‘baseline’
A lot of problems can only be understood if you know the baseline. How do peaks in two metrics correspond over time? Is this level of CPU typical at month-end? A great advantage of a tool like Redgate Monitor is that it is very easy to plot analysis graphs that will display the use of resources such as CPU or memory not only for the current period, but also over the same period yesterday, or last week, or over several months. It is far easier to spot potential problems graphically in this way, and to explore the history for clues as to the cause.
It means you can quickly compare current usage patterns for a set of metrics to their ‘baselines’ to determine whether high resource utilization is either an abnormal spike, a worrying recent trend, or just normal behavior for that period. You can also look for correlations in the behavior of certain metrics.
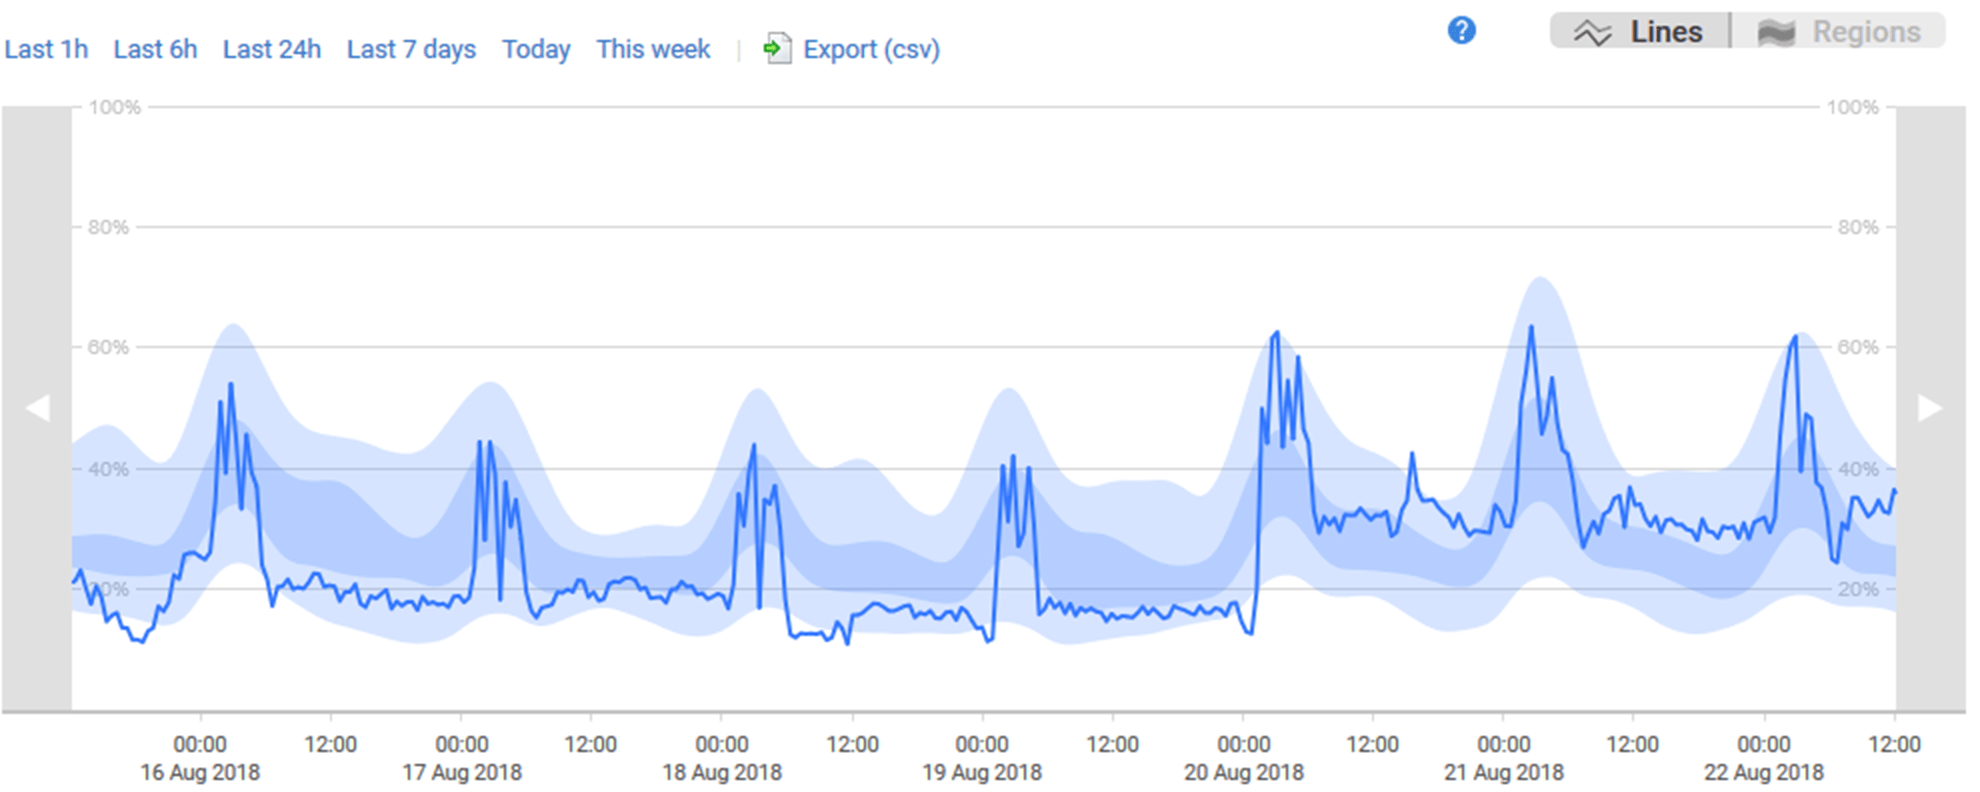
Figure 3: Analyzing metrics and their baselines
Let’s say that your users are experiencing delays in retrieving the data they need, and you see that SQL Server sessions are often waiting to read data from disk. Perhaps disk IO is a bottleneck, but does the tool make it easy to find the data you need to know for sure? For example, are reads and writes to disk taking substantially longer than usual, on average? Can you correlate that to recent queries that performed high levels of physical reads?
The ability to diagnose a SQL Server performance problem relies on the monitoring tool collecting all the diagnostic data that you might need. The ability to diagnose it quickly, relies on the tool presenting to you the right data, at the right level of detail, at the right point in your investigative journey. As you investigate deeper, so should the tool provide more detailed data, and an analysis of that data, for the DBA. For example, does the tool allow you to quickly retrieve the execution plans for these IO-intensive queries?
Predictive analysis and trends
A modern monitoring tool will monitor not only current activity, but also make predictions on future behavior. This will allow the team to plan rather than react, and to fix impending issues before they become the sort of problems that cause downtime, unplanned maintenance work, and lost revenue to the business.
A good example, and a common problem, is disk space monitoring. Any monitoring tool should alert you if available disk space falls below a certain level, or a database grows. A modern monitoring tool will predict the future value of these metrics, based on the trend, and forecast when, in the future, the current disk space available on a database server will be consumed.
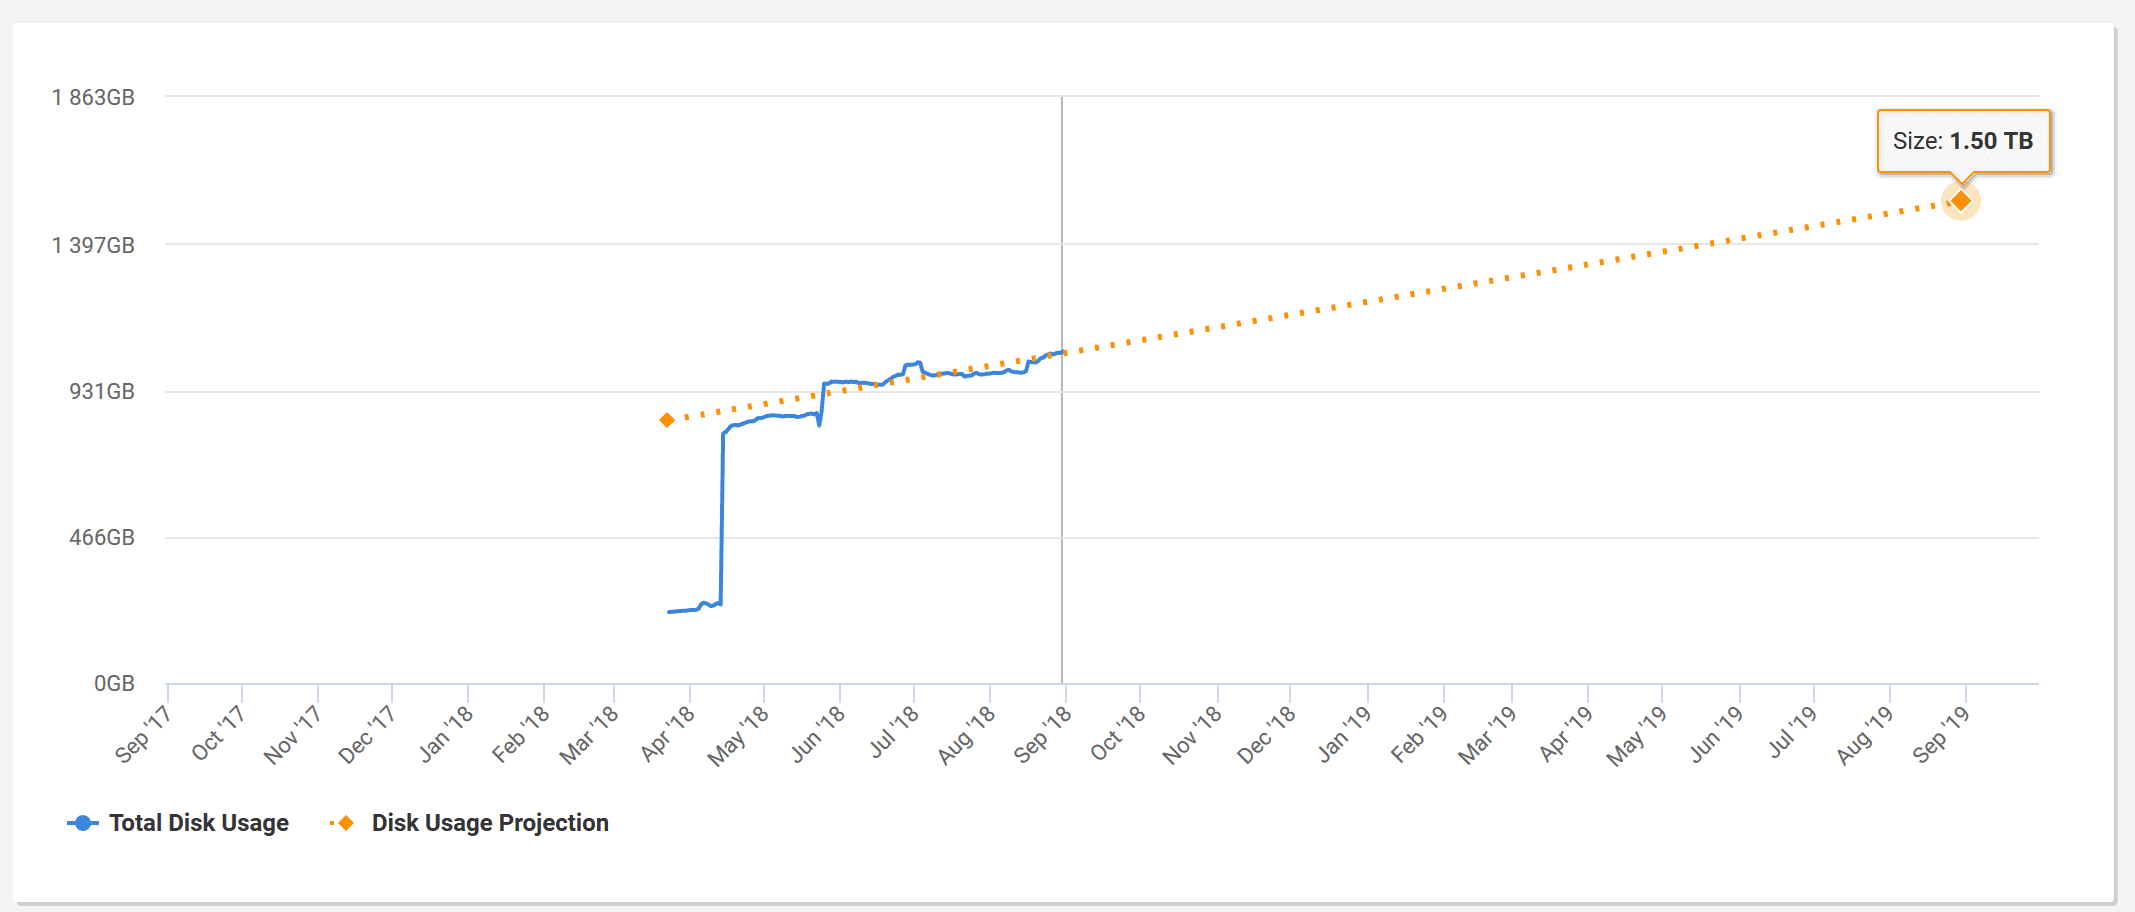
Figure 4: A graph of current and projected disk growth over time.
Easy customization of the monitoring strategy
Intelligent, graphical presentation of the diagnostics data is essential in modern monitoring tool, but only of course if it’s presenting the data you need to address the pain points in your database systems, and the business processes that you need to optimize.
Any monitoring tool can, or should, monitor a base set of metrics, such as resource use (CPU, IO, Memory, disk usage and so on) on the servers, and alert the operations team if they reach undesirable levels. However, does the tool also make it easy is to customize the metrics collected, and the alerting strategy, to tailor it to the needs of different business servers, instances, and databases? For example, can you customize the tool, easily, to monitor the performance of specific business processes? Or to implement additional security monitoring for servers hosting sensitive or personal data?
Redgate Monitor concentrates on monitoring a comprehensive and extendible range of potential symptoms, so that it covers all the essential data. However, it also adapts easily, to align with the business priorities. If certain database-related problems are a constant source of ‘pain’ to the administration team, and of delays to important user and business processes, then these need to be central to the team’s performance analysis, and optimization efforts.
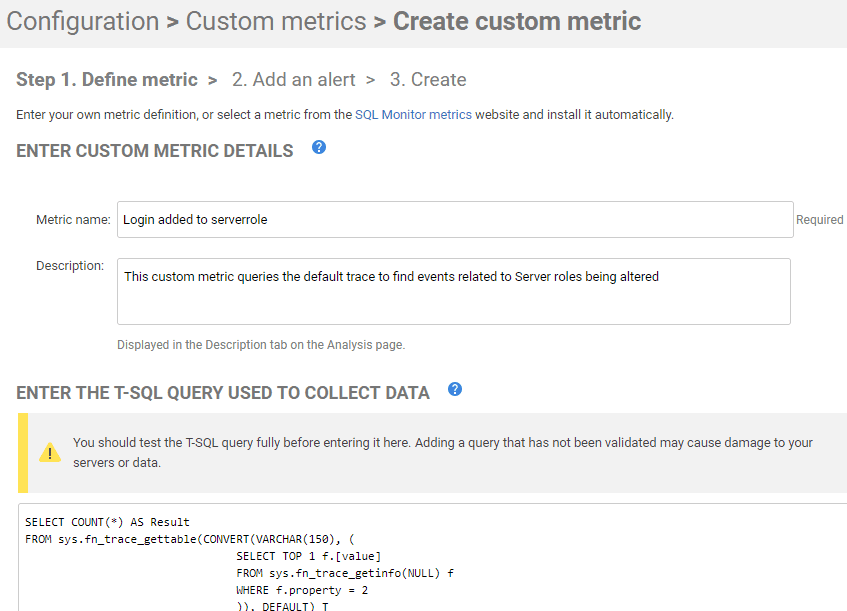
Figure 5: A Security custom metric to monitor changes to server roles
Low-impact, agentless SQL Server monitoring
Finally, and logistically, it must be very easy for the DBA to add servers and databases, even when the servers are in different data centers, or on different networks with distinct security protocols, without introducing significant overhead. A significant problem with legacy and homegrown database monitoring was its overhead. They would execute frequent, complex data collection queries, set trace flags to capture ‘verbose output’, request ‘specialist’ metrics that are complex to interpret, and so on. This can lead to the ‘observer effect’, where actions required to collect the monitoring data degrade the performance of the monitored server.
During any proof-of-concept, you should assess the tool’s features and capabilities in these areas:
- Data collection limited to lightweight, efficient SQL operations, exploiting lightweight frameworks such as Extended Events, where possible.
- Installation should not require agents on each monitored SQL Server instance. This minimizes their exposed ‘surface area’ and reduces risk. All data processing is done on a separate server.
- It should be easy to view the actions taken by the tool itself, to capture the monitoring data. Don’t trust a system that attempts to hides this.
Summary
If your team using uses legacy SQL Server monitoring tools, including custom-built scripts and automation, then you’re likely to encounter several problems as you try to scale it up to cope with the demands of monitoring the availability, performance and security of an increasing number of SQL Servers, across diverse platforms. Collecting and managing all the diagnostic data you need becomes difficult; you find yourself spending more time managing the monitoring solution than you are managing servers and applications.
Many DBAs have suffered from these problems, but also struggled to get investment approval for a better tool, because it wasn’t seen as essential, given that other server-level monitoring tools were already in use. However, as SQL Server estates continue to grow quickly, so the role of monitoring tool becomes critical.
A modern tool will allow the team to add new servers and databases, without difficulty, and without adding significant data-collection overhead on the target servers. It should, by default, monitor a comprehensive range of potential symptoms, but also allow you to adapt a server’s monitoring and alerting strategy easily, according to requirements. However, even this is only a small part of the challenge. The data needs to be analyzed and presented intelligently and graphically, in ways that makes it easy to diagnose problems, and spot worrying trends, even for user without deep experience of database administration.
When assessing any new SQL Server monitoring tool, come armed with scripts to reproduce the problems that cause pain on your systems, and see how the tool responds. How clearly does it indicate the problem? How well do the metrics and alerts guide you to a root cause? If you can choose a tool that works for your business, is low-impact, customizable, web-based, and with predictive analytical capabilities, then you’ve a good chance that it will yield significant improvements in the performance and stability of your servers, and the business processes they support.
Tools in this post
Redgate Monitor
Real-time multi-platform performance monitoring, with alerts and diagnostics


