Using Redgate Monitor to Detect Problems on Databases that use Snapshot-based Transaction Isolation
Use of the read committed snapshot isolation level is often an effective way to alleviate blocking problems in SQL Server, without needing to rewrite the application. However, it can sometimes lead to tempdb contention. This article offers a small-scale solution (not suitable for use on large tables) to detect cases when tempdb contention is related to use of RCSI.
If you’re using SQL Server’s Read Committed Snapshot Isolation level (RCSI), to avoid long waits for a blocked resource, caused by transactions being held open for too long, then you’ll want to monitor for possible side effects.
Usually, the overhead of using RCSI is not significant compared to the performance benefits of alleviating blocking, but problems can arise when applications issue long-running transactions on an RCSI-enabled database, or transactions that simply never commit, and which update or delete many rows, creating many row versions in the version store. This can increase dramatically both the resources required in tempdb, and the work performed by other SELECT operations on the database to retrieve they data they need.
This article describes one way to monitor for such problems, using an alert on version_ghost_record_count, to warn us when the number of row versions in tempdb is getting very high.
The alert was developed for use on small ‘rotating data’ tables, into which transactions would constantly insert and then delete rows. It’s not suitable for use on large tables, because SQL Server must examine every page of the source table to collect the metric data.
How RCSI can alleviate blocking problems
When a snapshot-based isolation level is enabled, SQL Server stores in the version store, in tempdb, copies, or versions, of all the previously-committed versions of any data rows. When a SELECT statement encounters a row on which another transaction holds an Exclusive (X) lock, to modify that row, then rather than block, it traverses the row version chain in the version store to reconstruct a ‘snapshot’ of the data, as it existed when the statement began. The data returned will reflect only effects of other transactions that were committed, at the time the current statement started.
This allows RCSI to offer the same protection against dirty reads as the default READ COMMITTED level, but without the need for SELECT operations to acquire Shared (S) locks. When we enable RCSI on a database, it becomes the default isolation level for all transactions.
With RCSI, consistency is guaranteed at the statement level, not at the transaction level. If you need transaction-level consistency, avoiding non-repeatable reads and phantom reads, you’ll need SNAPSHOT isolation (not covered in this article).
The Overhead of RCSI
Enabling RCSI for a database is a better and safer way of reducing blocking than to allow certain transactions to use the READ UNCOMMITTED isolation level, which simply allows dirty reads, where transactions read the current data value, committed or otherwise. With RCSI enabled, every UPDATE and DELETE operation on that database generates a row version, and the version store must retain versioned rows for as long as operations in the database might need to read them reconstruct a transactionally-consistent view of the data.
Firstly, this increases the storage space required and IO activity in tempdb, to write all the row versions, and retain any that might still be required. Secondly, it can mean that queries need to traverse a long row version chain to reconstruct the required version of the data, which increases the number of logical IOs, and possibly physical IOs, they need to perform.
In a typical OLTP-workload, consisting of many short, simple transactions that retrieve or modify small sub-sets of the data, and then immediately commit, the overhead should not be significant. However, if your workload issues very long-running transactions that create many row versions, then while RCSI will relieve blocking issues, the tempdb overhead and additional IO performed by concurrent SELECT operations, can cause other problems.
One pattern I’ve encountered several times, described in detail in my Simple-Talk article, is where applications were using small ‘rotating data’ tables into which transactions would insert new status records and then, having performed any necessary process, delete any outdated status records. However, the processing algorithm was such that the parent transaction never committed. Unfortunately, this meant that other queries that wanted to access this data had to read back through a very long row version chain, to reproduce the last committed versions of those rows, greatly increasing the IO they needed to perform to retrieve the data.
Monitoring for row versioning issues
There are several Dynamic Management View and Functions for investigating version store activity, and the behavior of snapshot-enabled transactions, such as sys.dm_tran_transactions_snapshot, and sys.dm_tran_active_snapshot_database_transactions. There are also performance counters, contained in the SQLServer:Transactions performance object, which we can use to monitor transactions that use row versioning.
However, here we’re going to very simple way to be alerted to potential issues, using a custom Redgate Monitor alert that queries the sys.dm_db_index_physical_stats to return the version_ghost_record_count. Quoting from the documentation this column records:
“the number of ghost records retained by an outstanding snapshot isolation transaction in an allocation unit”.
Each copy, or row version, of a given row, which is still required in the version store, is called a version_ghost_record. The higher number of version ghost records recorded for an index (or heap) the longer the chain of row version that queries on that table will need to traverse to return their data. When the count gets very high, say over 10,000, this is an indication that snapshot-enabled transactions are running long, and could cause performance issues, without investigation. The definition of “high number” depends on the workload of the table and can vary.
Listing 1 shows the simple query we’ll use.
|
1 2 3 4 5 6 7 8 |
SELECT version_ghost_record_count FROM sys.dm_db_index_physical_stats( Db_Id(), Object_Id(N'dbo.demo_table', N'U'), 1, NULL, N'DETAILED') WHERE index_level = 0; |
Listing 1
The sys.dm_db_index_physical_stats DMV provides details of the physical attributes of indexes, by scanning the pages of the index, and calculating statistics as it goes. Notice in Listing 1 that the version_ghost_record is only returned if we specify the DETAILED mode (scan level) to obtain the statistics. However, this means that SQL Server scanning every page at every level of the index, to calculate the statistics.
Be very cautious about collecting this metric for large tables!
Collecting the physical attributes of indexes, including the version ghost record count, using sys.dm_db_index_physical_statswill consume lots of resources on big tables/indexes.
To see how this works, I’m going to use the same demo set up as for my previously-referenced Simple-Talk article. Listing 2 enables RCSI for a demo database, creates a small, demo_table, with an IDENTITY column (ID) and one other, inserts 1000 rows, then creates a clustered index on the table.
|
1 2 3 4 5 6 7 8 9 10 11 12 13 14 15 16 17 18 19 20 21 22 |
USE Master; GO ALTER DATABASE demo_db SET READ_COMMITTED_SNAPSHOT ON; GO USE demo_db; GO CREATE TABLE dbo.demo_table ( ID INT NOT NULL IDENTITY (1, 1), C1 CHAR(100) NOT NULL ); GO INSERT INTO dbo.demo_table (C1) SELECT TOP (1000) CAST(TEXT AS CHAR(100)) AS C1 FROM sys.messages WHERE language_id = 1031; GO CREATE UNIQUE CLUSTERED INDEX cuix_demo_table_Id ON dbo.demo_table (Id); GO |
Listing 2
Listing 3 simulates the ‘small rotating data table’ problem I described earlier. We have two auto-commit transactions within an explicit transaction. Within the WHILE loop, we INSERT a new row into demo_table, wait for 10 ms, then DELETE the row with the lowest ID value. Each DELETE creates a new row version that stores the value just deleted, and all the previous row versions are retained “indefinitely” because the parent transaction never gets to commit.
|
1 2 3 4 5 6 7 8 9 10 11 12 13 14 15 16 17 18 19 20 21 22 23 24 25 |
-- We start our workload SET NOCOUNT ON; GO BEGIN TRANSACTION; GO -- Insert new record into dbo.demo_table DECLARE @finish_date DATETIME2(0) = DateAdd(MINUTE, 5, GetDate()); WHILE @finish_date >= GetDate() BEGIN -- wait 10 ms before each new process INSERT INTO dbo.demo_table(C1) SELECT C1 FROM dbo.demo_table WHERE Id = (SELECT Min(Id) FROM dbo.demo_table); -- Wait 10 ms to delete the first record from the table WAITFOR DELAY '00:00:00:010'; -- Now select the min record from the table DELETE dbo.demo_table WHERE Id = (SELECT Min(Id) FROM dbo.demo_table); END; ROLLBACK TRAN; GO |
Listing 3
Before you run Listing 3 open a new query window and execute the query in Listing 4.
|
1 2 3 4 5 6 7 8 9 10 11 12 13 |
SET STATISTICS IO ON; PRINT 'I/O with RCSI...' SELECT MAX(ID) FROM dbo.demo_table; SET STATISTICS IO OFF; GO SELECT version_ghost_record_count FROM sys.dm_db_index_physical_stats( Db_Id(), Object_Id(N'dbo.demo_table', N'U'), 1, NULL, N'DETAILED') WHERE index_level = 0; |
Listing 4
You should find it performs 2 logical reads, and that there are zero version ghost records. Now, return to the query pane for Listing 3 and execute it. After a minute or so, return to Listing 4 and run it again. In my test, the ghost record count had increased to over 4000, and Listing 4 now performed 67, instead of 2, logical reads. Don’t forget to cancel the query in the session running Listing 3, and rollback the transaction.
In my Simple-Talk article demo, I showed how after running Listing 3 for only 5 minutes, I could create approximately 14,000 ghost versioned records. One of the affected systems I encountered had been running an open transaction for more than three months!
A custom alert to track high version_ghost_record_count
Redgate Monitor makes it so easy to implement an alert for the monitoring of these kind of metrics. First, we create a custom metric, to collect the required version ghost record count, and then define a custom alert on this metric, so we’re warned when the count exceeds certain levels.
Configure a custom metric
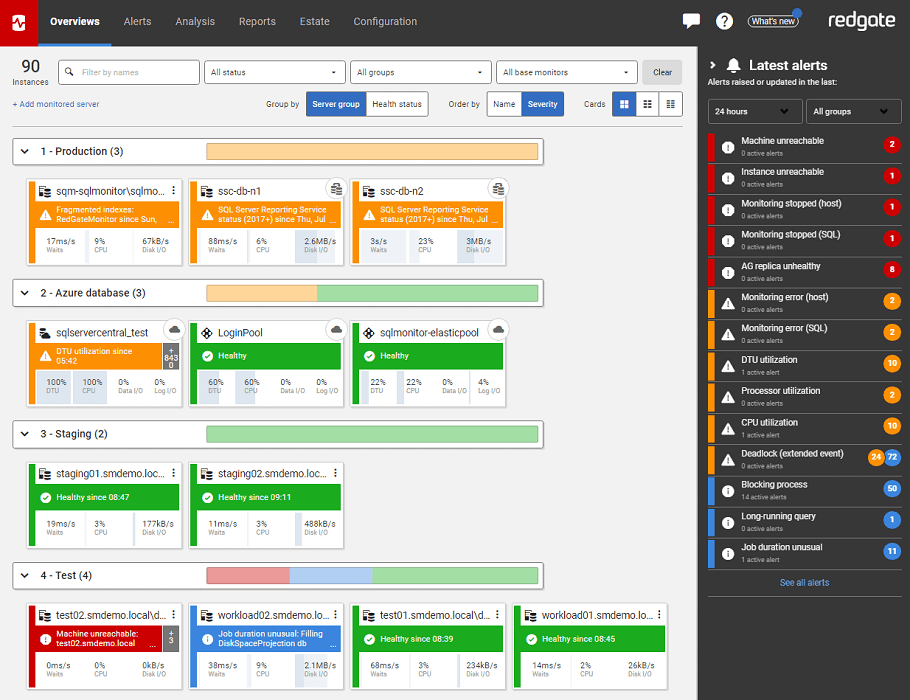
Open Redgate Monitor and navigate to the Alerts section of the Global Dashboard.
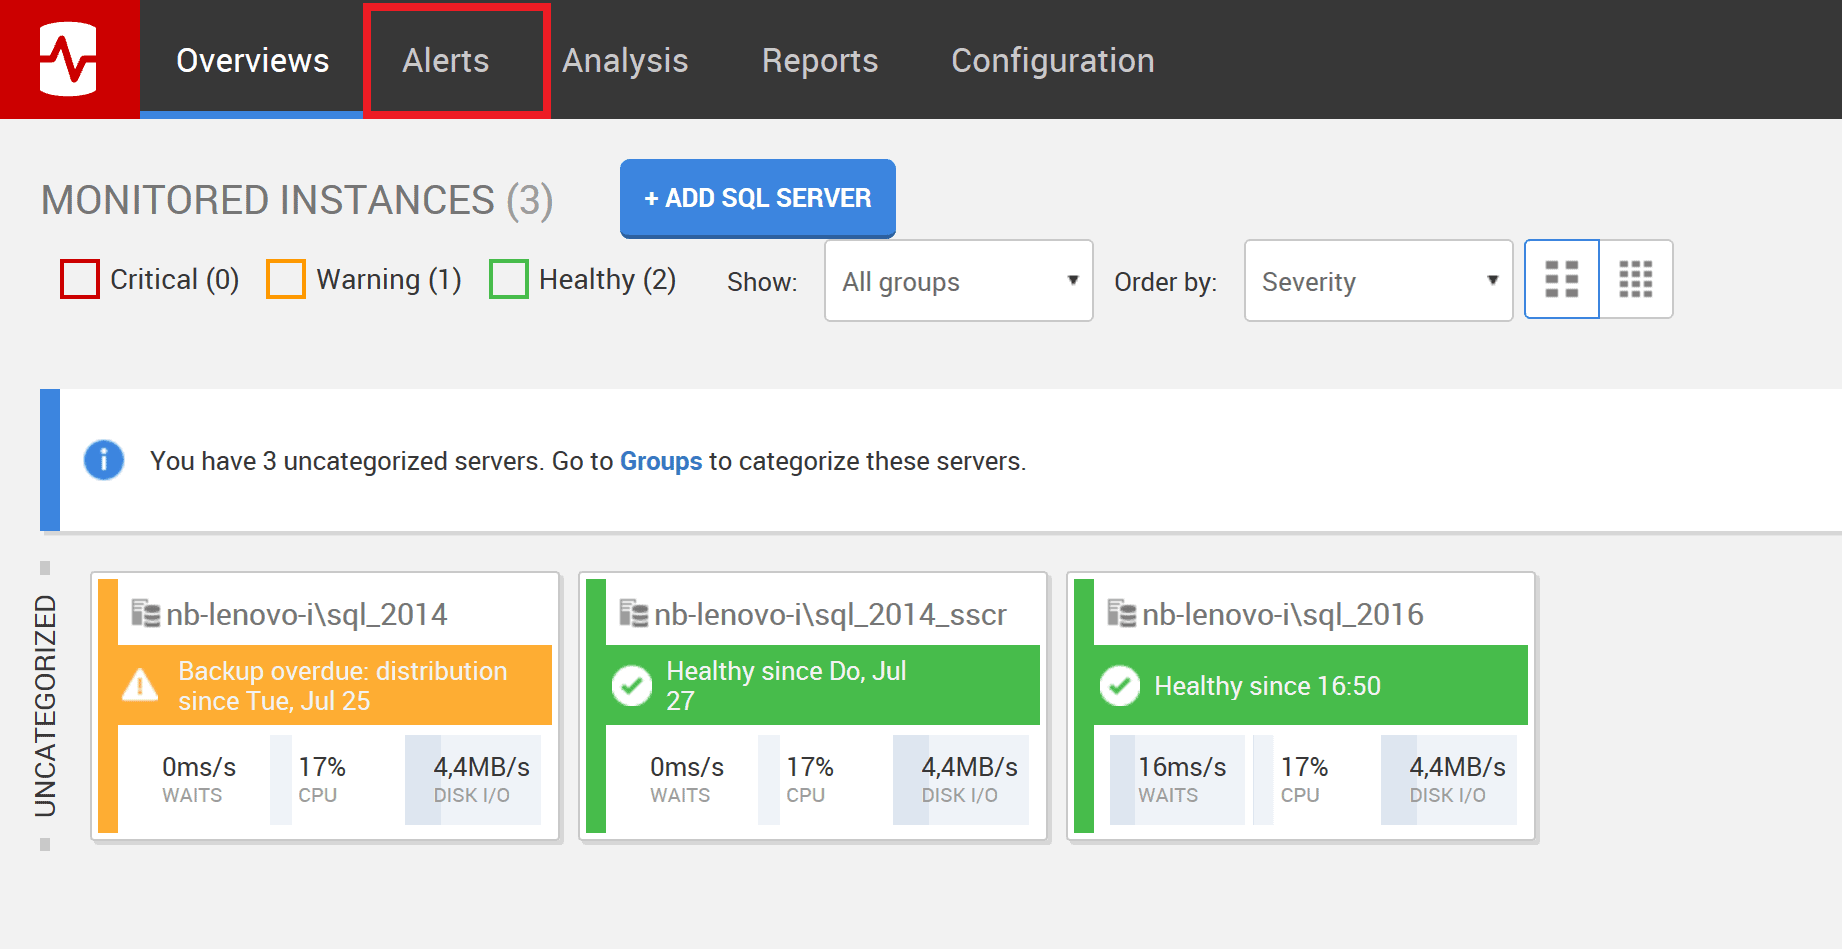
Figure 1: Redgate Monitor Dashboard
You’ll enter the Alerts Inbox. From the Actions list in the left pane, select the option Create custom metrics and alerts.
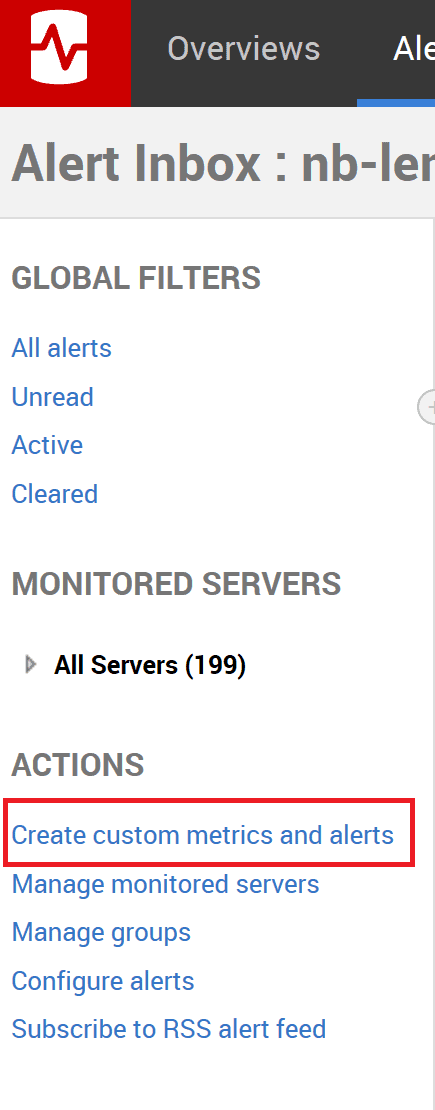
Figure 2: Create a custom metric or alert
Click Create Custom Metric to arrive at the configuration screen, shown in Figure 3. Add a name for the alert and a brief description of its intent and functionality. A good description is essential; it will create a better awareness and understanding of the potential problem, among your colleagues.
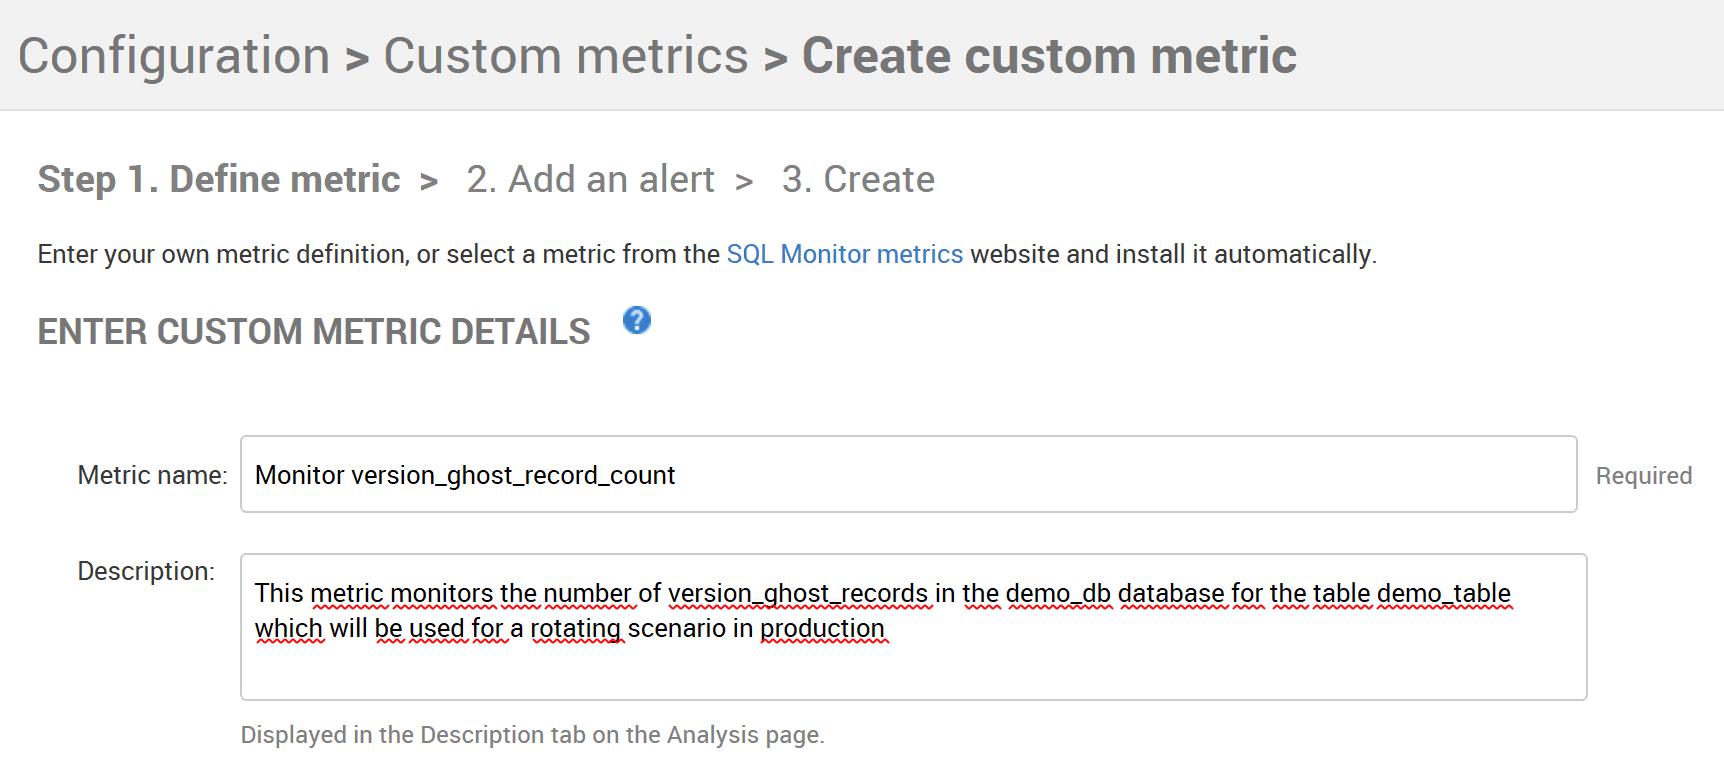
Figure 3: Configuring the version_ghost_record_count custom metric
Now we define the T-SQL statement that will collect the data. This is our query from listing 1, with an added check to verify that RCSI is enabled for the database. The statement is only allowed to return a single numeric value, or NULL.
As discussed previously, I do not recommend using such a metric for very big tables!
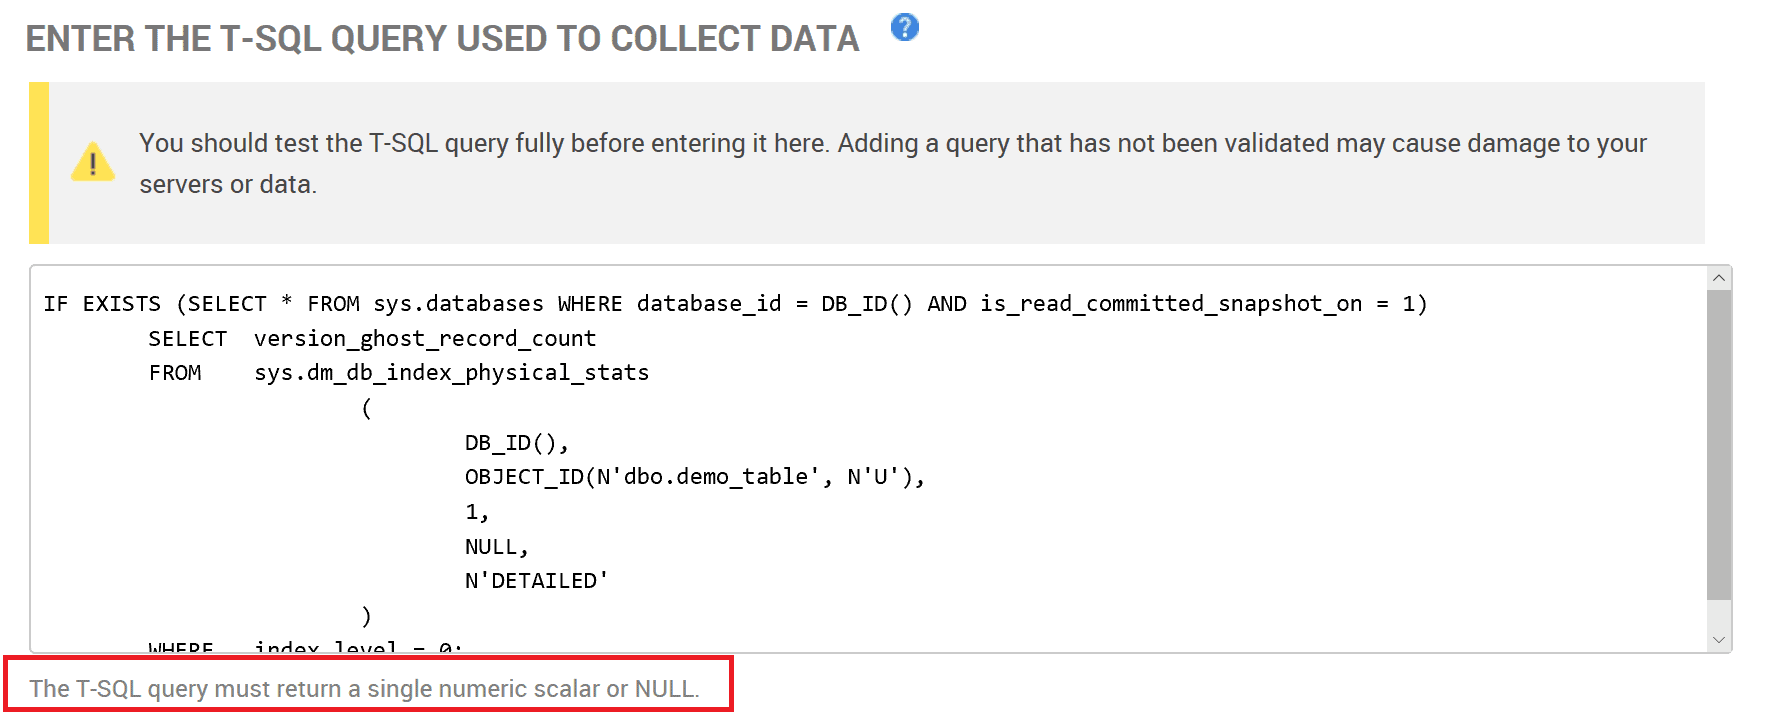
Figure 4: The query used to collect the version ghost record count
Next, we must define the server and database(s) where this metric should be used. Again, querying sys.dm_db_index_physical_stats with the option DETAILED will consume lots of resources. Do not use this metric for all tables in all databases, but only for selected tables where you need to monitor for possible problems, when using RCSI.
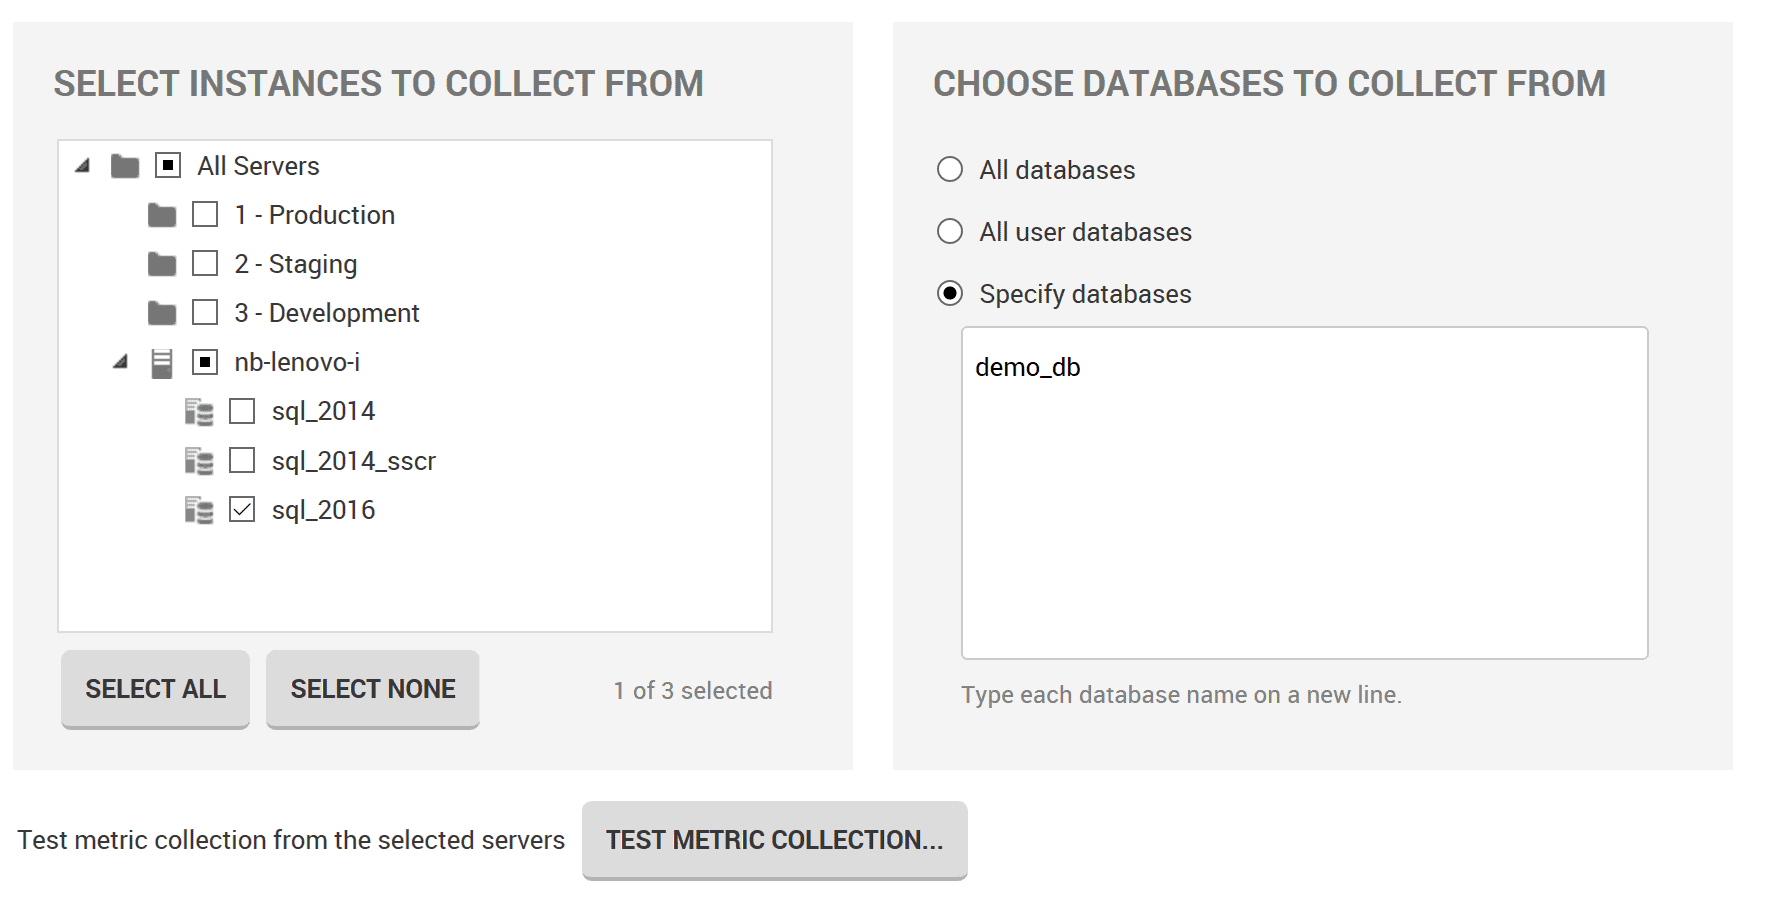
Figure 5: Selecting the instance and databases from which to collect the metric data
Test the metric collection and, assuming it works, the last option defines the frequency for the checks.
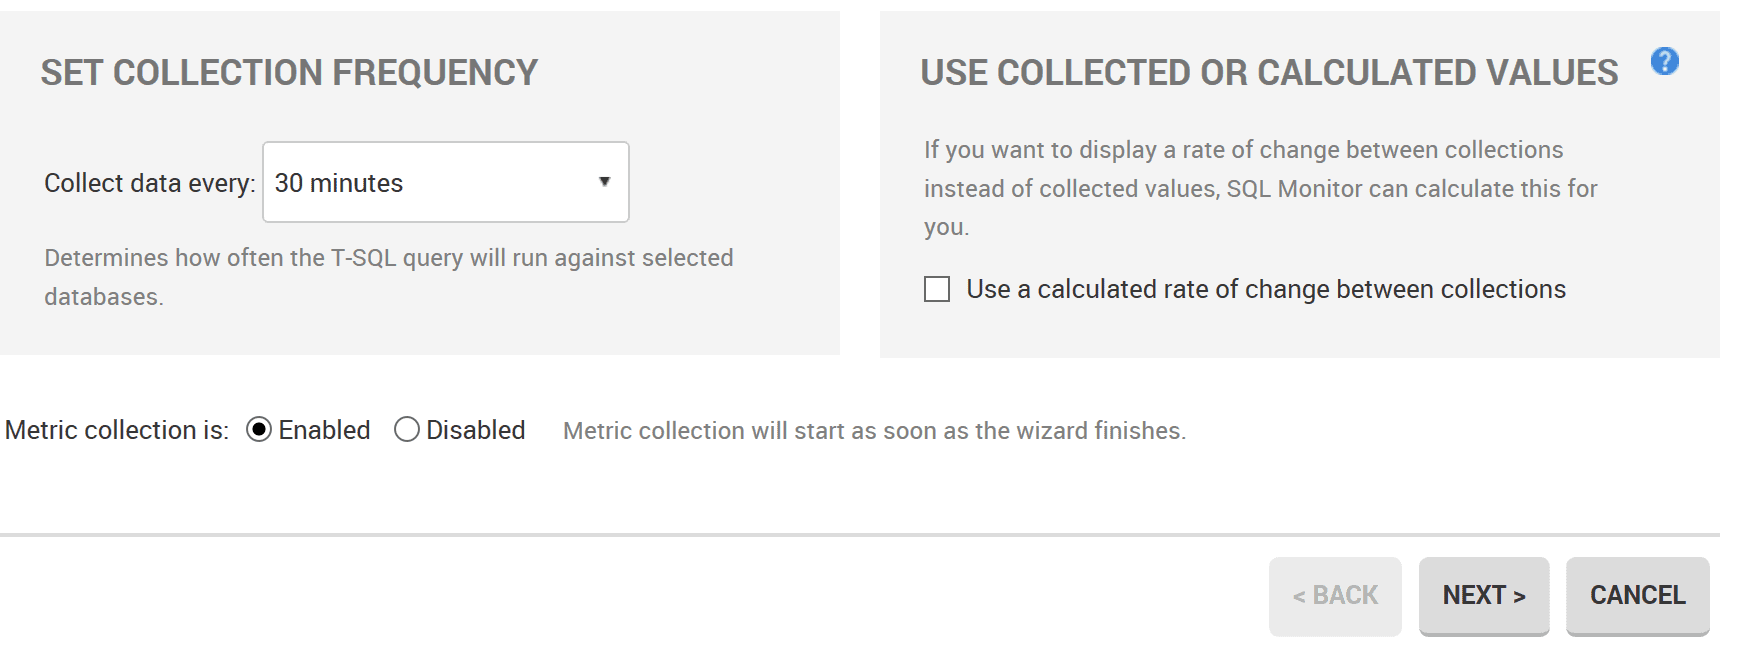
Figure 6: Frequency of data collection for the custom metric
Configure custom alert for the metric
Next, we define an alert for this metric, to warn the DBA is the version_ghost_record_count is getting too high.
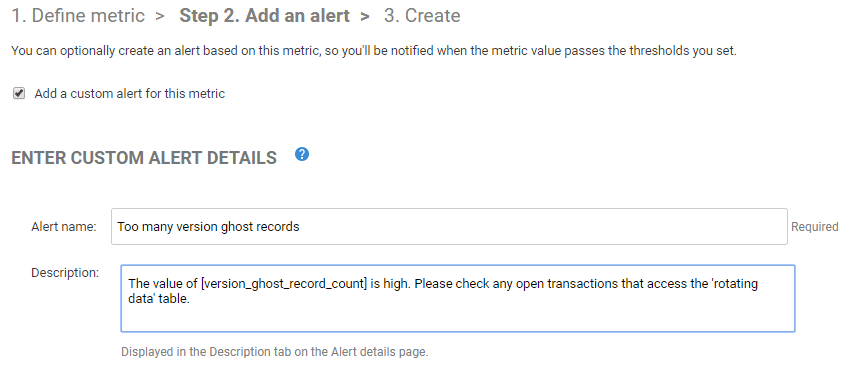
Figure 7: Create a custom alert on the ghost_versioned_record_count metric
Now, we need to set the alert threshold levels. If the version ghost record count exceeds 1000, it will trigger a Low priority alert. If it is higher than 5,000 records a High priority alert will be raised. I’ve set the thresholds quite low, for demo purposes, but you’d need to adjust these as appropriate for your servers.
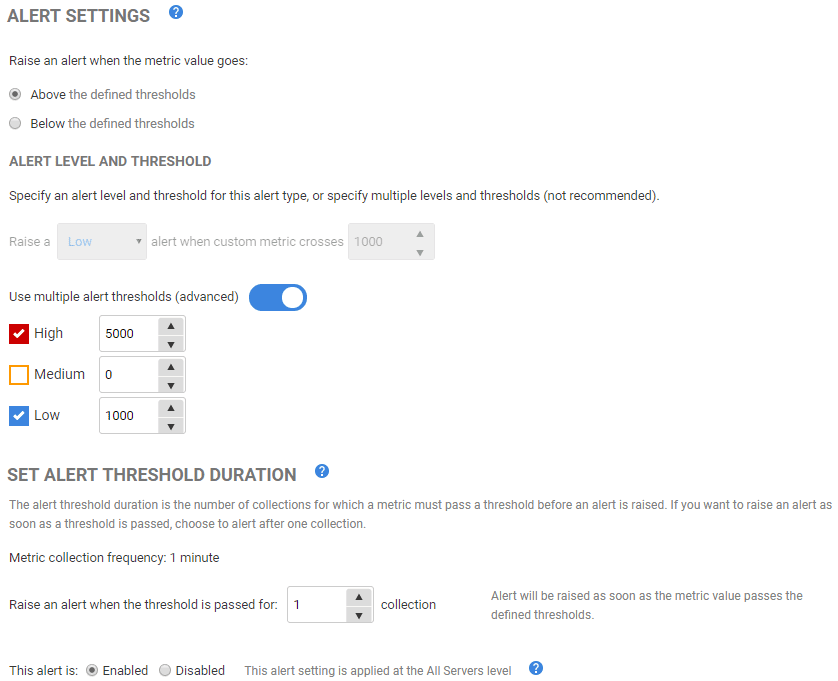
Figure 8: Setting alert threshold levels and duration.
You’ll arrive at a screen summarizing the configuration of the metric and associated alert. If you’re happy, click on Create Metric and Alert to save it.
Testing the alert
In SSMS, start Listing 3 running and after a few minutes, Redgate Monitor will raise our new custom alert.
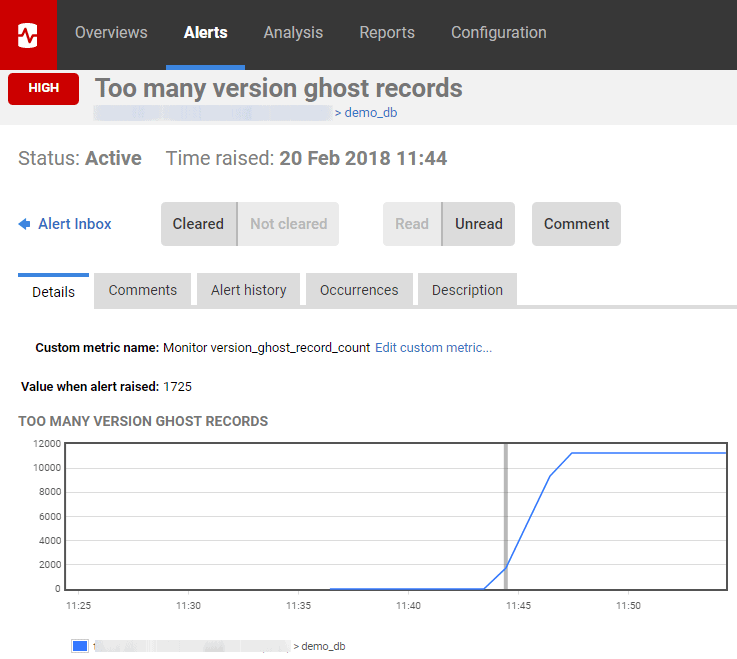
Figure 9: Redgate Monitor raises a high alert
Click on the demo_db link below the graph to switch to the Analysis section, where we can see an Analysis Graph for our custom metric, by selecting the metric and then the appropriate instance and database.
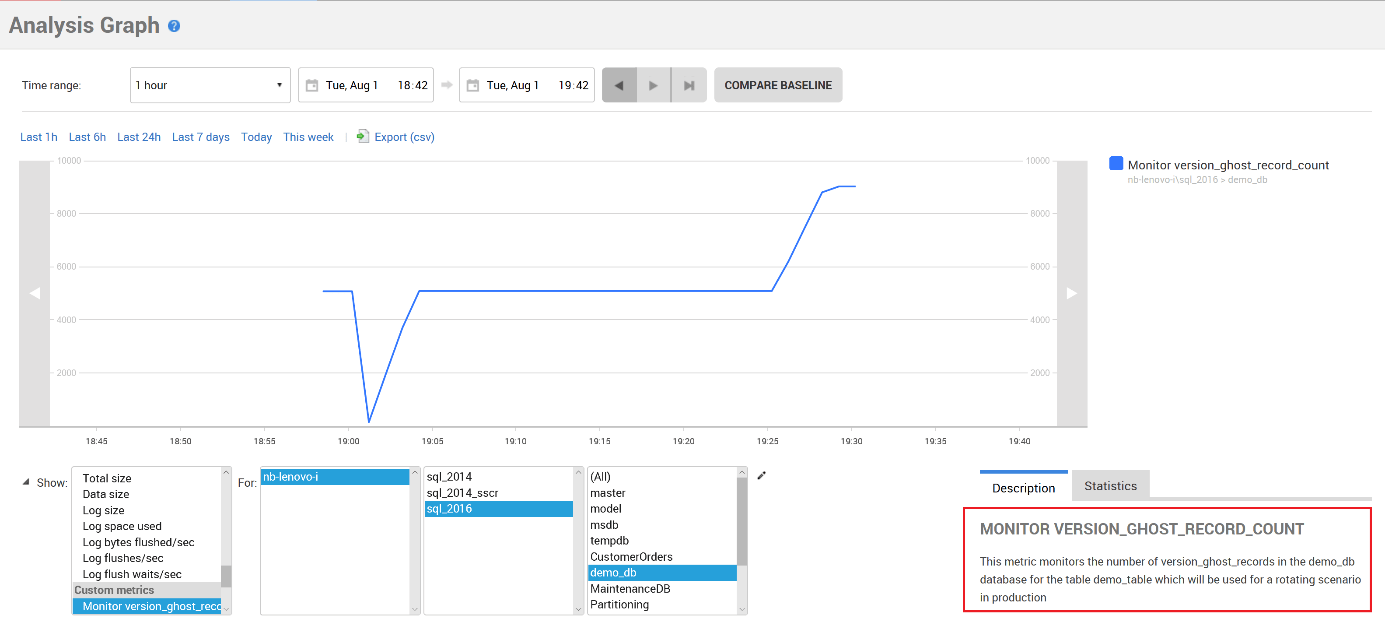
Figure 10: Analysis graph showing number of ghost version records
Diagnosis
If this alert fires, the DBA will need to investigate the root cause of the problem. If the problem is caused by a very long running query inside a transaction, then Redgate Monitor will fire the Long running query alert, and you’ll get useful details there.
You might also consider creating another custom metric specifically to monitor the run time of transactions; I’ll show how to do that in my next article.
We can also use the transaction- and execution-related DMVs. Listing 5 identifies the session to which the transaction belongs, from sys.dm_tran_session_transactions, and then uses that to join to sys.dm_tran_database_transactions, to find out when the transaction run time and to evaluate the database_id, and then to some execution-related DMVs to get the text the last request executed on the session’s connection.
|
1 2 3 4 5 6 7 8 9 10 11 12 |
SELECT dtst.session_id, dtdt.database_transaction_begin_time, DATEDIFF(SECOND, dtdt.database_transaction_begin_time, GETDATE()) AS SEC_DIFF, DEST.text FROM sys.dm_tran_session_transactions AS dtst INNER JOIN sys.dm_tran_database_transactions AS dtdt ON (dtst.transaction_id = dtdt.transaction_id) INNER JOIN sys.dm_exec_connections AS dec ON (dtst.session_id = dec.most_recent_session_id) CROSS APPLY sys.dm_exec_sql_text(dec.most_recent_sql_handle) AS DEST WHERE dtdt.database_transaction_begin_time IS NOT NULL ORDER BY DATEDIFF(SECOND, dtdt.database_transaction_begin_time, GETDATE()) DESC; |
Listing 5
Summary
When many concurrent user transactions are competing for access to a database, using the default isolation level, the number of locks acquired will increase, and with it the potential for blocking. The longer processes are blocked, the more the performance of the database declines. Use of RCSI is often an effective way to alleviate these blocking problems, without the need for rewriting the application.
All the issues we had with RCSI were based on development errors. If you run into such problems it is a good plan to focus on activity in the underlying database, and Redgate Monitor is a very effective tool for monitoring your SQL Servers and analyzing SQL Server Problems. It offers a range of built-in and auto-configured alerts and makes it very easy to improve the monitoring using custom alerts you need, to support you in your daily work.
Tools in this post
Redgate Monitor
Real-time multi-platform performance monitoring, with alerts and diagnostics
You may also like
-

Webinar
Database monitoring in Azure
Join Redgate’s Anderson Rangel, in conversation with Microsoft Cloud Solutions Architect, Tanya Smith as they discuss what organisations need to consider when migrating to Azure, and why having a monitoring strategy is critical for ensuring the performance and availability of its databases and servers.
-

Article
Do you really know what’s happening with your server estate?
Managing an IT team is a tough job. While demands on services are increasing, both internally and externally, the need to be aware of and in control of application and server performance is a constant pressure. Right now, there are four key areas that are of particular concern for those responsible for IT departments and
-
Article
5 things to look for in a third-party monitoring tool
Update, 28 February 2024: A new edition of this article can be found here. A key finding from Redgate’s last State of Database Monitoring Survey of over 2,500 IT professionals was that 79% of respondents reported using either a third-party or in-house monitoring tool. It’s notable because it was an increase of 10 percentage points
-

Webinar
Der ultmative Ratgeber zur Wahl des richtigen Datenbank-Monitoring-Tools
Die Wahl des richtigen Überwachungstools für Ihr Unternehmen geht über den Funktionsvergleich und oft sogar den Preis hinaus. Während Sie wahrscheinlich ein Budget haben, an das Sie sich halten müssen, gibt es neben den Kosten auch andere Faktoren, die Sie berücksichtigen sollten, wenn Sie das richtige Tool für Ihr Unternehmen auswählen. In diesem Webinar werden
-
Article
How to mitigate the challenges of data growth
Updated in 2026. I’ve rarely met a data professional whose organization wasn’t experiencing data growth and making more demands of their data. We build and deploy new applications faster than we retire old ones, and new data is accumulating dramatically faster on our existing systems than our ability to decide to delete older information. Additionally,