


Troubleshooting a painful query using execution plans in SQL Monitor
How to use SQL Monitor to identify an unusual set of behaviors on the server, then narrow down the cause of the behaviors to a particular query. Within that query we have the starting point for tuning the query to get better performance.
It’s just one of those average days for a DBA; everything is cruising along nicely one minute and the next, red alerts, metaphorical or otherwise, start flashing up on one of your SQL Server instances. CPU is through the roof, you see disk IO spikes, memory usage is high. It’s only a matter of time before you start receiving the “Something’s wrong with the database!” calls.
Did that new software release update the database structure, or make some changes to a stored procedure? Maybe it’s something to do with that new service pack you applied last night? Perhaps a recent data load has caused plan recompilation, and the new execution plan isn’t supporting those queries as well as the old one? It might be something completely different.
Where do you start your diagnosis?
Starting with server metrics
You take a closer look at the server metrics for resource usage and see that the server is indeed under considerable stress. Figure 1 shows the scene in Redgate SQL Monitor.
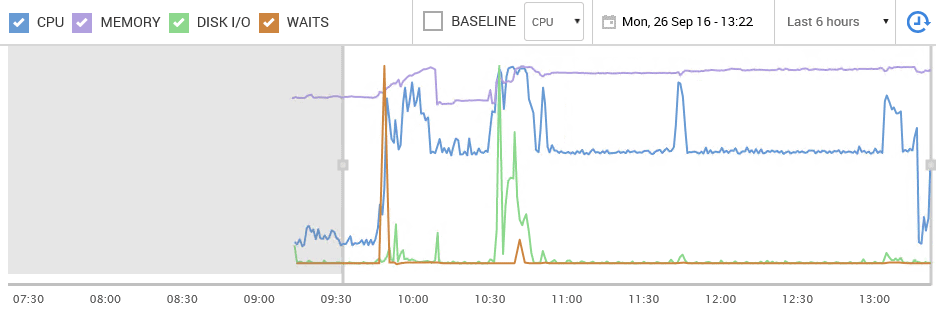
Figure 1
CPU (the blue line) has been under sustained load over a period of hours. There are also large spikes in disk IO times (green), as well as wait times (orange), and memory use is high and has increased (purple). You can see that the CPU clears right near the end of the time in question. You know the process that causes the sustained CPU load; that’s normal. You don’t like it, but it’s normal, for now at least, since you can’t make any further tuning improvements to that process.
The concerns are those unusual spikes in CPU and IO time, and maybe the spikes in wait times.
So what’s the next step? Investigate the CPU pressure? Examine the wait types that caused abnormal wait times over that period? Drill deeper into the disk IO spikes and see if you can locate the hotspots of file activity on disk?
If you don’t have monitoring in place, you’ll have to examine each metric independently and then attempt to correlate it; here’s an example of what’s entailed. However, I’m going to take advantage of the metrics and reports available to you in SQL Monitor.
Depending on the problem, you might end up investigating many of these avenues, but I always find a good first step is to examine the queries that ran over that period. If I find any that ran longer, or more often, ate CPU cycles or disk IO, I’ll take a look at their execution plans.
Drilling down into the expensive queries
Most of the time, the source of any issues on the system is a query or queries being run. Luckily, right near the top of the screen in SQL Monitor is a top 10 list of the most expensive queries that ran during the selected time frame, in this case from 9:30am to about 13:30pm. Figure 2 shows the queries sorted by Duration (MS).
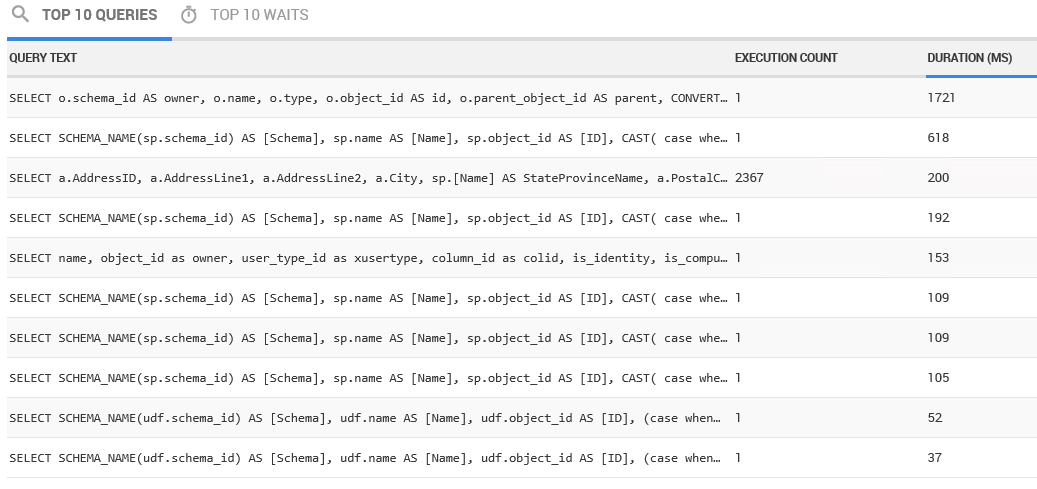
Figure 2
The longest duration query ran for 1721 ms, and we can see the text of that simply by clicking on it. As you can see from Figure 3, it’s a query that retrieves information from the system tables.
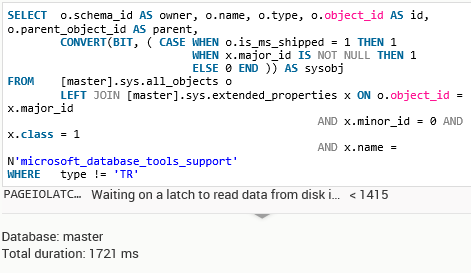
Figure 3
From the Execution Count column in Figure 2, we can see that over the timeframe being investigated, this query ran only a single time. One query running for 400ms one time can’t account for the abnormal load we see on the system. We’ll need to dig further.
The second longest-running query is yet another system query that was called only once. It can’t explain any kind of abnormal load. The third query is much more interesting and ran for 200ms on average. Figure 4 shows the query text.

Figure 4
The query returns address details from the AdventureWorks database. While it only ran for an average of 200 ms, if you look at the number of executions, it was called 2,367 times over the time frame. Now, we may have a query worth examining more closely!
As you can see, duration is certainly not the only measure we should take into account when investigating queries; execution count is important too, as are other metrics such as number of logical reads. Figure 5 shows the top 5 of the 10 expensive queries, this time ordered by execution count.
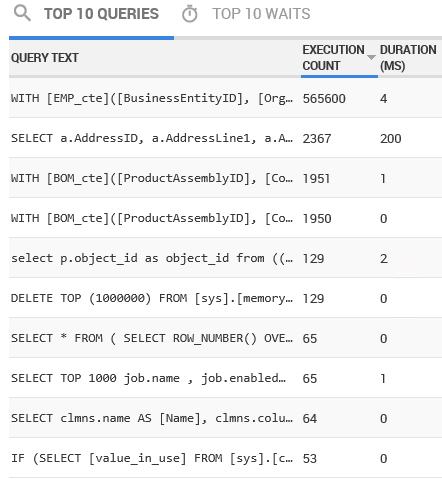
Figure 5
We have a new query at the top of the list. Its duration is only 4ms but it has been called 500,000 times over the time period! This is the query I already know about, and which causes the sustained CPU load. It’s a standard part of our load, and while somewhat expensive, and called frequently, it has been tuned in the past. If we’re experiencing abnormal spikes in activity, this isn’t the culprit.
The second query is the Address query we saw above. The next three queries have been called thousands of times, so they certainly are adding to the overall server load, but their direct impact, individually, is low as indicated by the very low durations.
Finally, Figure 6 shows the same query list sorted by logical reads:
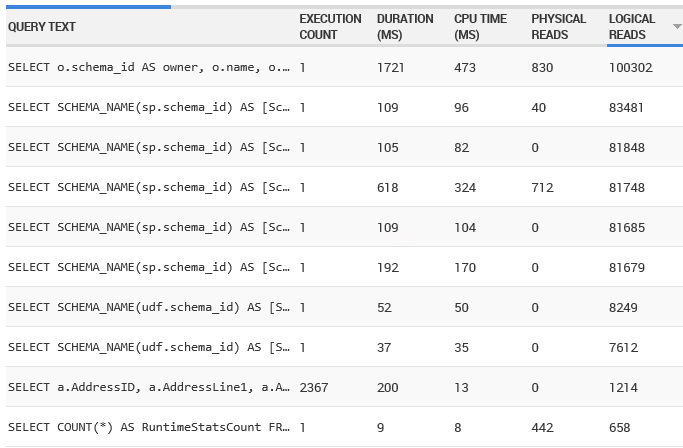
Figure 6
A series of queries against the system tables performed the most logical reads over this period, but then we see the Address query for a third time.
So, we have one query that has a radically higher execution count than any other, and one query that, whichever way we sort the list, always appears near the top. In the former case, we might need to investigate this query, if it is suddenly executing more frequently than normal. Since that’s not the case here, it’s the Address query that is a prime candidate for query tuning.
Examining query execution plans
Let’s drill down on our Address query just a little more. A new piece of functionality in version 6 of SQL Monitor is the ability to display execution plans. In the past, you’d have to take the plan_handle and run a query of your own against the dynamic management views, or, if you are in Azure SQL Database or SQL Server 2016, the Query Data Store.
In SQL Monitor, you can simply click a button. I actually hid that from you when I showed the query earlier. Figure 7 shows the full screen of the query.
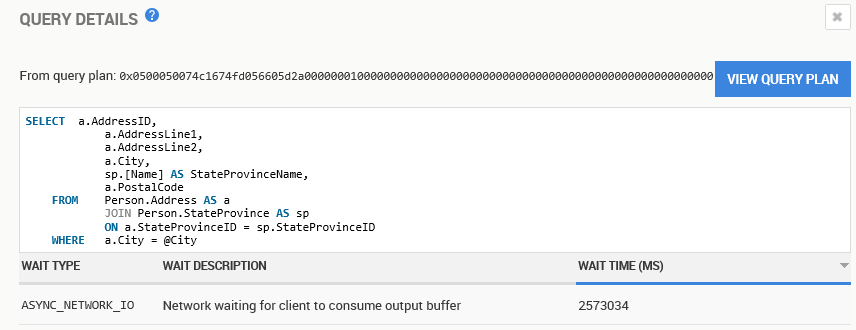
Figure 7
In general, when you identify a query that you think might be a good candidate for tuning, it’s a good idea look at the execution plan of that query. The execution plan is your window into exactly how the query optimizer decided that this query should be executed, which indexes should be used to access data in the tables, how to access that data (seek versus scan, for example), how to implement join conditions, and more.
All this helps you understand if there are tuning opportunities. In SQL Monitor, all we need to do is click on the View Query Plan button.
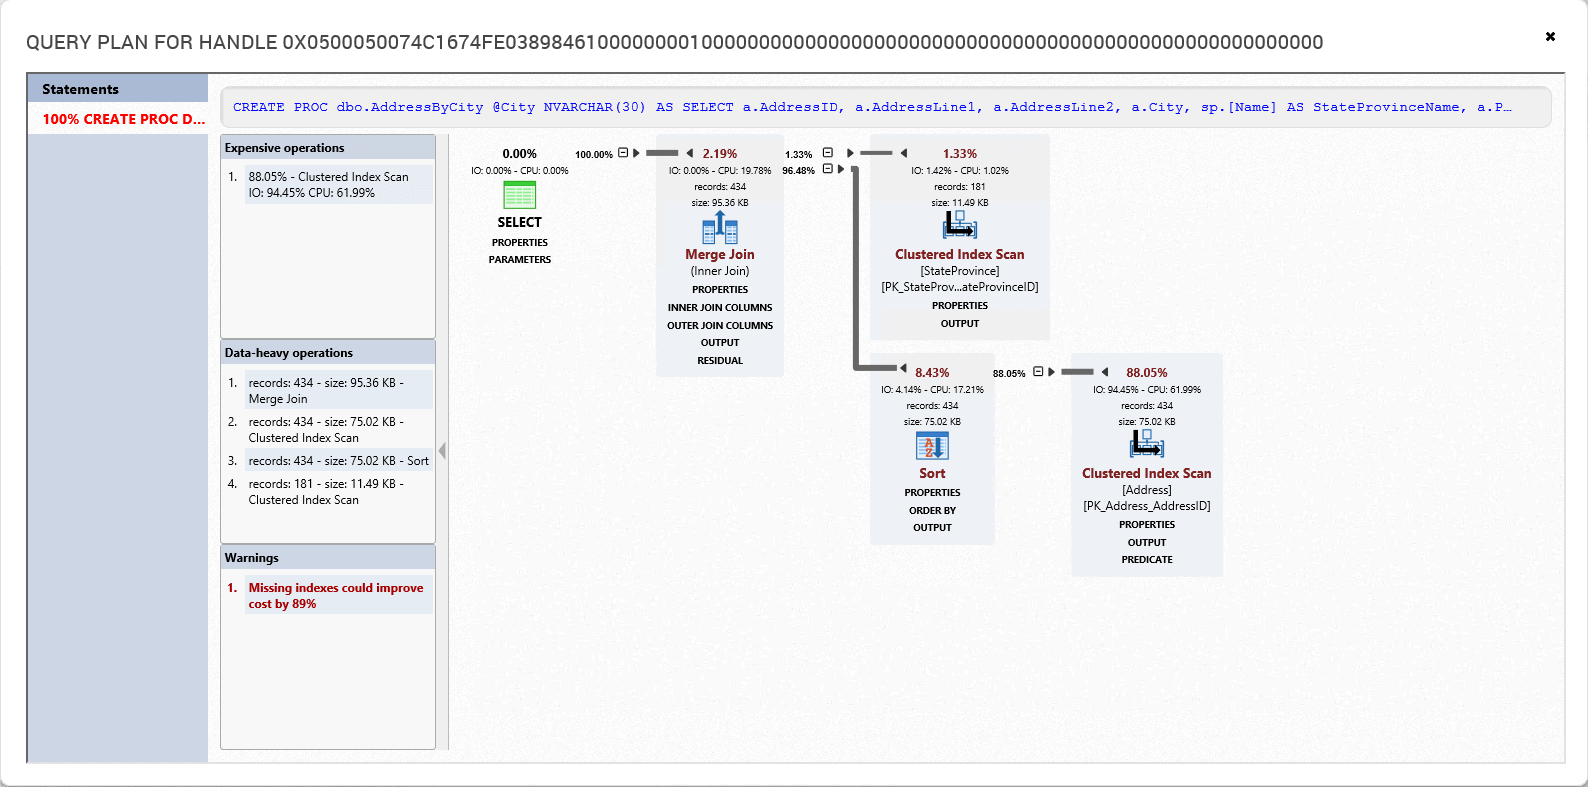
Figure 8
This opens an execution plan right in SQL Monitor, so you don’t even have to have SQL Server Management Studio running. The query plan handle is also supplied so that you could, assuming the plan is still in cache, query the server to retrieve the plan in SSMS, if you need to at some later date.
SQL Monitor displays the cached plan for this query, in the same general layout as the standard execution plans in SSMS. Rather than display all the properties for each operator in a separate Properties pane, we simply expand the PROPERTIES link under each operator. SQL Monitor also highlights certain operations and warnings separately, as shown in Figure 9.
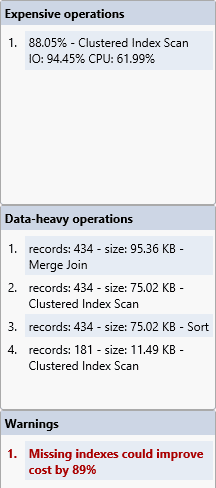
Figure 9
At the top, we see the most expensive operations in the plan, according to the optimizer’s estimated costs (and remember, even in an ‘actual’ execution plan, all costs are the optimizer’s estimated costs). These costs are useful in helping locate the highest cost operations in plans that are more complex than this one. The scan in question is the scan against the Address table’s clustered index. Next, we see data heavy operations, which are more likely to have a higher I/O costs.
Finally, there is a warning about a missing index. Clicking on the missing index suggestion, and you can look at the definition of the new index in order to evaluate it.
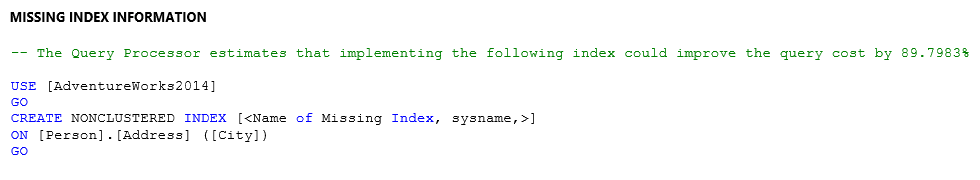
Figure 10
The query requires a search on the Address table for a particular city, but there is currently no non-clustered index ordered by City on that table, so the optimizer decided to simply scan the clustered index. This means that it would have scanned all the rows in the Address table, to return the relatively few rows that had the correct value in the City column.
This in turn means SQL Server will perform more logical reads (IO) than strictly necessary to return the required data. If we created the suggested non-clustered index, we’d likely see a new plan, with the optimizer seeking that new index, and retuning the data in fewer logical reads.
Bear in mind, though, that missing index warnings are just suggestions; you should not immediately go ahead and create every index that the advisor suggests. Sometimes the suggestions are wrong. Sometimes a different index will satisfy more than just this one query. Other times you may be calling this query only once so that creating an index is unnecessary.
The missing index hints are a useful guide, when query tuning, but they need careful evaluation. While the ‘missing index’ is clearly problematic for the query in question, you would want to capture query metrics on individual query runs, in SSMS, to assess the exact benefit of the index on run times and IO load.
You’ll also want to evaluate the index suggestion in light of the overall query workload. Are there other queries it would help? The missing index DMVs can provide additional useful data to help answer such questions.
Finally, will the index have a significant impact on the performance of write operations to this table? While it is rare for a single new index to cause problems, maybe there are already a large number of indexes on this table and adding another will cause undue stress during data modification when all the indexes have to be maintained.
In short, you need to have a good testing process to ensure your query tuning choices work well within the system.
Summary
At this point, we’ve used SQL Monitor to identify an unusual set of behaviors on the server. We’ve then been able to narrow down the behaviors to a particular query. Within that query we have the starting point for tuning the query to get better performance.
That’s everything you can expect out of a monitoring tool like SQL Monitor. From here, you would go to your development environment and test this solution to see if it helps. From there, you would implement the changes through your release process into production to help avoid these issues in the future.
Tools in this post
Redgate Monitor
Real-time multi-platform performance monitoring, with alerts and diagnostics
You may also like
-

Article
Inside Perspectives: What does AI mean for Redgate?
Jeff Foster, Director of Technology & Innovation at Redgate, explains how Redgate is approaching the AI revolution.
-

Article
SQL Server Licensing and SQL Monitor
How well do the SQL Server licenses you own match up with what you need for your current use? William Durkin explains how to use SQL Monitor to find out.
-

Webinar
The Value of Monitoring at BMW
With 100s of servers spanning multiple continents, BMW needed a way to efficiently monitor their large and growing estate. In this case study, Redgate’s James King speaks with Tony Maddonna, Microsoft Platform Lead and SQL Server Enterprise Architect at BMW, about how the company identified their monitoring need, the process they took to implement it,
-
Article
Tagging SQL Server Changes in SQL Monitor
How to use RAISERROR() in T-SQL to send annotations to SQL Monitor, so you can observe the direct impact of application tasks, or server changes, on the SQL Server metrics.
-

Business leaders webinar
Monitoring large estates at BMW
BMW have been monitoring their SQL Server estate for more than 7 years, but with evolving technology and increasing demands, monitoring needs to change and grow alongside. Join BMW's Tony Maddonna in conversation with Redgate's James King to learn more.


