Monitoring SQL Server with Splunk and Redgate Monitor
Splunk is a search engine for collecting and analyzing all sorts of "machine data", including log data and metrics for SQL Server. Redgate Monitor gives you the detailed diagnostic view of all your SQL Server instances, and databases. If you have Splunk to monitor your applications and server infrastructure, and Redgate Monitor to help you understand the behavior of a complex database system such as SQL Server, then you have a powerful and capable monitoring tool set.
Splunk is a suite of data collection, search and analysis tools, built around the consumption and indexing of ‘machine data’, such as log data, in order to turn it into information. One of the many capabilities of Splunk is real time monitoring of IT infrastructure. Specifically, Splunk can be used to monitor SQL Server instances. In this article I’ll explore how Splunk works to monitor SQL Server, explaining the metrics it gathers and making a case for why you will need to augment the capabilities of Splunk with Redgate Monitor, a dedicated tool for SQL Server monitoring.
How Splunk works
This article tackles only Splunk’s SQL Server monitoring capabilities, what it covers and what, in my opinion, it misses. However, Splunk offers a broad range of data collection and analysis tools so the intent of this brief section is to paint the SQL Server monitoring part into this bigger picture.
Splunk collects, parses, indexes and searches “big data”, or really any log data or machine data, including performance metrics, generated by the various parts of your infrastructure. It also provides analytical and machine learning tools to help you understand how you need to respond, to improve the system.
Splunk data collectors gather the data from your data sources (logs, feeds, metrics, files and so on) across a range of different platforms, networks, servers, applications, databases and services. Whatever data you need to collect, you’ll likely find an app or add-on that is preconfigured to collect it, or can configure it manually.
Raw data is parsed into “events” and stored in indexes, which are Splunk’s data repository, to make the raw data searchable and discoverable. Each event has a timestamp, host, source, and source type. An event might just be an error entry from a log file or the output from a performance metric, such as a perfmon counter. You can categorize events by type so you can start to work out when and how long your system spend processing certain categories of event, or what errors occur in relation to those events.
This ability to index your data such that it can be quickly and easily searched is one of Splunk’s strengths; it is sometimes referred to as a search engine for machine data and it can help you understand the cause of faults, track availability, capacity and performance, manage configuration and security of your server elements, and so on. So, for example, you might use Splunk to do your infrastructure monitoring, collecting metrics and log data for Windows servers (plus Linux, MacOS), as well as clusters, Docker containers and more. You can then extend the monitoring to SQL Server, as well as other relational database and NoSQL data stores, using the appropriate apps and add-ons.
You can run and save searches against all the data it collects, examining a combination of significant ‘events’ collected over the same timeframe, perhaps corelating SQL Server performance metrics and log data with detailed infrastructure data. You build visual dashboards from the results so that you can spot trends, correlations between different metrics, anomalous behavior, and start to understand the major causes of performance problems, downtime, and other system issues.
Splunk for SQL Server Monitoring
The first step, of course, is to install the Splunk application. If you’re running on Windows, you install the Splunk software through an Active Directory service, which must have access to all the various logs you want to feed it. After this, you must then install the SQL Server add-on for Splunk. With this done, you have a decision to make. If you’re using SQL Server Auditing, you’ll need to add some specific security to your SQL Server instance, as documented in the following link). I’ll skip this step, but it’s worth noting that Splunk has a mechanism for monitoring SQL Server Auditing.
With the application and the SQL Server add-on installed, you can use your Splunk distribution server, which may or may not also be your monitoring server, to install agents onto the SQL Server instances you wish to monitor. Running the install requires that you have the appropriate security configurations to allow the distribution server to run installs on these servers. Alternatively, you can install the agent on each server, independently, and in each case point it back to your Splunk server.
Configuring which performance metrics to monitor
You still have one more step to make Splunk collect data from SQL Server, which is to configure what data you want to collect, which you do by editing a configuration file called inputs.conf.
The Splunk add-on will, out-of-the-box, harvest data from the SQL Server Error log and SQL Server Agent log; you just need to configure it to the location of these files. To get additional data from other source files, and from the Dynamic Management Views, you’ll need to configure DB Connect (see later) and do a bunch of your own programming.
The SQL Server add-on can collect a range of metrics from the Performance Monitor counters for Windows and SQL Server. All metrics are disabled by default, so you’ll need to enable the ones you want to collect, in the configuration file. The counters it collects include those to monitor locks and latches, database size, processor time and others:
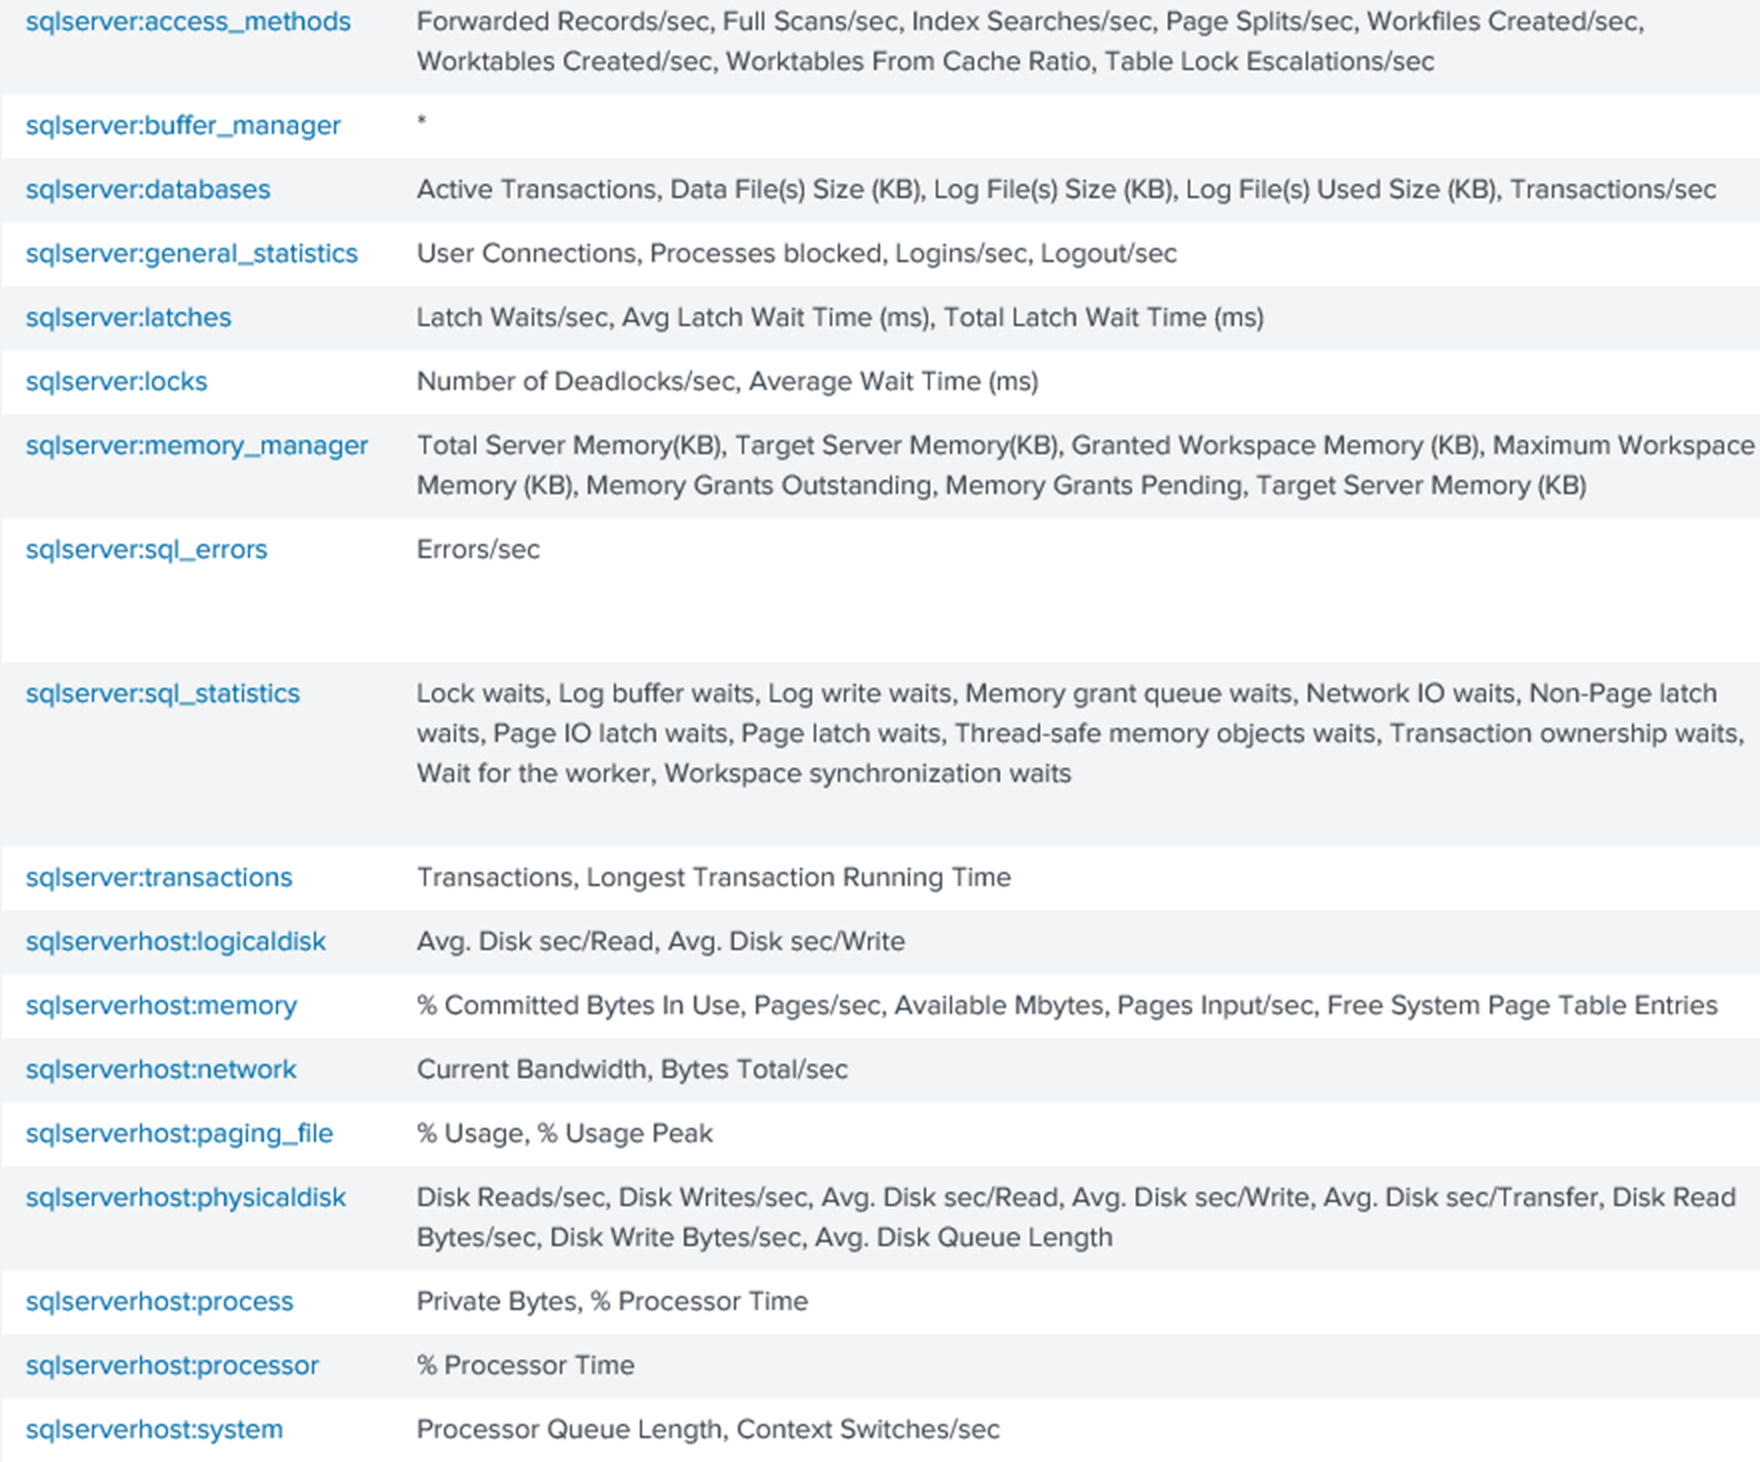
Once you’ve enabled the metrics you need, the information just starts flowing into Splunk.
Customizing data collection using DB Connect
Through a querying engine, called DB Connect, you can configure extra data inputs, from the standard set of SQL Server sources, including Dynamic Management Views, system catalog views, as well as the default trace logs and the audit log.
It is, I would say, a rather complicated process, and I’m not going to delve into it in detail. You have to follow the steps here, the last of which is to create and configure the database inputs. In order to implement DBConnect, you will have to write your own queries, or track down examples online. So, for example, if you wanted to collect extra data to help you troubleshoot Availability Group issues from the sys.dm_hadr_* DMVs, you need to understand how those DMVs go together and get the query you need in place with the appropriate data. You’ll then have to configure the rest of the Splunk system so that it can consume this data. None of this data appears in the SQL Server dashboard, unless you build it in yourself.
Viewing the performance metrics: Splunk dashboards
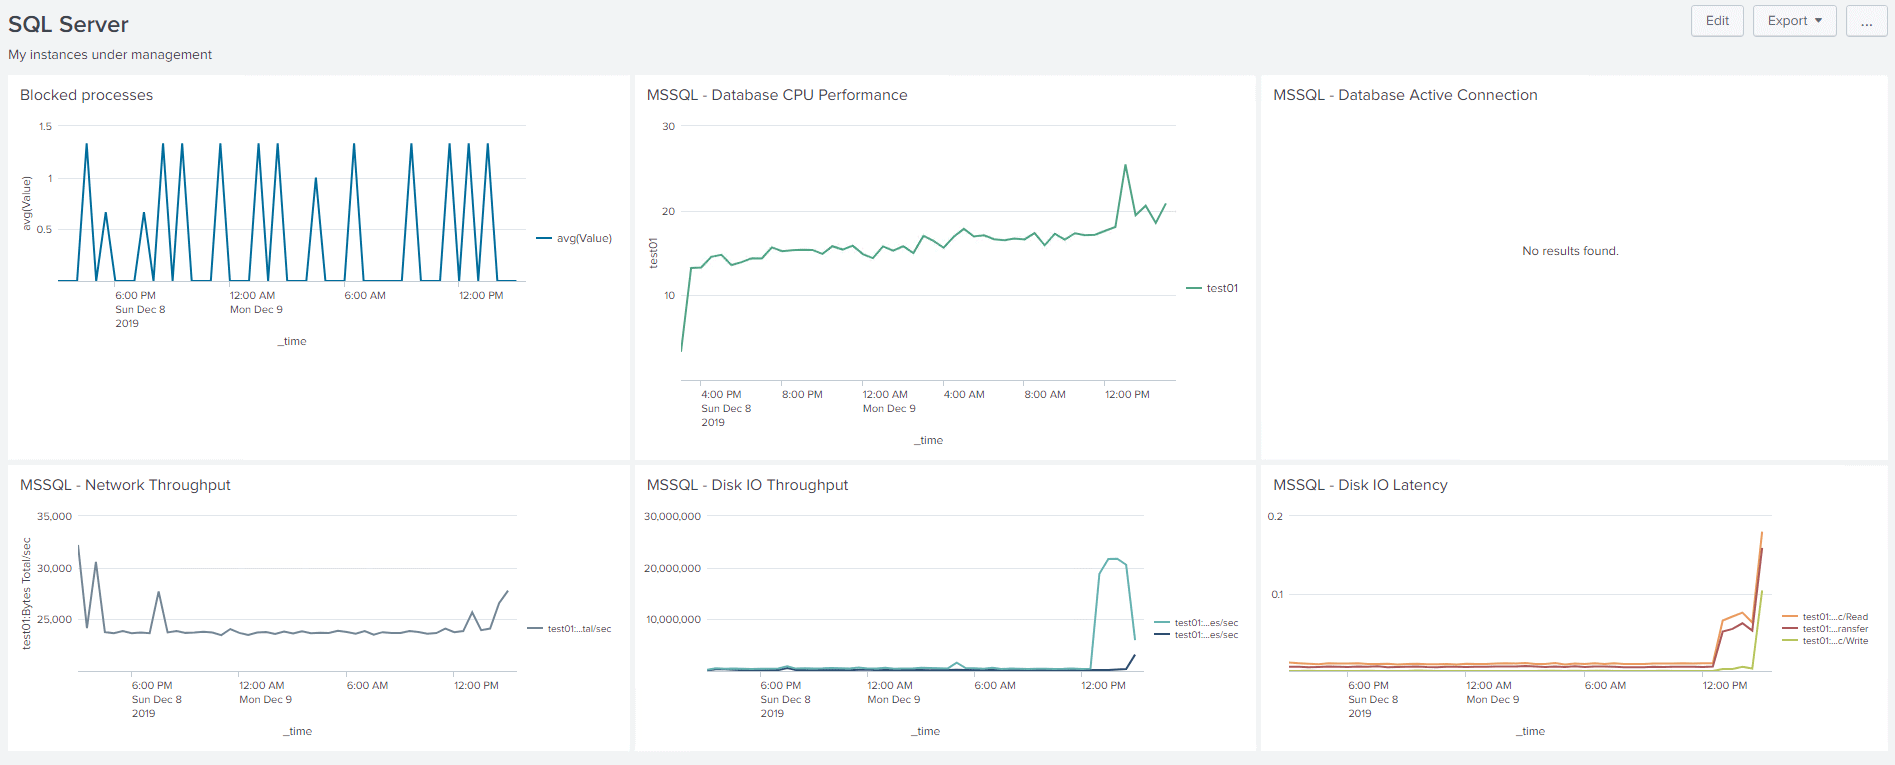
There are no predefined sets of reports for SQL Server within Splunk, beyond a few prebuilt panels for SQL Server that you can add to your dashboard:
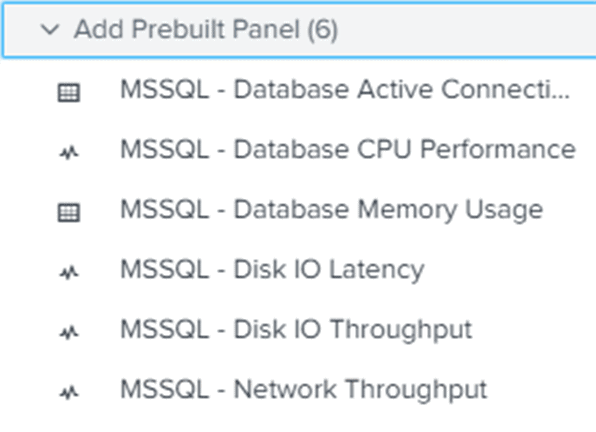
To add further reports to the dashboard, you must build them. You can use Search in Splunk to put together a query, then, with that query defined and returning the values you want, you can add that to a dashboard. For example, this query will show all the metrics collected on my test machine:
host=test01
The results are as follows:
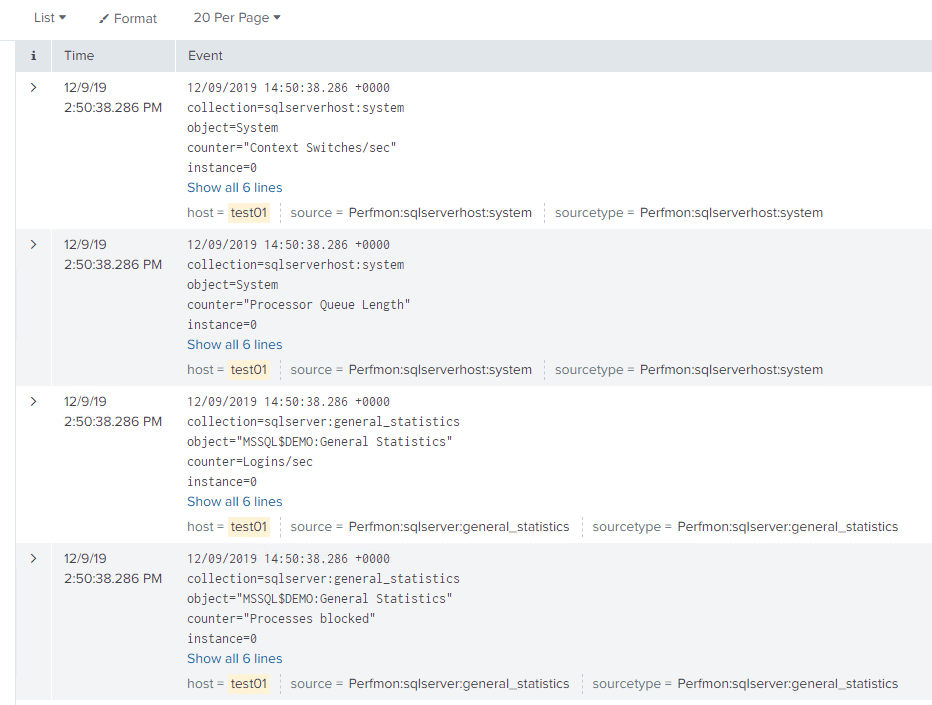
You can see that we’re getting all sorts of metrics from Context Switches/sec, at the top, to Processes blocked, at the bottom. In order to build a meaningful dashboard, we need to edit the information on display, such as filtering the data returned by each metric to include only the fields of interest. You can also change how the event data is displayed (raw, list or table).
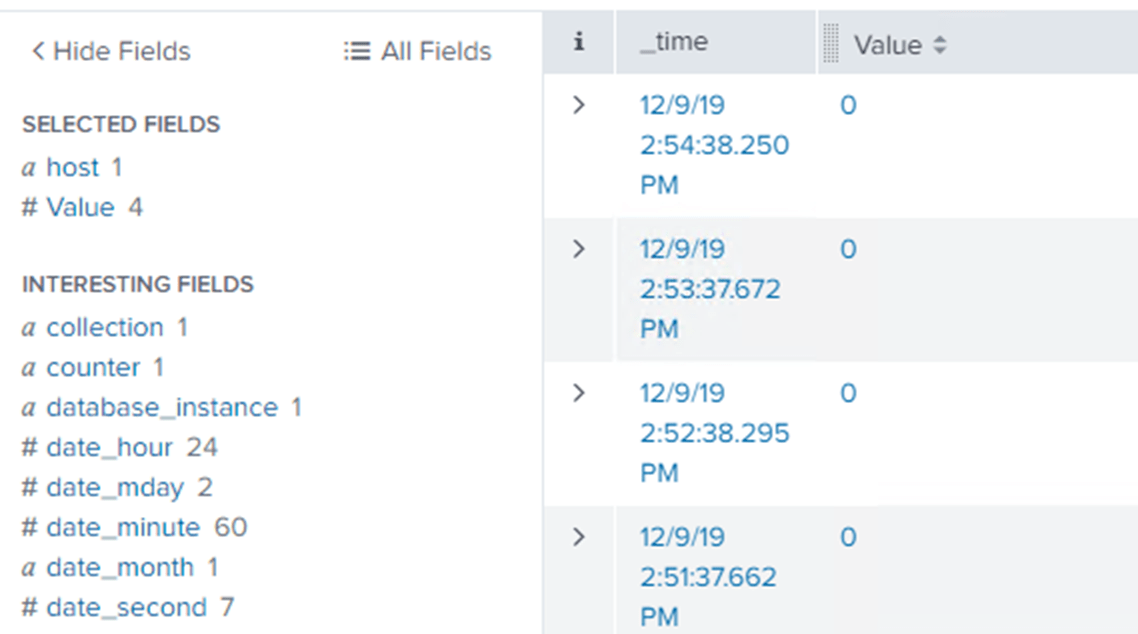
Here, for example, I’ve configuring the Process Blocked event. I’ve used the “All Fields” button to select only Value and host fields, so I can see show the number of blocked processes on the each monitored server (I also switched to a table layout).
To get a meaningful report out of this, showing the data in a more interesting way, I can click on the Value column. This will show me the distribution of the data and possible reports available:
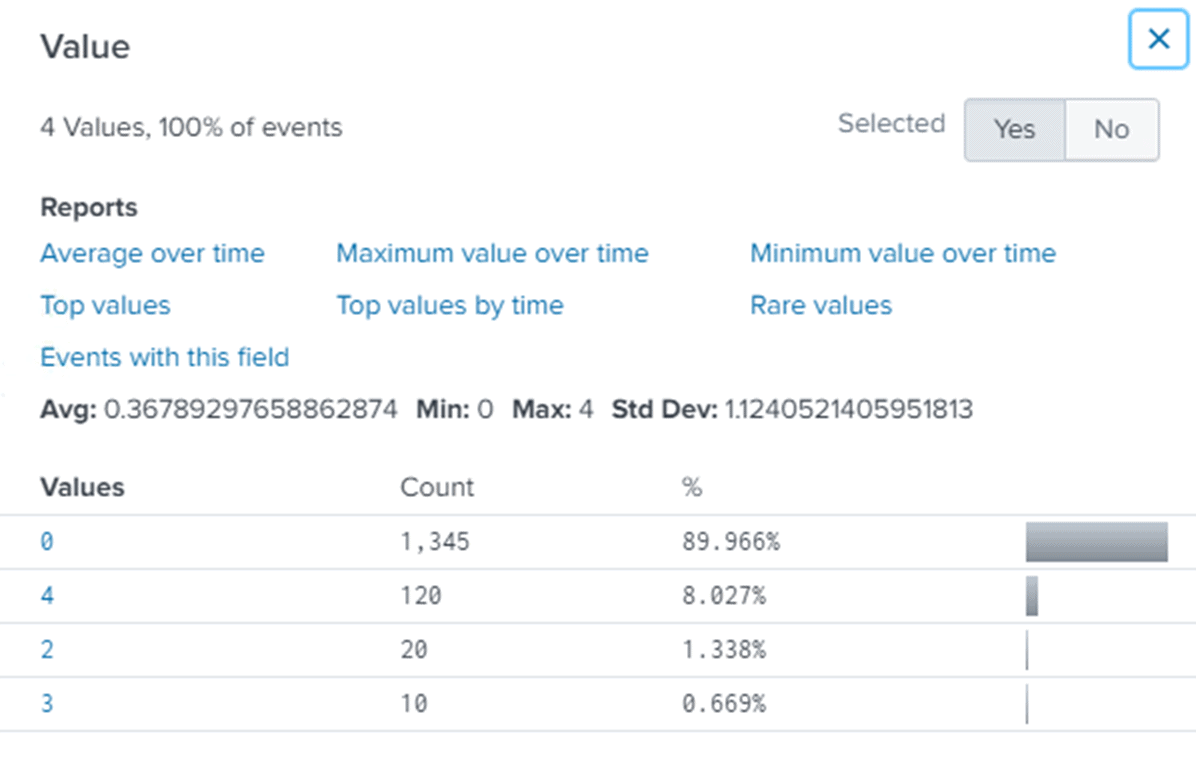
Finally, selecting the report Average over time then produces a visualization:
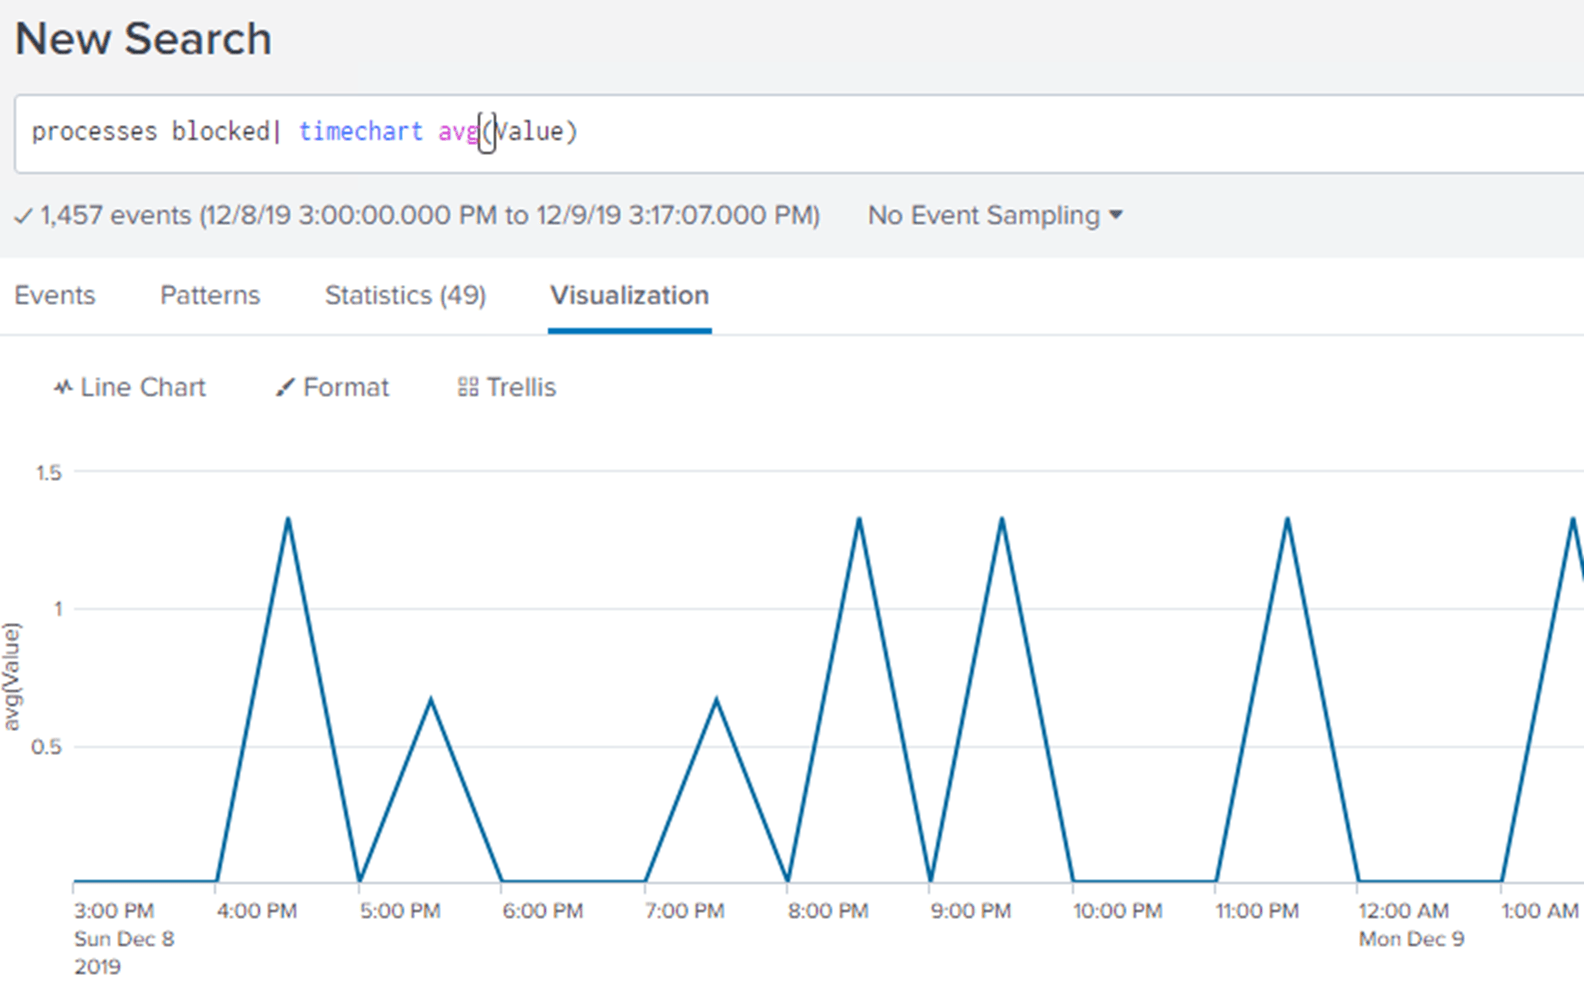
Now, if you wish, you can save this as a panel for a dashboard, giving it a name, ID and description and it will be added to the SQL Server dashboard along with the pre-built panels I mentioned earlier.
Clicking on any of the metrics will take you to the Search screen that we looked at earlier, where you can start the process of exploring the data all over again. Through this process, you can monitor SQL Server using Splunk. However, you are going to be tasked with quite a bit of work. You’ll have to learn how to explore the data that Splunk does collect. Then you’ll have to build your own dashboards in order to consume that data.
Pain points in SQL Server monitoring with Splunk
All this data gives you the basic set of information you need to start monitoring you SQL Server instances with Splunk. However, there are also quite a few hurdles to overcome and issues to address right out of the gate. Over the coming sections, I’ll describe what these are and why, as a DBA, you might struggle to get all the information you need from Splunk SQL Server Monitoring.
The obvious alternative to buy a specialist SQL Server monitoring tool, like Redgate Monitor. As an Advocate at Redgate, I’m not quite an impartial observer, but I’ll try to offer a straightforward explanation of why I think you’ll get better value from this investment in a specialist tool, rather than trying to build out your own solution by extending Splunk.
Splunk does a good job of collecting machine and log data from sources throughout your infrastructure, and then searching and analyzing it to better understand the behavior and performance of your application processes and systems. However, those tasked with understanding the behavior and performance of SQL Server still need the specialized details that only a dedicated SQL monitoring tool provides.
Steep learning curve
While it’s quick and easy to get set up SQL Server data collection for Splunk, the information is somewhat limited (I’ll cover this in the next section), and you’ll need to spend time building in the additional metrics you need. Then, to view that data, you’re going to have to build your own dashboards. This a time-consuming process, and my experience is that you probably will not get it right the first time. Of course, this is a process that gets easier over time, and allows a lot of customizability, although this usually then entails a maintenance burden.
Limited metrics
The metrics currently collected are focused almost exclusively on server behaviors. You do also get some database metrics, such as data file size, log size, and others. The performance metrics miss critical pieces of data like the wait statistics.
Overall, the standard set of metrics provide enough detail to know if your server is online and its general overall health, as well as overall performance load, but not enough to understand behavior.
Let’s say, for example, you wanted to get a list of queries that were running at any given moment in time, such as during a system slowdown. You want to see what resources these queries used over that period, any wait states associated with them, and their execution plans. You’ll need to do a lot of extra work to build all this same data into a Splunk dashboard.
You’d have to construct queries to collect the metrics and capture execution plans. You’d need to build a mechanism for capturing wait statistics, correlated to the queries. You’d have to program it all through DB Connect and then, finally, build a dashboard to pull all that information together and display it.
Lack of drilldown and correlation
When application queries are causing specific problems for the server, manifest in high CPU, disk IO, memory use, and so on, you’ll see these stress conditions in the dashboard, in the various default panels. However, you might have a harder time diagnosing the cause, because with Splunk, there is no easy way to connect these stress conditions directly to long-running and resource hungry queries that caused them.
If blocking occurs, or even a deadlock error, Splunk can alert you, but if you want to investigate the cause so you can prevent a recurrence of the same problem, you’ll need to look for that diagnostic data elsewhere.
No standard set of alerts
Splunk has a complex and versatile alerting system, driven by the Splunk query tools. There are no standard set of alerts for your SQL Server instances but it is straightforward to set alerts on the built-in metrics. You can then set a threshold, or multiple thresholds, as well as actions.
However, you’ll find that a lot of metrics and therefore alerts, that you need are missing. In each case, you’ll need to define the query you need to collect the data, create the custom metric through DB Connect, load it into the Splunk data collection, then set up alerts.
Limited scheduled monitoring (disks, backups, jobs)
If you want to monitor database size, for example, Splunk will collect perfmon counters to track the data, log and total database size, but you’ll have to manually create alerts to warn you if a database is growing unexpectedly.
In fact, to track database growth effectively, you also need to track the free space in the database files, so you can see when the files are going to need to grow, and corelate that to free space on the disk. This means that you will also need to create your own data collection for database free space using DB Connect, since that’s not a part of the standard set up of metrics collected by the Splunk SQL Server Add-on.
For monitoring backups and Agent jobs, Splunk can alert you to failures, because it monitors the SQL Server Agent and error logs. However, you do not get to see this detail in the SQL Server dashboard, but you can query that information, so you can create your own dashboard if you wish.
Advantages of a dedicated SQL monitoring tool
By contrast, a dedicated SQL monitoring tool such as Redgate Monitor, gives you, out of the box, all the instance and database metrics, and associated alerts, you need to spot problems, detect trends and diagnose issues. You can refine and customize your monitoring strategy, using custom metrics, based on what you learn about your system behaviors and gradually fine-tun your alerting strategy to arrive at a high signal to noise ratio.
Redgate Monitor is focused on monitoring SQL Server so goes much deeper than the basics of “is the server online” and “how much CPU is it using“. You get to see the direct correlations between the system behaviors, and the query behaviors, specific waits occurring around that time, and more.
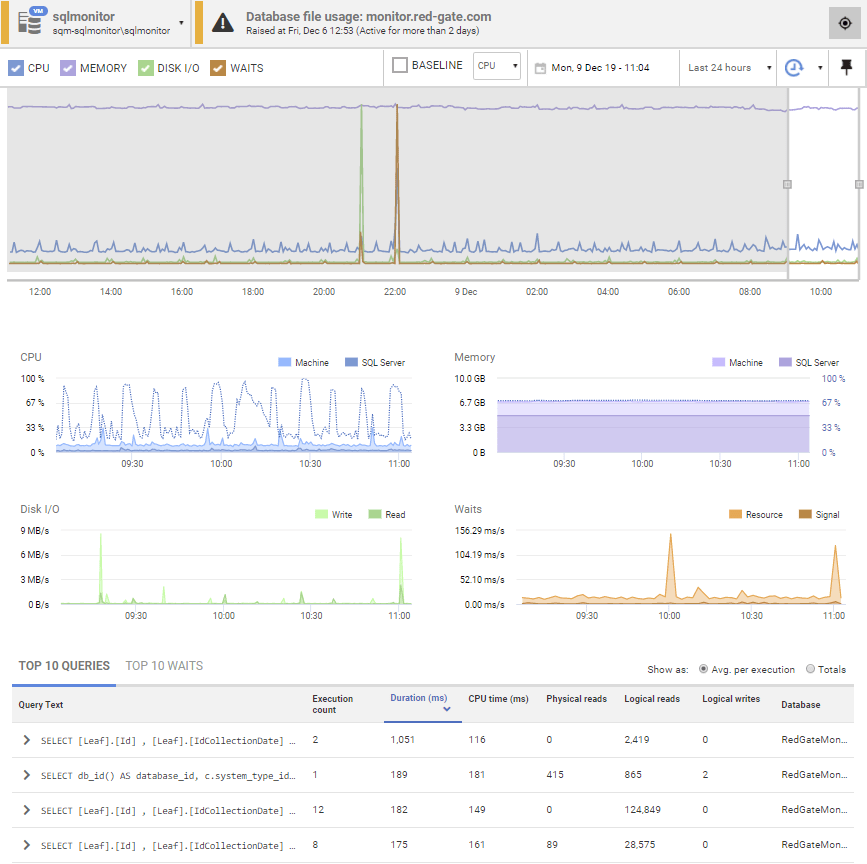
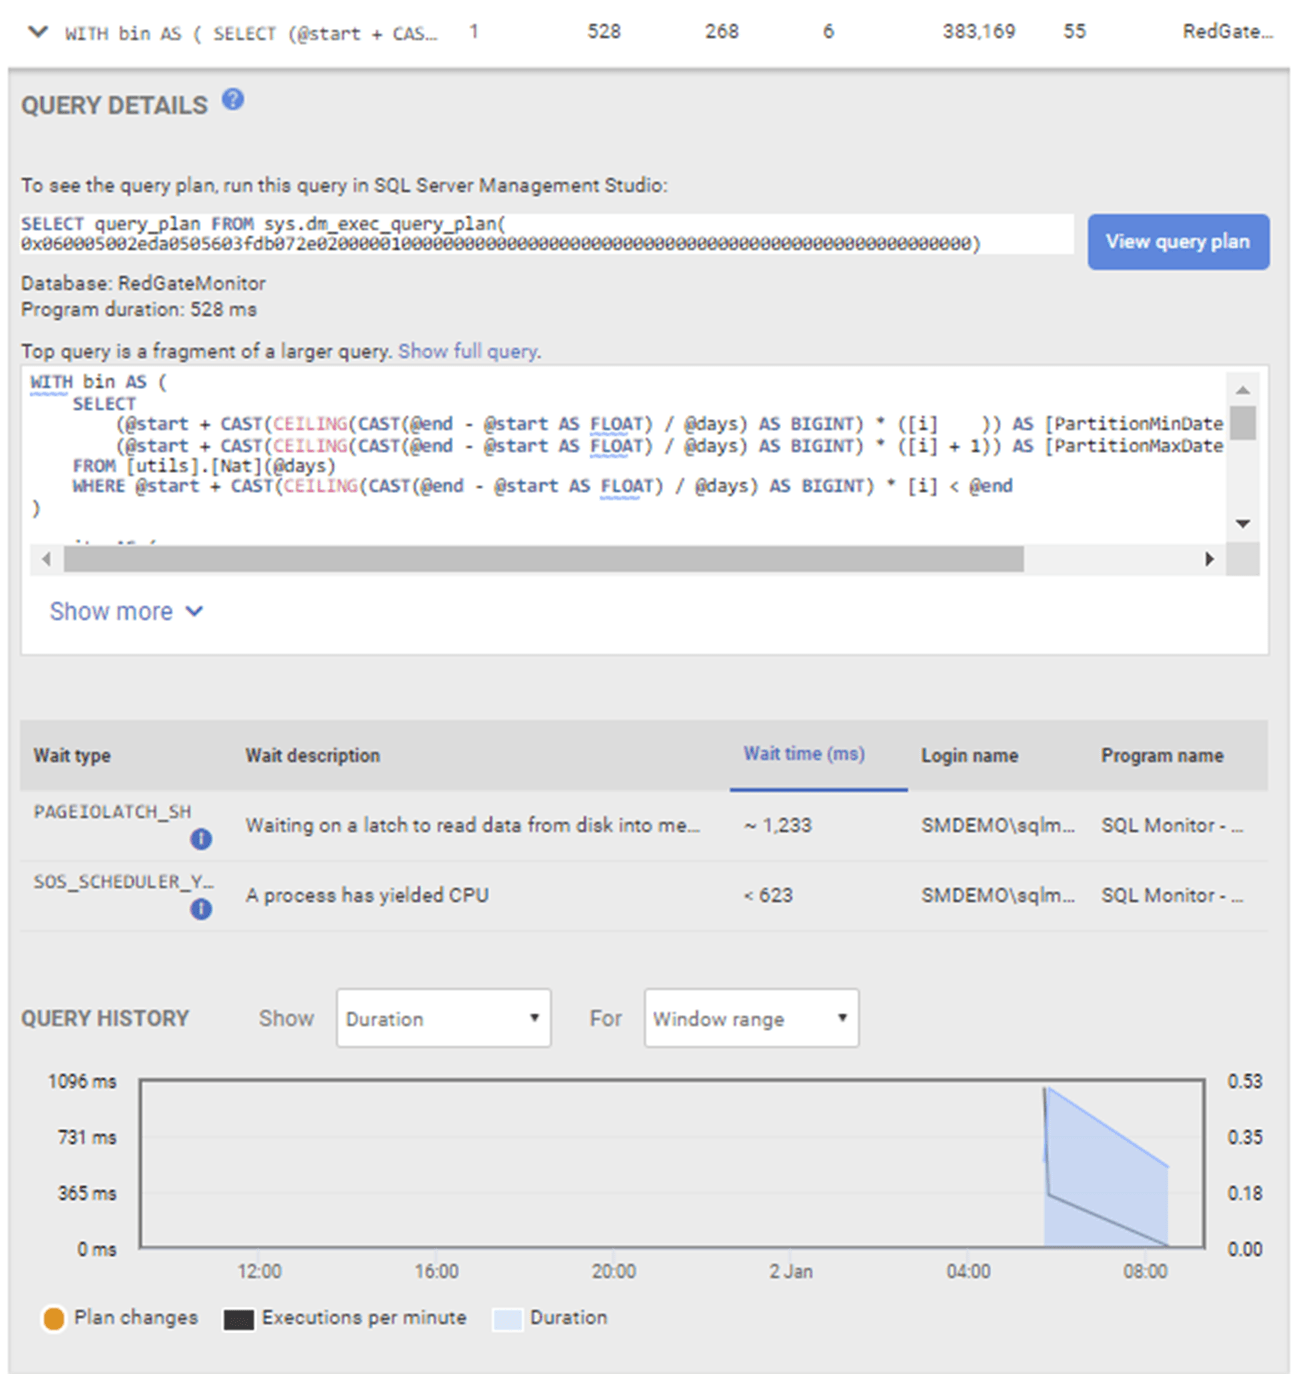
Further, each of these metrics offers additional drill down and guidance that can assist you in troubleshooting issues with your SQL Server instances. Returning to our earlier example about needing to see the resource use, wait states and execution plans for the queries running during a certain period, you get al of this in a single pane:
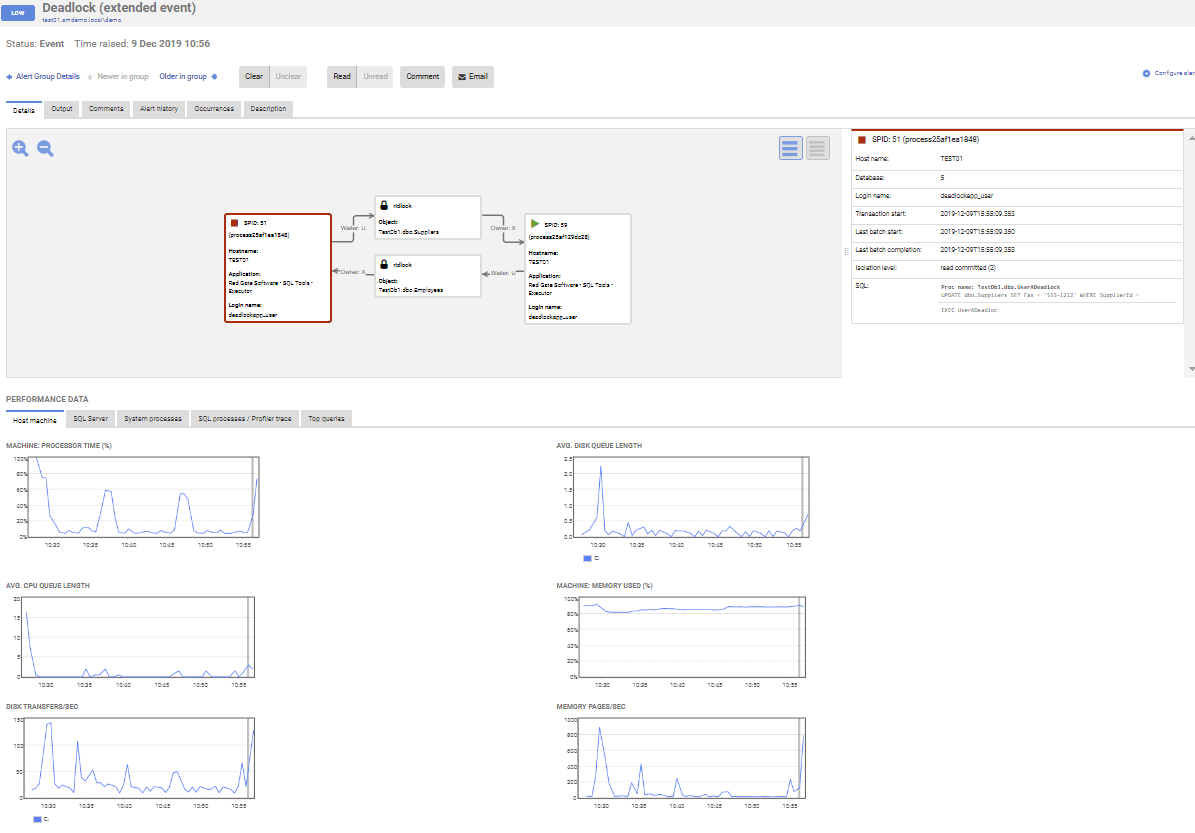
If blocking is causing performance problems, you’ll get to see the full blocking chain, in a clear graphical format, and you can use it to diagnose and resolve the blocking quickly. If the built-in deadlock alert fires, it supplies the full deadlock report with the actual deadlock graph, and the queries and processes involved.
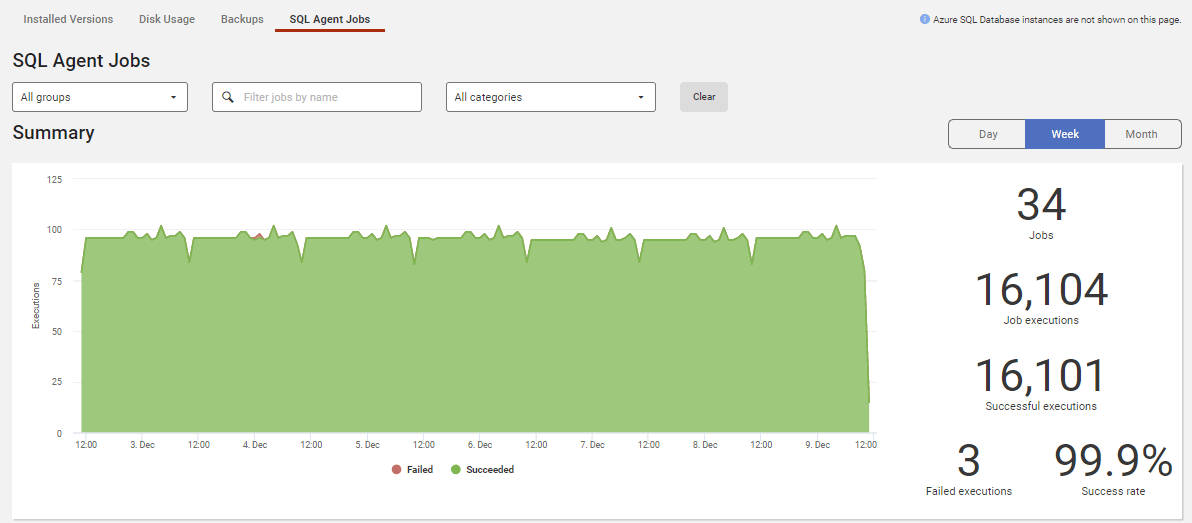
For scheduled monitoring tasks, Redgate Monitor captures metrics on your backups and SQL Agent jobs and shows you how many are successful, how many failed, how long they ran, if any run times were abnormal and more:
These are just a few examples of the detailed information gathered out of the box with Redgate Monitor. This information is vital to understand how your SQL Server instances are behaving, the queries running there, Agent Jobs, and more.
Conclusion
The point of this article was not to question the functionality of Splunk. It works extremely well and is a useful tool. However, those tasked with monitoring and understanding the behavior of a complex database system such as SQL Server, and solving problems quickly, will need more than the rather superficial set of metrics that Splunk supplies.
Anyone who needs to know much more than the load on your SQL Servers and the fact they are available, will need to augment the work that Splunk is doing. Redgate Monitor offers an excellent compliment to the information available through Splunk.
Tools in this post
Redgate Monitor
Real-time multi-platform performance monitoring, with alerts and diagnostics
You may also like
-

Article
PostgreSQL Spill to Disk Recommendations in Redgate Monitor
When processing a query in PostgreSQL that requires more memory than it's configured to allocate, data will be spilled to disk to complete the query operations. This can introduce performance bottlenecks. Redgate Monitor now includes recommendations for PostgreSQL that warn you when a spill occurs and will help you understand why and what you can do to avoid it.
-

Business leaders webinar
Monitoring large estates at BMW
BMW have been monitoring their SQL Server estate for more than 7 years, but with evolving technology and increasing demands, monitoring needs to change and grow alongside. Join BMW's Tony Maddonna in conversation with Redgate's James King to learn more.
-
Article
Tracking Azure Elastic Jobs using Redgate Monitor
Redgate Monitor has long helped data teams and DBAs keep track of SQL Agent Jobs. Now, with version 14.0.53, it extends that visibility to Azure Elastic Jobs, giving you a centralized view of all your scheduled tasks, whether they run on SQL Server, Azure SQL Managed Instances, or Azure SQL Databases. What is an Azure
-

Business leaders webinar
Artisan Partners on database technology trends
Join Matt Schmelzer, Data Systems and Automation - IT, and Jonathan Holck, IT Associate, from Artisan Partners in discussion with Microsoft MVP Grant Fritchey to learn how they implemented a successful infrastructure and what tools they need to support their growing estate.
-

Webinar
Monitoring Amazon RDS with Redgate SQL Monitor
With the upcoming launch of SQL Monitor 11, you will be able to monitor your SQL Servers hosted on Amazon RDS alongside your on-premises and other cloud-based servers, instances, and databases. Discover the benefits of monitoring your entire estate, including on-premises and cloud-hosted databases, from a single pane of glass.