How to monitor the impact of patching on SQL Server performance
This article uses the Spectre/Meltdown bugs as means to demonstrate how you can use a tool like Redgate Monitor to assess the impact of patching on the throughput and performance of your SQL Servers.
Meltdown and Spectre are two famous examples of serious processor vulnerabilities , which an attacker can exploit to obtain information to which they should not have access: specifically, information cached in the operating system kernel’s private memory. High-profile bugs such as these serve to reinforce the fundamental responsibilities of the operations team on discovering any bug or vulnerability that could compromise the data in their care. Firstly, apply all appropriate patches as quickly as possible; protect the data. Secondly, assess the likely impact of patching on server performance and workload throughput. Thirdly, monitor the actual impact, and respond quickly if it is more severe than anticipated.
I’ve included references at the end, for in-depth technical descriptions of the vulnerabilities, which result from fundamental CPU design flaws. In broad terms, it means that an unprivileged user could access information (passwords, encryption keys, confidential data) in one software program, from another, or in one virtual machine from another. These bugs can even be exploited from JavaScript.
Apply the security patches
The first and most immediate responsibility of the DBA in response to any discovered security bug is, of course, to apply all necessary OS and SQL Server patches to ensure that data is protected. As the ICO notes:
“Failure to patch known vulnerabilities is a factor that the ICO takes into account when determining whether a breach of the seventh principle of the Data Protection Act is serious enough to warrant a civil monetary penalty.”
The usual advice applies: follow Microsoft’s recommendations about what security updates you should apply. In the case of the Meltdown and Spectre bugs, they have a good summary of what you should do in different scenarios, as patching isn’t necessarily required.
The most vulnerable environments are those that share a CPU with any code you don’t trust, possibly because you’re running in a virtualised environment where a different VM shares your underlying physical CPU.
Assess the likely impact of patching
The DBA’s next responsibility is to understand and predict any likely impact of the patches on throughput and performance. The patches for the Meltdown and Spectre bugs, for example, are known to hurt CPU usage, which will in turn impact performance. As a DBA, performance, regardless of the underlying cause, is ultimately your responsibility.
There are a few early benchmarks observing a performance impact of anywhere from 2-3%, ranging all the way up to 30%. The likely impact depends on the workload, and I’ve not done any benchmarking on SQL Server yet. However, as Terry Myerson points out in a recent update from Microsoft, patching in this case should have the greatest effect on workloads that cause significant IO, and a lot of context switching, back and forth with the kernel.
Given that SQL Server is an IO intensive application, you’d expect the impact of these patches on SQL Server to be meaningful, though you’re unlikely to see outcomes anywhere near as bad as that 30% figure (unless your server is CPU-bound).
In any case, it’s a good time to assess the size of CPU usage increase with which your servers could cope, without performance being affected significantly. Here, for example, is the CPU usage, over the last few months, for the machines that run SQLServerCentral.com. The busier primary machine usually hovers between 30 – 50% CPU usage, and rarely spikes above 60%.
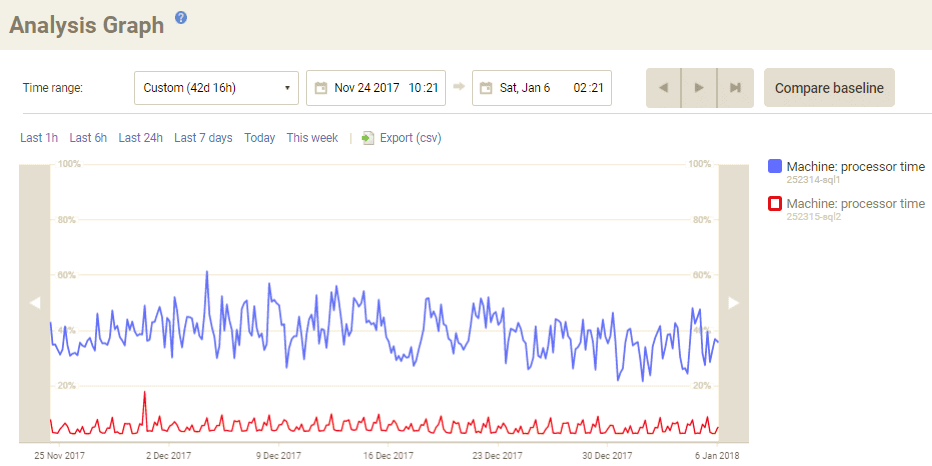
The lucky DBAs will be running SQL Server on massively under-utilised hardware, providing room for any spikes in CPU activity. For example, StackOverflow’s database servers have an average 4% CPU usage / 15% peak.
Not everyone has that luxury, and servers that are already running hot, to minimize wasted capacity, or for some other reason, are likely to be most vulnerable to degraded performance. It’s a good idea to stay on top of figures like this so you know where you stand.
Monitor the real impact carefully
You’ll find it much easier to establish proper baselines for important SQL Server performance metrics if you use a monitoring tool. These metrics often vary throughout a day, week, or month in semi-predictable patterns, so looking at simple averages doesn’t cut it – you need to understand how these patterns have changed.
Baselining shouldn’t usually be limited to examining CPU usage, though in the case of Meltdown it’s the first thing I’d recommend examining. Here for example, Redgate Monitor shows how a 24-hour period of CPU usage on that same SQLServerCentral.com machine, compared with several previous days’ figures.
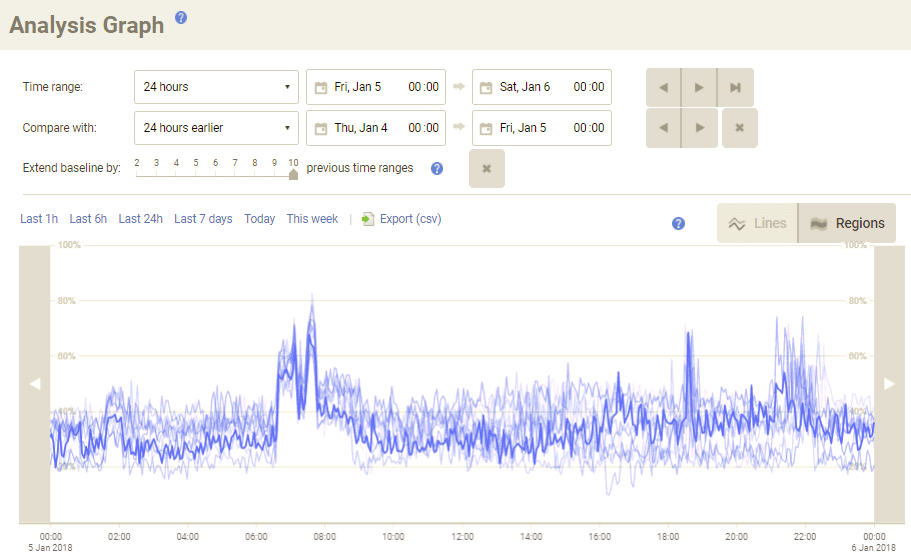
When we patch this machine, the very first thing we’ll do is explore some metrics like this to make sure that any increase we see is within the bounds of acceptable. It looks like this machine will have enough spare capacity to cope, but in other environments we might need to consider moving some of the workload onto separate hardware, or looking at other performance tuning options.
A monitoring tool will help with performance impact analysis
When you make any change, whether to apply an OS or SQL Server patch, make a configuration change, or perform an application deployment, you should consider before-and-after performance. Of course, this rule is especially relevant when a patch, or any other change, comes wrapped in a big red “may hurt performance” warning.
Once a monitoring tool like Redgate Monitor is up and running, it builds up a history of easily-visualisable diagnostic data. This means that when you need to make an urgent and significant change to the system, such as applying patches for bugs like Meltdown and Spectre, you’re able to see its impact. You can’t retrospectively build up that historic data on demand, so the best time to set something up is now.
As well as the baselining capabilities shown here, also available for dozens of other metrics, and other deep drill-down capabilities, Redgate Monitor lets you build and schedule detailed reports. These help you understand the health of your entire SQL Server estate, while highly configurable alerts ensure you’ll know about unexpected behaviour whether you’re actively looking or not. In this case, we’d have quickly known about it if CPU usage went above or below thresholds for a sustained period.
You can download a free 14-day trial of Redgate Monitor to start tracking an unlimited number of servers. And if you’d like any help, just get in touch.
Further Reading on Meltdown/Spectre
High-level:
- http://www.theregister.co.uk/2018/01/04/intel_amd_arm_cpu_vulnerability/
- http://sqlha.com/2018/01/04/no-good-terrible-processor-flaw-sql-server-deployments-nearly-everything-need-know/
- https://iconewsblog.org.uk/2018/01/05/meltdown-and-spectre/
In-depth:
- https://www.sqlpassion.at/archive/2018/01/06/understanding-the-meltdown-exploit-in-my-own-simple-words/
- https://googleprojectzero.blogspot.co.uk/2018/01/reading-privileged-memory-with-side.html
Tools in this post
Redgate Monitor
Real-time multi-platform performance monitoring, with alerts and diagnostics
You may also like
-
Webinar
A day in the life of a DBA using Redgate Monitor: For Performance & Security
Watch On-Demand. A webinar series for database professionals in the Nordics, Benelux, and beyond. Learn best practices from the Nordics and Benelux region, tackle challenges, and sharpen your DevOps skills with expert-led sessions.
-

Article
SQL Server Licensing and Redgate Monitor
How well do the SQL Server licenses you own match up with what you need for your current use? William Durkin explains how to use Redgate Monitor to find out.
-
Article
Query Executions in Redgate Monitor
Query Executions in Redgate Monitor captures individual query executions for long-running queries, providing deeper insight into database workload and resource usage. This helps DBAs diagnose performance issues with greater accuracy.
-

Workshop
Redgate Workshop Köln - Observability in Action
Datenbankumgebungen werden größer, verteilter und komplexer. Umso wichtiger ist es, jederzeit zu wissen, wie es um Performance, Sicherheit und Compliance steht. In diesem Workshop zeigen wir Ihnen praxisnah, wie Sie mit Redgate Monitor den Überblick behalten, egal ob Ihre Systeme On-Premises, hybrid oder in der Cloud laufen. Nutzen Sie die Gelegenheit, praxisnahe Monitoring-Kenntnisse zu erwerben und direkt anzuwenden.
-
Article
Tagging SQL Server Changes in Redgate Monitor
How to use RAISERROR() in T-SQL to send annotations to Redgate Monitor, so you can observe the direct impact of application tasks, or server changes, on the SQL Server metrics.