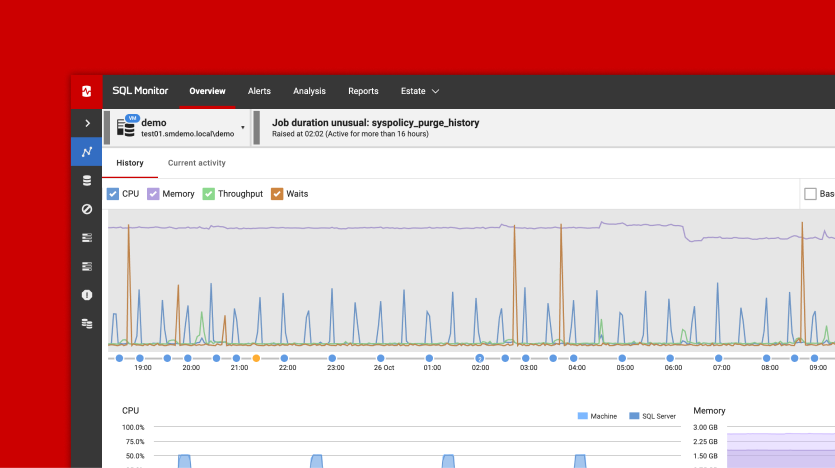
An alert tells you something is wrong. Getting to why means lining up timeframes, working through metrics and deciding which signals matter, all before you can test a diagnosis. This month, both the Monitor MCP Server and Redgate Assistant have moved from private into public preview, so your team can…Read more
Teams running Aurora PostgreSQL today have limited options for keeping on top of cluster health. CloudWatch gives you raw metrics and alarms, but no unified view of performance and health of nodes within a cluster, and no built-in way to go from an infrastructure metric to the query behind it.Read more
This guide explains how to use Redgate Monitor's Custom Metrics feature to monitor Oracle Automatic Storage Management (ASM). You will learn what Oracle ASM is, why monitoring it matters, how custom metrics work in Redgate Monitor, and how to build and deploy the most valuable ASM metrics for your environment.Read more
Avoid paying for unused CPU power, on-prem or in the cloud. This guide shows how to use Redgate Monitor to identify overprovisioned SQL Server VMs, reduce licensing and compute costs, and ensure your workloads still run smoothly. Read more
Query Executions in Redgate Monitor captures individual query executions for long-running queries, providing deeper insight into database workload and resource usage. This helps DBAs diagnose performance issues with greater accuracy.Read more
This article explores dynamic alerting, what it means, why it matters for DBAs, and how it works in Redgate Monitor. Learn how machine learning-driven thresholds increase alert relevance, helping teams focus on real performance issues while saving DBAs time.Read more
Managing database security, compliance, and performance across a complex estate is no easy task. Redgate Monitor Enterprise brings all the data you need into one place. This article explores how it helps DBAs track user permissions, ensure configuration compliance, create custom reports, and implement resilient high-availability monitoring.Read more