Custom Metrics for Detecting Problems with Ad-hoc Queries
Overuse of ad-hoc queries by applications is a common source of SQL Server performance problems. The symptoms include high CPU and memory pressure. Phil Factor offers a simple custom metric to monitor the percentage of ad-hoc queries being executed on a database, and shows how SQL Monitor can detect when the problem is happening, and show you the queries that are affecting the server.
Whatever development methodology you use, you must check on the quality of the code before releasing a version of a database. This isn’t just a general check for ‘technical debt’ or code smells; you must also make sure that queries are not hogging resources on the server.
A common crime is the unnecessary overuse of ad-hoc queries by applications. This isn’t always the work of developers, who are nowadays far better educated on the virtue of parameterizing queries, if only because of SQL Injection. More often, the culprit is an Object-Relational Mapping (ORM) layer between the application and the database, an application library, or even a widget such as a data lister with scrollbars.
Although SQL server can detect parameters in simple ad-hoc queries, it cannot do so if query parameters are not consistently defined in terms of the implied datatype. Even parameterised queries would require several cached plans if the parameters are not consistently defined. The symptoms, if things get bad, can be high CPU and severe internal memory pressure, so you are likely to run the same query frequently, but with different values, it is worth parameterising it, whether the code is in the server or the application.
However, we need a way to detect when the problem is happening, root out the culprit queries and see what we can do to fix them, whether it’s by parameterizing them, re-engineering them in a less iterative way, or by optimising the server for Ad-hoc workloads. This article is concerned with the first two activities, detecting when the problem is happening and finding the queries that are affecting the server. I’ll be using SQL Monitor and some custom queries, because that provides the baseline and will detect a sudden spike in Ad-hoc workload when the rogue queries are used.
Acute and chronic problems with ad-hoc queries
There is nothing wrong with the occasional use of an ad-hoc SQL query, but there is usually something very wrong in running a query repeatedly without parameterizing it.
The worst crime, of course, is unleashing a burst of ad-hoc, unparameterized queries, which run iteratively, row-by-agonizing-row (RBAR), instead of a single set-based query. The RBAR approach increases the amount of CPU processing the server must perform, in continuously compiling new plans. It wastes memory resources, using buffer cache memory to store plans that may only ever be used once and, in some cases, it can lead to memory pressure. It creates a lot of network traffic. If the RBAR approach is only a hundred times slower, it is doing well.
There are two subtly-different sets of symptoms, depending on whether problem is acute or chronic. A sudden, ‘acute’ crisis can happen when a mass of ad-hoc queries is executed for the first time, and the ‘chronic’ condition happens when SQL Server is forced to accommodate a high level of ad-hoc queries, over a prolonged period.
The monitoring ‘fingerprint’ in each case, is subtly different. You are certainly likely to see, in both cases, a high CPU and memory usage on the server, but you’re also likely to see that with a high transactional workload. In the case of ad-hoc queries, it is the excessive query compilation that creates high CPU load on busy systems, without corresponding locking. However, whereas acute RBAR will be accompanied by a sudden rise in the cache memory used, and a drop in the query performance, chronic RBAR won’t show such variations, because the compilations cease when the bloated plan cache holds cached plans for all possible parameter values; it helps to be able to flush the buffer cache before running a test.
In either case, you can deal with the problem in several ways. You can activate the server setting Optimize For Ad Hoc Workloads, so the optimizer stores only a small plan stub on first execution, then a full plan if it executes the exact same query again. If you’re feeling brave, you can enable forced parameterization for a database, to persuade SQL Server to lower its criterion for auto-parameterization. You can apply a fixed query plan to a plan guide, to minimise the impact of the individual queries. Of course, you can also just increase the server memory
Alternatively, however, you can find the source of the infection and refactor the offending code to a set-based operation if possible, parameterizing the code, or by converting the repeated query to a stored procedure, or parameterized batch. Obviously, I much prefer the refactoring option, because of the striking improvements that you can get. However, high CPU and memory usage are symptoms with a lot of possible causes; it is rather like going to the doctor with a headache. This means that diagnosis can involve a lot of detective work with DMVs, and will inevitably mean delving into the cached query plans.
DMV metrics for investigating use and abuse of the plan cache
SQL Server stores all pages in an area of memory called the buffer pool, which contains the data cache and the plan cache, as well as some smaller caches. The plan cache has four main cache stores and for this exercise we are most concerned with the SQL Plans cache store (CACHESTORE_SQLCP), which includes the plans for ad-hoc queries, auto-parameterized queries, and prepared statements.
Listing 1 will tell you the proportion of each type for the entire cache. To narrow it down to just the plan cache, just add a WHERE p.cacheobjtype = 'Compiled Plan' filter.
|
1 2 3 4 5 6 7 |
SELECT p.objtype, Round((Cast(Count(*) AS FLOAT) / (SELECT Count(*) FROM sys.dm_exec_cached_plans) ) * 100, 2) AS plans_In_Cache FROM sys.dm_exec_cached_plans AS p GROUP BY p.objtype ORDER BY plans_In_Cache |
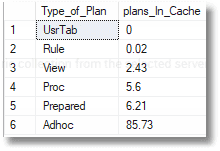
Listing 1
That Adhoc percentage value is an obvious one to watch but, as discussed, to make it effective, you may need to clear out the cache first.
Another obvious metric to use is Cache Memory Used (MB), the amount of memory used by the cache. It is a slightly complicated one because, again, SQL Server will take measures to reduce the size of the plan cache, when it’s under memory pressure, but it is a direct measure of the resources
|
1 |
Select Sum(size_in_bytes)/1024/1024 FROM sys.dm_exec_cached_plans |
Listing 2
A final candidate for a metric might be Execution Reuse: the percentage of query executions that have been able to reuse plans.
|
1 2 3 |
SELECT Sum(CASE WHEN deqs.execution_count > 1 THEN deqs.execution_count ELSE 0 END) * 1.00 / Sum(deqs.execution_count) * 100 FROM sys.dm_exec_query_stats AS deqs |
Listing 3
None of these metrics work like a speedometer. The plan cache can prove to be a striking archaeological record with today’s servers, and it will flatten out variations in the value of Percentage of Ad-Hoc Queries. The various strategies SQL Server has for compensating for ad-hoc workloads (discussed earlier) will also have an effect.
If the ad-hoc query abuse is so bad that it is causing memory pressure, then the system will react by trimming the cache, and the plans for ad-hoc queries are, understandably, among the first to be cleared out, so you can see the metric values fall, even if the “speed” of ad-hoc query generation is the same. However, the whole point of monitoring these metrics is to catch the problem, before the server is rolling around in pain.
Setting up custom monitors for ad-hoc queries in SQL Monitor
What we want to do is clear out the plan cache, run various parts of the application, and spot when the problems happen by tracking our metrics. Obviously, this is best done during pre-release testing but in the past I’ve also done it on a live server, at the weekend.
SQL Monitor is ideal for this sort of testing, because it will obligingly run any SQL Command you give it, as long as it returns only a single integer. It will capture the metric once a minute and create a graph of the result, so you can see the changes in the value, when they happened, and how they compare with a baseline.
With custom metrics, you’ll need to test them first, both to assess the overall impact of the collection process, and to find out which ones are most effective at uncovering the problem. The whole point of custom metrics is that you can change them add the ones you need, to focus on the problem you have, and then dispose of them again. SQL Monitor makes that very easy to do, so let’s try it out.
A custom metric for SQL Monitor is written in SQL and, as noted above, should return a single integer. Ideally, it should be based on an origin of zero, but we can’t do that because Ad-hoc queries always exist in databases. Also, the objtype column (see Listing 1) is an NVARCHAR so we’ll need to convert it, to use it as a custom monitor. Listing 4 shows our take on Percentage of Ad-Hoc Queries.
|
1 2 3 4 5 |
SELECT Convert(INT, Sum(CASE p.objtype WHEN 'Adhoc' THEN 1 ELSE 0 END) * 1.00 / Count(*) * 100 ) FROM sys.dm_exec_cached_plans AS p |
Listing 4
This gives you an indication of the percentage of ad-hoc queries being used on the server, a high percentage in a working server indicates that an application is failing to parameterize queries.
The Cache Memory Used (MB) and Execution Reuse custom metrics can be created as shown in Listings 2 and 3.
You may need more complicated metrics such as one that quantifies just the plans cached in the previous few minutes. I use these three just as an illustration of what’s possible.
Loading the metrics into SQL Monitor
Just click on Configuration in the main menu, then Custom Metrics, and follow the wizard. I’ll step through it for Percentage of Ad-Hoc Queries but the process for the other two is the same. Give the metric a name and description, simply paste in the query from Listing 4.
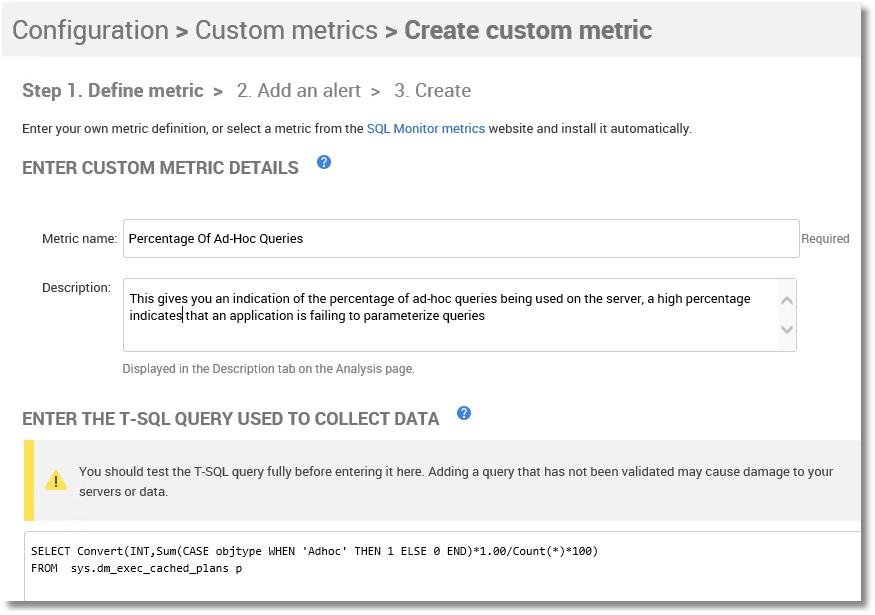
Figure 1
On the lower half of the screen, we identify the servers and database on which we wish to collect the metric, and the collection frequency.
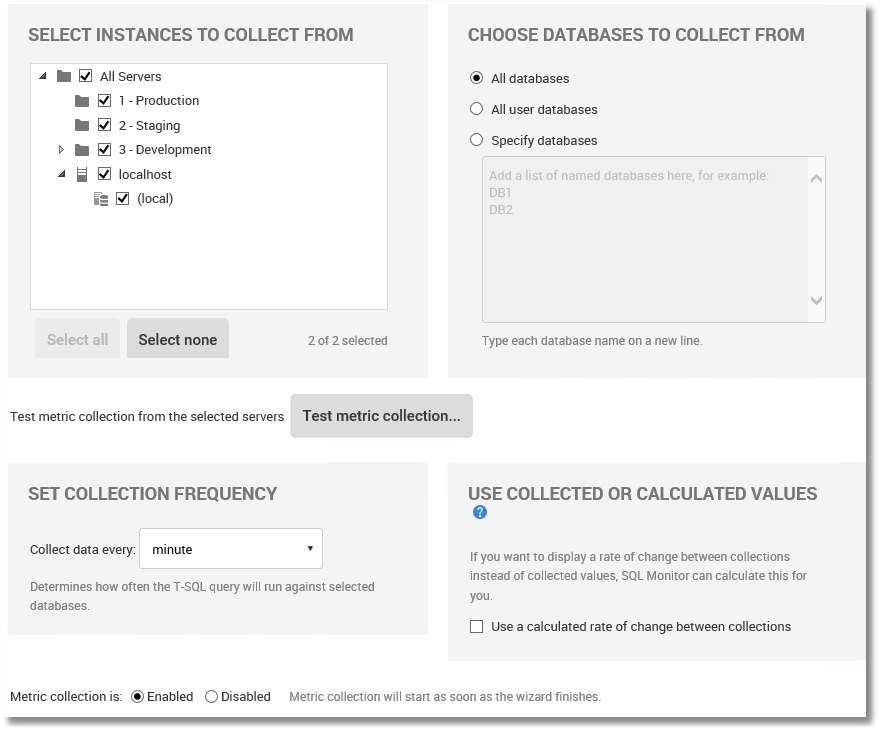
Figure 2
If all has gone well, for all three metrics, the three custom metric controls appear.
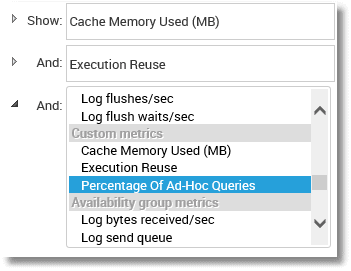
Figure 3
Testing the metrics
How can we test these out? It isn’t really that simple because it needs realistic workload traffic. Instead, I’ve created a PowerShell test harness to run queries in parallel, across separate sessions, against the AdventureWorks2016 database. I’ll show the code for the test harness later, after you’ve seen the results it produces.
The strategy I use is as follows:
- Clear out the cache
- Run some normal prepared queries against
AdventureWorks, at random intervals, using a lot of different parameter values (25 mins). - Run the same queries, but this time unparameterized (20 mins)
- Inspect the damage in SQL Monitor
With this test harness, we can very quickly decide whether a custom metric, or combinations of custom metrics, can spot the sudden use of lots of unparameterized queries. As a spoiler, the built-in metrics such as Compilations/sec can’t spot this easily, but we will see if our custom metrics do better.
First, make sure all three metrics are enabled in SQL Monitor, although we’ll check our test harness independently, as we go. We start by clearing out the cache.
|
1 2 3 |
CHECKPOINT DBCC DROPCLEANBUFFERS; DBCC FREEPROCCACHE; |
Listing 5
And we have this proportion of plan types in the cache.
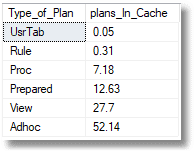
Figure 4
We then set the test harness in motion, which earnestly gathers the AdventureWorks data, running four independent processes in parallel. There is no magic in the number 4; you can scale this up if you have the necessary hardware.

Figure 5
Watching the parts lists of AdventureWorks bicycles and their purchasers scrolling past is soothingly hypnotic. Once the parameterised queries have run, after 25 mins, this is the proportion of Ad-hoc queries.
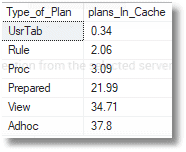
Figure 6
Twenty minutes later, the unparameterized queries have run and this is now the proportion of Ad-hoc queries.

Figure 7
It looks as if the switch from parameterised queries to unparameterized queries is having a bad effect on the cache, so let’s look at a plot of the graph for all three metrics, in SQL Monitor. The harness started to run at 16.13, and finished at 16.53.
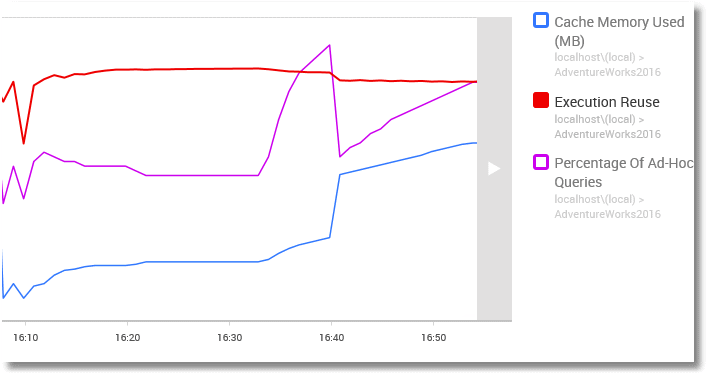
Figure 8
Cache memory used – shows an initial climb, as the prepared statements were put in cache, and then the memory requirement in cache steadied for the first part of the test, because the same queries were reused repeatedly with different parameters. After 25 minutes, the good queries were replaced by the bad ‘uns. The unparameterized ad-hoc queries rode into town and you see a huge increase in cache memory, until this is detected by SQL Server and the strategy is changed. Cache memory still increased from then on, but at a gentler rate.
Execution Reuse – After an initial jump, it declines steadily over time until it ends up at 94.3%.
Percentage of Ad-hoc Queries – seems the most sensitive metric to the sudden influx of Ad-hoc queries. It makes a spectacular leap up to 59% before dropping back, in light of SQL Server’s response to the memory pressure, which trims the plan cache to preserve space. This causes a drop in the percentage of queries, but then it rises again.
If you repeat the test without clearing the cache, you no longer see the dramatic effect because the server has successfully reacted to the high ad-hoc query count, and even the ad-hoc queries used in the test harness can reuse existing plans. After all, there were only four basic queries. All we’re doing is demonstrating the principles.
A real application will issue a vast range of queries, which happen at different times, rather than continuously. You might need a week’s monitoring to spot where the problem happens. It may be just in a weekly reconciliation or reporting routine. I once had a problem with a server that happened only at three o’clock in the morning on a Saturday. This is where an application like SQL Monitor can help.
These metrics deal directly with changes in the quantity or proportion of ad-hoc queries, but it is a good idea to look out for the more general symptoms that signal the chronic phase of cache bloat and excessive compilation. There are certain metrics that will show changes in the rate of compilations, such as the SQL Server metrics of Batch Request/sec and SQL Compilation/sec, and with rising pressure on memory, you’ll see an effect on Page Life Expectancy, Free List Stalls/sec, and Lazy Writes/sec. There are a couple of existing custom metrics as well such as Buffer Pressure or SQL Cache Memory to verify that there is memory pressure.
Finding the problem queries
At this point, you can use a query such as the one in Listing 6 to find the queries that are causing problems. By changing the search conditions and the order, you can flush out the Ad-hoc critters that could be parameterized.
There are several useful columns, such as the time the plan was created, and the time it was last used (last_execution_time). This can help to line up the prime suspects, because the graph tells us when the crime was committed. In this case, I’ve specified just the queries that involve a particular table by filtering for the word ‘product’, but you can filter out queries in many other ways.
|
1 2 3 4 5 6 7 8 9 10 11 12 13 14 15 16 17 18 19 |
SELECT TOP 100 Stuff (CASE WHEN qs.statement_end_offset=-1 THEN Text ELSE Left(Text,(qs.statement_end_offset/2)+1)END, 1,(qs.statement_start_offset/2),'') AS SQL_Expression, qs.execution_count, Convert(NUMERIC(8,2),qs.total_elapsed_time/(1000.00*qs.execution_count)) as average_execution_time_MS, Convert(NUMERIC(8,2),qs.last_elapsed_time/1000.00) AS last_elapsed_time_MS, qs.last_execution_time AS when_Last_Executed, qp.query_plan, Db_Name(qt.dbid) FROM sys.dm_exec_query_stats qs CROSS APPLY sys.dm_exec_sql_text(qs.sql_handle) qt CROSS APPLY sys.dm_exec_query_plan(qs.plan_handle) qp WHERE text like '%product%' ORDER BY qs.total_logical_reads DESC -- logical reads |
Listing 6
The PowerShell test harness
This Powershell test harness is just a sketch of the real thing; I just did enough to show how it can be used to investigate the effect RBAR process that should, at the very least, be parameterised.
The top-level PowerShell app is very simple. Normally, I’d also be doing a build and tear-down, including all the SQL code. This script merely controls the worker queries that simulate the application’s workload. It starts the prepared queries, waits as they repeatedly execute against the server, and then stops them and starts the ad-hoc versions, waits as they repeatedly execute against the server, and then stops them.
|
1 2 3 4 5 6 7 8 9 10 11 12 13 14 15 16 17 18 19 20 |
#where we store the powershell files $PathToScript='MyPowerShellPath' #execute all for parameterised queries, repeated with lots of different values for the parameters $first=Start-Process -FilePath "powershell.exe" -ArgumentList "$($PathToScript)FourthparameterizedQuery.ps1" -Verb open -PassThru $Second=Start-Process -FilePath "powershell.exe" -ArgumentList "$($PathToScript)ThirdparameterizedQuery.ps1" -Verb open -PassThru $Third=Start-Process -FilePath "powershell.exe" -ArgumentList "$($PathToScript)SecondparameterizedQuery.ps1" -Verb open -PassThru $fourth=Start-Process -FilePath "powershell.exe" -ArgumentList "$($PathToScript)parameterizedQuery.ps1" -Verb open -PassThru #Wait for twenty minutes with all the processes executing Start-Sleep -seconds 1200 #kill all the processes @($first, $second, $third, $fourth)|stop-process #execute the exact same queries,but unparameterised, repeated with lots of different values for the parameters $first=Start-Process -FilePath "powershell.exe" -ArgumentList "$($PathToScript)FourthUnparameterizedQuery.ps1" -Verb open -PassThru $Second=Start-Process -FilePath "powershell.exe" -ArgumentList "$($PathToScript)ThirdUnparameterizedQuery.ps1" -Verb open -PassThru $Third=Start-Process -FilePath "powershell.exe" -ArgumentList "$($PathToScript)SecondUnparameterizedQuery.ps1" -Verb open -PassThru $fourth=Start-Process -FilePath "powershell.exe" -ArgumentList "$($PathToScript)UnparameterizedQuery.ps1" -Verb open -PassThru #Wait for twenty minutes with all the processes executing, and filling up Cache Start-Sleep -seconds 1200 #kill all the processes @($first, $second, $third, $fourth)|stop-process |
Listing 7
You can use this PowerShell app to run any number of quires in parallel, each on a separate process.
Listing 8 shows a sample script that executes a query with a number of different parameter values, and then pauses for a random interval between one and ten seconds, before continuing. Once it has cycled through the sample parameters it starts again.
All the eight scripts are included with this article. Normally, the parameters are kept in a separate file, referenced by all the processes, but I wanted to keep this simple.
|
1 2 3 4 5 6 7 8 9 10 11 12 13 14 15 16 17 18 19 20 21 22 23 24 25 26 27 28 29 30 31 32 33 34 35 36 37 38 39 40 41 42 43 44 45 46 47 48 49 50 51 52 53 54 55 56 57 58 59 60 61 62 63 64 65 66 67 68 69 70 71 72 73 74 75 76 77 |
$SourceDatabase = 'AdventureWorks2016' #where we take the data and build script from $SourceServerName = 'MyServer' $SourceLogin = 'MyLogin' #Leave blank for Windows authentication #none of our errors are recoverable $ErrorActionPreference = "Stop" $MS = 'Microsoft.SQLServer' #create a connection object as we can reuse this for all the operations # is this Windows Authentication or UserID/Password credentials? $connection = New-Object -TypeName System.Data.SqlClient.SqlConnection $connectionString = "Server=$SourceServerName;Database=$SourceDatabase;Integrated Security=True;" if ($SourceLogin -ne '') #if no login specified, then it was a windows login { $connectionString = "Server=$SourceServerName;Database=$SourceDatabase;Integrated Security=False;" if (Test-Path -path "$env:USERPROFILE\$SourceLogin-$SourceServerName.txt" -PathType leaf) { #has already got this set for this login so fetch it $encrypted = Get-Content "$env:USERPROFILE\$SourceLogin-$SourceServerName.txt" | ConvertTo-SecureString $encrypted.MakeReadOnly() $Credentials = New-Object System.Data.SqlClient.SqlCredential($SourceLogin, $encrypted) } else { #hasn't got this set for this login $AutomationCredentials = get-credential -Credential $SourceLogin $AutomationCredentials.Password | ConvertFrom-SecureString | Set-Content "$env:USERPROFILE\$SourceLogin-$SourceServerName.txt" ($password = $AutomationCredentials.Password).MakeReadOnly() $Credentials = New-Object System.Data.SqlClient.SqlCredential(($AutomationCredentials.UserName -replace '^.*\\|@.*$'), $password) } } $connection.Credential = $Credentials $connection.ConnectionString = $connectionString $connection.Open() | out-null $handler = [System.Data.SqlClient.SqlInfoMessageEventHandler] { param ($sender, $event) $global:message = "$($message)`n $($event.Message)" }; $connection.add_InfoMessage($handler); $connection.FireInfoMessageEventOnUserErrors = $true do { @('vest', 'gloves', 'touring frame', 'Road Frame', 'jersey', 'shorts', 'helmet', 'tights', 'wheel', 'handlebars', 'pedal', 'bracket', 'seat', 'saddle', 'chain', 'fork', 'tube', 'pump', 'brakes') | foreach{ $cmd = new-Object System.Data.SqlClient.SqlCommand(@" SELECT Product.Name, Product.ProductNumber, Product.Color, Product.ListPrice FROM Production.Product WHERE Product.Name LIKE @productName AND Product.ProductModelID IN ( SELECT p1.ProductModelID FROM Production.Product AS p1 GROUP BY ProductModelID HAVING Max(p1.ListPrice) >=ALL ( SELECT Avg(p2.ListPrice) FROM Production.Product AS p2 WHERE p1.ProductModelID = p2.ProductModelID ) ); "@, $connection) $cmd.Parameters.Add("@productName", [system.data.SqlDbType]::NVarChar) | out-Null $cmd.Parameters['@productName'].Size = 30 $cmd.Parameters['@productName'].value = "%$($_)%" Start-Sleep -seconds (get-random -maximum 10 -minimum 1) $rdr = $cmd.ExecuteReader() #because we are getting a result back do { $datatable = new-object System.Data.DataTable $datatable.Load($rdr) $datatable | Format-table } while ($rdr.IsClosed -eq $false) $rdr.Close() } } While ($true -eq $true) |
Listing 8
Conclusions
I like to automate as much as possible of the many checks that are part of a daily build. I can’t show a real test run because each database and application is different, but with a baseline and the ability to browse the metrics, SQL Monitor allows you to glance over the entire test run and spot anything untoward that needs investigating. Custom metrics even allow you to put in application-specific metrics such as the ratio between users entering the shopping cart and those reaching the end (bugs in the shopping cart can be eye-watering, and a pig to test).
It is always nice to be able to see the summary of the results of testing in a single interface, and it is an interesting challenge to communicate as much as possible with changes in the value of an integer!
Tools in this post
Redgate Monitor
Real-time multi-platform performance monitoring, with alerts and diagnostics
You may also like
-

Webinar
Customer perspectives: Why Redgate Monitor is Unmatched
Hear directly from Chris Yates of Republic Bank on why they switched to Redgate Monitor, and what made it the clear choice over the competition. In this insightful discussion, our panelists shared: What prompted them to leave their previous monitoring solutions. The deciding factors that made Redgate Monitor their top choice. Tips on what
-

Article
Monitoring Azure SQL Database with SQL Monitor
Grant Fritchey explains the Azure-tailored metrics and alerts that you need to diagnose performance problems with your Azure SQL Databases, and let you know which resource (CPU, data IO or log IO) is the bottleneck.
-

Webinar
Der ultmative Ratgeber zur Wahl des richtigen Datenbank-Monitoring-Tools
Die Wahl des richtigen Überwachungstools für Ihr Unternehmen geht über den Funktionsvergleich und oft sogar den Preis hinaus. Während Sie wahrscheinlich ein Budget haben, an das Sie sich halten müssen, gibt es neben den Kosten auch andere Faktoren, die Sie berücksichtigen sollten, wenn Sie das richtige Tool für Ihr Unternehmen auswählen. In diesem Webinar werden
-
Article
SQL Monitor Quick Tip: Using the SQL static code analysis performance rules
This quick tip illustrates SQL Monitor's built-in set of Performance Rules for static code analysis. These rules are designed to highlight SQL syntax that could potential cause performance problems, and so indicate ways to improve the overall quality and performance of the workload, over time.
-

Business leaders webinar
Artisan Partners on database technology trends
Join Matt Schmelzer, Data Systems and Automation - IT, and Jonathan Holck, IT Associate, from Artisan Partners in discussion with Microsoft MVP Grant Fritchey to learn how they implemented a successful infrastructure and what tools they need to support their growing estate.