Tagging SQL Server Changes in Redgate Monitor
How to use RAISERROR() in T-SQL to send annotations to Redgate Monitor, so you can observe the direct impact of application tasks, or server changes, on the SQL Server metrics.
The idea behind this article is that a developer, or an application, can include a custom RAISERROR statement in any batch that performs a task, such as a data load or an indexing change, which could have a significant impact SQL Server performance. Likewise, an admin can do the same when performing a server task, such as changing a configuration setting.
We have an Agent job that fires on seeing the custom error message number, and then runs a job step that uses the new Redgate Monitor PowerShell module to connect to Redgate Monitor and annotate the Overview graph for the instance where the alert fired, with details of the event that occurred.
What are annotations?
Using the new PowerShell API, we can send ‘messages’ from a SQL Server instance to Redgate Monitor, notifying it of when certain server or application events occur. For example, we can notify Redgate Monitor that a configuration setting was changed during maintenance, or the server was patched, or a deployment occurred, a certain application task was performed, an application error occurred, an ETL operation ran, and so on.
Redgate Monitor will mark each of these ‘events’, by adding an annotation on the X-axis (timeline) of the interactive graph that you see at the top of the ‘Overview’ tab of Redgate Monitor, for each SQL Server instance.
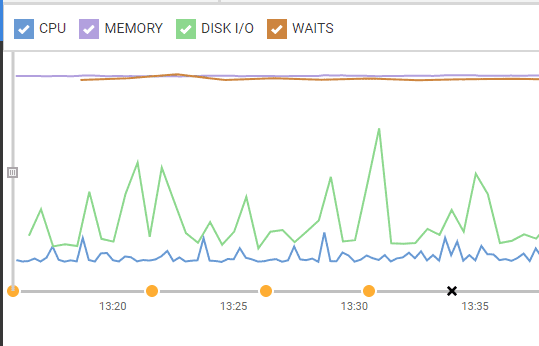
This is the graph that is aimed at giving you a summary of what is going on with the SQL Server. The amber dots along the timeline are medium-severity alerts from Redgate Monitor (in this case, they are warning of a failing job), whereas the black cross is an ‘error’ annotation that I’ve written to the timeline from a SQL Server batch, using code I’ll explain later.
You can send an annotation from any of your servers to the Redgate Monitor web server, and you can vary the form of the annotation, the icon on the timeline in particular, in order to represent different categories of task: a Deployment, an Error, a change in Permissions or Configuration, or a SQL Update.
This means that you can now tie in any significant server events or application events to those squiggles on the graph that represent the CPU, Memory and IO usage profiles for a server, as well as to any significant causes of waits, and any Redgate Monitor alerts. It is obvious that many different events on the server or application can explain a sudden change in CPU or memory on the server, and so having all the evidence on the same graph means it’s much easier to make sense of these changes.
To send these events to Redgate Monitor, you need a vector that is easy for the database developer as well as the application developer. The most obvious route is the classic event logging system of SQL Server.
The message system
It isn’t immediately obvious that RAISERROR can, when used with custom errors and low severity error levels, be used as an alternative to PRINT to send logging messages. One advantage over PRINT for the programmer is that it supports character substitution, just like the venerable printf function in the C standard library. This makes it easy to send values as well as text.
Having adjusted to the shock of using RAISERROR, we create our own user-defined error message number and message text like this:
|
1 |
RAISERROR( 50124, 1, 1, N'By the nine gods he swore') WITH LOG; |
In this example, we have a custom message number of 50124, a severity of 1, error state of 1 and then the custom message. RAISERROR uses severity levels of 0 to 18 for informational messages. Finally, we specify that the message should be sent to the error log. We will have used the sp_addmessage system stored procedure to add to sys.messages the error message number, state and message.
We’ll steal the severity numbers (0-5) to represent the different types of annotation. We can create a SQL Agent alert that fires on detecting this user error message number. Once we can do this, then we can associate a job with the alert. Flushed with success, we can then add a step to this job that passes the annotation to Redgate Monitor via PowerShell.
A lot of this is merely the adaptation of the old system of sending warning emails to the DBA from a process. It’s all very familiar technology.
Installing the RedgateSQM module on each Windows Server
We will need to install the Redgate Monitor PowerShell module (RedgateSQM) on every Windows Server, hosting one or more SQL Servers, that is participating with annotations.
To install the module, open Redgate Monitor. This will immediately give you the serverURL for the Redgate Monitor web server, which you’ll need in a moment. Now go to the Configuration tab in Redgate Monitor and click on the link provided, to download the zipped module files that you need to install.
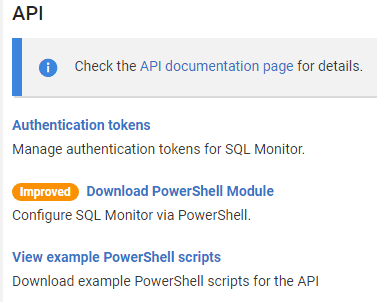
Start PowerShell in Administrator mode on the Windows Server hosting the SQL Server instance you are configuring.
So that all users, including the one that SQL Agent uses, will have access to the PowerShell module, it is important to find out the second path in the list of paths where you install PowerShell modules. This is likely to be ‘C:\Program Files\WindowsPowerShell\Modules‘. These paths are in the variable:
$Env:PSModulePath
In this shared directory for PowerShell modules, create a subdirectory called RedgateSQM and copy into it the unzipped module files.
In a new PowerShell window, not in administrator mode, make sure that you can import the module without error.
Import-module RedgateSQM
Preparing SQL Agent
First, make sure that the SQL Agent is running. Then, with the help of SQL Server Configuration Manager, check that the account that it runs under has permission to run PowerShell on the server, as well as having the necessary SQL Server permissions. The installation defaults will be OK, but the server may have had its security tightened.
Enable tokens
Then, right-click SQL Server Agent in SSMS Object Explorer, select Properties, and on the Alert System page, select ‘Replace tokens for all job responses to alerts’ to enable tokens. By using SQL Server Agent Tokens, when you write your job steps, you can get details about the message that fired the alert, including the message content, server, and database.
We need to pass these details to Redgate Monitor to include in the text of the annotation, as well telling it the name of the server and database that were the source of the alert. The actual static text in the user message we create is merely a Printf placeholder for a string. The actual content is inserted a runtime by RAISERROR.

Create the job and alert
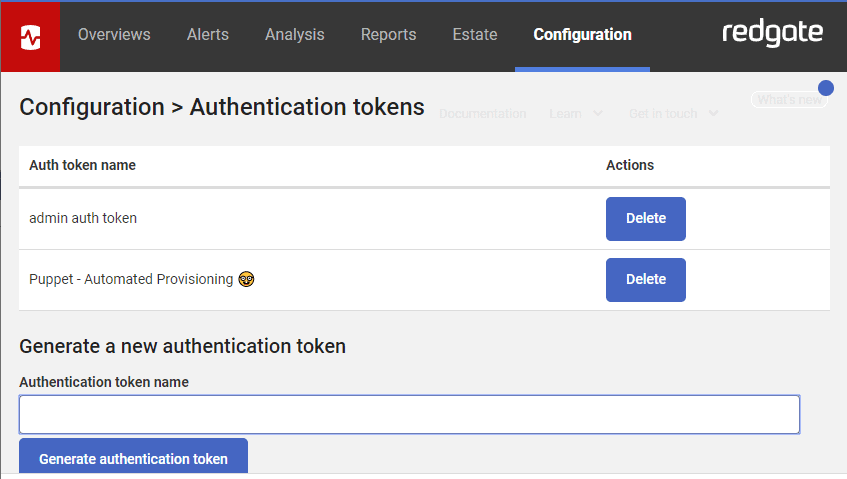
You now need to execute this following code to install the various components. If this is a re-install, then delete the existing job and alert first. Before you run this, you’ll need to set the @ServerURL variable to specify your Redgate Monitor Server, and you’ll need to set your AuthToken to one that is issued to you from within Redgate Monitor.
You’ll see that the @powerShellScript variable contains the command that runs in our job step, in response to the alert. It is PowerShell code that imports the RegateSQM module and connects to Redgate Monitor to add the annotation to the overview graph for the SQL Server instance where the alert was fired.
|
1 2 3 4 5 6 7 8 9 10 11 12 13 14 15 16 17 18 19 20 21 22 23 24 25 26 27 28 29 30 31 32 33 34 35 36 37 38 39 40 41 42 43 44 45 46 47 48 49 50 51 52 53 54 55 56 57 58 59 60 61 62 63 64 65 66 67 68 69 70 71 72 73 74 75 76 77 78 79 80 81 82 83 84 85 86 87 88 89 90 91 92 93 94 95 96 97 98 99 100 101 102 103 104 105 106 107 108 109 110 111 112 113 114 115 116 117 118 119 120 121 |
/* SSQL Server agent must be running before you execute this code. @ServerURL and @Authtoken must be filled in */ USE msdb; GO DECLARE @CustomErrorNumber INT, @ServerURL NVARCHAR(1000), @AuthToken NVARCHAR(400); SELECT @CustomErrorNumber = 50124, --change this if you already use this number @ServerURL = N'http://OurSQLMonitor:OurPort', --the address you use for Redgate Monitor @AuthToken = N'c21OWIxrDU4bNCh1ljkTc1LTQxMmI4tYjliNS0yNhGQ4ODgyOkxOW=UM'; --The AuthToken you get from Redgate Monitor to allow you access DECLARE @powerShellScript NVARCHAR(MAX); SELECT @powerShellScript = N'$Data = @{ ''Server'' = ''$(ESCAPE_SQUOTE(A-SVR))''; ''Database'' = ''$(ESCAPE_SQUOTE(A-DBN))''; ''Message'' = ''$(ESCAPE_SQUOTE(A-MSG))''; ''Severity'' = [int]''$(ESCAPE_SQUOTE(A-SEV))'' } $monitorConnection=@{ ServerURL=''' + @ServerURL + N'''; AuthToken=''' + @AuthToken + N''' } Import-module RedgateSQM #Import the module. This is best installed with the powerShell system modules $ErrorActionPreference = "Stop" $regex = [regex] ''(?is)Error: \d{1,6} Severity: \d{1,3} State: \d{1,3} '' # to remove the superfluous error stuff $annotation = $regex.Replace($Data.Message, '''') #clean the annotation if ($Data.Severity -gt 5 -or $Data.Severity -lt 0 ) {$Data.Severity=0}; #remove silly stuff #from the Redgate documentation $SQMTypes=@(''Unspecified'',''Deployment'',''Error'',''Permissions Change'',''Configuration Change'',''SQL Update'') $AnnotationType=$SQMTypes[$Data.Severity] # now connect to Redgate Monitor Connect-SqlMonitor -ServerUrl $monitorConnection.ServerURL ` -AuthToken $monitorConnection.AuthToken #get the instance object (or SQL Server object) $instance = Get-SqlMonitorMachine | where Name -eq $Data.server.Trim() | Get-SqlMonitorInstance #if we succeeded if ($instance -ne $null) { if ($Data.Severity -eq 0){ Add-SqlMonitorAnnotation -Target $instance ` -DatabaseName $Data.Database ` -Description $annotation ` -UtcDate(Get-Date -Format o)} else { Add-SqlMonitorAnnotation -Target $instance ` -DatabaseName $Data.Database ` -Description $annotation ` -Source $AnnotationType ` -UtcDate(Get-Date -Format o)} } '; BEGIN TRANSACTION; DECLARE @ReturnCode INT; SELECT @ReturnCode = 0; IF NOT EXISTS (SELECT * FROM msdb.sys.messages WHERE message_id = @CustomErrorNumber) BEGIN EXEC @ReturnCode = sp_addmessage @msgnum = @CustomErrorNumber, --our value for the custom error @severity = 1, --you can vary this @msgtext = N'%s', --so we can insert a different message every time @with_log = 'TRUE'; --so it is logged IF (@@Error <> 0 OR @ReturnCode <> 0) GOTO QuitWithRollback; END; IF NOT EXISTS ( SELECT name FROM msdb.dbo.syscategories WHERE name = N'[Uncategorized (Local)]' AND category_class = 1 ) BEGIN EXEC @ReturnCode = msdb.dbo.sp_add_category @class = N'JOB', @type = N'LOCAL', @name = N'[Uncategorized (Local)]'; IF (@@Error <> 0 OR @ReturnCode <> 0) GOTO QuitWithRollback; END; DECLARE @jobId BINARY(16); IF NOT EXISTS (SELECT name FROM msdb.dbo.sysjobs WHERE name LIKE N'Redgate Monitor Annotation') BEGIN EXEC @ReturnCode = msdb.dbo.sp_add_job @job_name = N'Redgate Monitor Annotation', @enabled = 1, @notify_level_eventlog = 0, @notify_level_email = 0, @notify_level_netsend = 0, @notify_level_page = 0, @delete_level = 0, @description = N'Execute some PowerShell that sends a message to Redgate Monitor', @category_name = N'[Uncategorized (Local)]', @owner_login_name = N'sa', @job_id = @jobId OUTPUT; END; ELSE SELECT @jobId = job_id FROM msdb.dbo.sysjobs WHERE name LIKE N'Redgate Monitor Annotation'; IF (@@Error <> 0 OR @ReturnCode <> 0) GOTO QuitWithRollback; /* Step [SendAMessageToSQM] */ IF NOT EXISTS (SELECT * FROM msdb.dbo.sysjobsteps WHERE step_name LIKE N'SendAMessageToSQM') BEGIN EXEC @ReturnCode = msdb.dbo.sp_add_jobstep @job_id = @jobId, @step_name = N'SendAMessageToSQM', @step_id = 1, @cmdexec_success_code = 0, @on_success_action = 1, @on_success_step_id = 0, @on_fail_action = 2, @on_fail_step_id = 0, @retry_attempts = 0, @retry_interval = 0, @os_run_priority = 0, @subsystem = N'PowerShell', @command = @powerShellScript, @database_name = N'master', @flags = 0; IF (@@Error <> 0 OR @ReturnCode <> 0) GOTO QuitWithRollback; EXEC @ReturnCode = msdb.dbo.sp_update_job @job_id = @jobId, @start_step_id = 1; IF (@@Error <> 0 OR @ReturnCode <> 0) GOTO QuitWithRollback; EXEC @ReturnCode = msdb.dbo.sp_add_jobserver @job_id = @jobId, @server_name = N'(local)'; IF (@@Error <> 0 OR @ReturnCode <> 0) GOTO QuitWithRollback; END; /* create an Alert [Send an Annotation to Redgate Monitor] */ IF NOT EXISTS ( SELECT name FROM msdb.dbo.sysalerts WHERE name LIKE N'Send an Annotation to Redgate Monitor' ) BEGIN EXEC @ReturnCode = msdb.dbo.sp_add_alert @name = N'Send an Annotation to Redgate Monitor', @message_id = @CustomErrorNumber, @severity = 0, @enabled = 1, @delay_between_responses = 100, @include_event_description_in = 0, @category_name = N'[Uncategorized]', @job_id = @jobId; IF (@@Error <> 0 OR @ReturnCode <> 0) GOTO QuitWithRollback; END; COMMIT TRANSACTION; GOTO EndSave; QuitWithRollback: IF (@@TranCount > 0) ROLLBACK TRANSACTION; EndSave: GO |
This should have done the trick and in the browser pane of SSMS, you should see the new Redgate Monitor Annotation job:
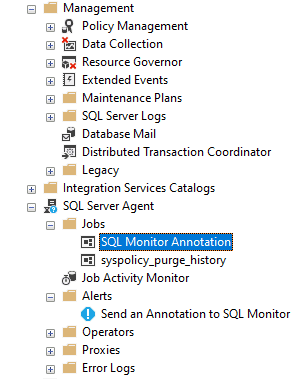
You should also see the step in the job:
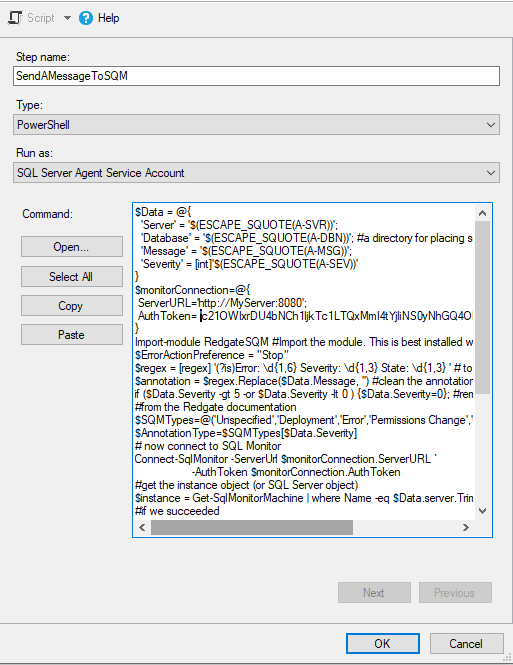
As noted earlier, this script only creates the various components if they don’t already exist. You must delete them first if this is a re-install. Unfortunately, the system procedures work outside the transaction, so you’ll need to do a tidy-up if anything goes wrong.
Sending some test annotations
We can test this out with some spoof messages.
|
1 2 3 4 5 6 7 8 9 10 11 12 13 14 15 16 17 18 19 20 21 22 23 24 25 26 27 28 29 |
/* when we send an annotation, we use the severity code so that .... Information=0 Deployment=1 Error=2 Permissions Change=3 Configuration Change=4 SQL Update=5 */ RAISERROR (50124, -- Message id. 0, -- Severity used to specify the 'source' or annotation (0=information) 1, -- State, N'Lars Porsenna of Clusium' ) WITH LOG; WAITFOR DELAY '00:01:50';--Deployment <a id="post-1305312-_Hlk33783418"></a>RAISERROR( 50124, 1, 1, N'By the nine gods he swore') WITH LOG; WAITFOR DELAY '00:01:50';--Error RAISERROR( 50124, 2, 1, N'That the great house of Tarquin') WITH LOG; WAITFOR DELAY '00:01:50'; --Permissions Change RAISERROR( 50124, 3, 1, N'Would suffer wrong no more') WITH LOG; WAITFOR DELAY '00:01:50'; --Configuration Change RAISERROR( 50124, 4, 1, N'By the nine gods he swore it') WITH LOG; WAITFOR DELAY '00:01:50';--SQL Update RAISERROR( 50124, 1, 1, N'and swore a trysting oath') WITH LOG; WAITFOR DELAY '00:01:50';--Information RAISERROR( 50124, 0, 1, N'And bade his messages ride forth,') WITH LOG; WAITFOR DELAY '00:01:50'; RAISERROR( 50124, 1, 1, N'East and west and south and north') WITH LOG; |
Once this has been run, you can check to see if it all worked well. As you can imagine, it didn’t work first time! The message should have gone down this route:
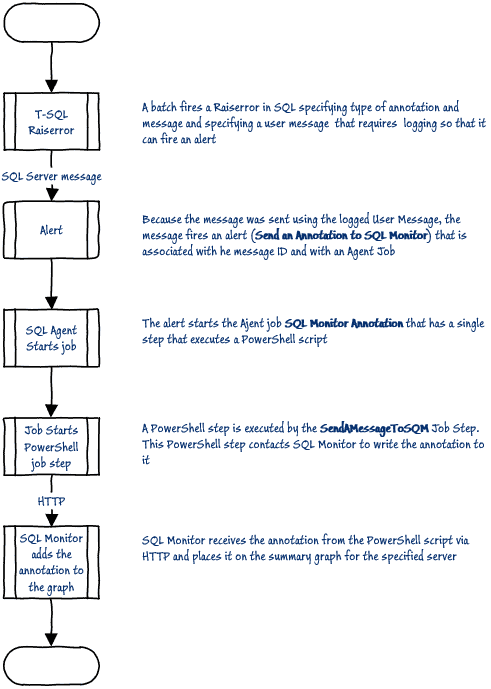
You need to check the job first. Does it have the alert and the step associated with it? Has the alert fired properly? Has the step been run and if so, was it successful?
It is the PowerShell job step that is likely to need the most attention. To check for errors, the first stage is to check the error log or use the SQL I provide in a moment. The error log will give you a good indication of a problem in the PowerShell. For troubleshooting a job step, I generally log directly to an external file but that is just a personal preference. In the advanced properties for the job step you can pass the output of the PowerShell script to an output file, as I did, or to a table. I’ve removed any external logging from the final code. but it could be important if you are failing to get a valid instance object from Get-SqlMonitorMachine and Get-SqlMonitorInstance.
Here is the code I use to check how it went:
|
1 2 3 4 5 6 7 8 9 10 11 12 |
SELECT name, step_name, CASE run_status WHEN 1 THEN 'Fine' ELSE 'Failed' END AS success, message, -- SQL Prompt formatting off Stuff(Stuff(run_date,7,0,'/'),5,0,'/')+' ' + Stuff(Stuff(right('00000000'+Convert(VARCHAR(6),run_time),6),5,0,':'),3,0,':') lastRun, run_duration -- SQL Prompt formatting on FROM msdb.dbo.sysjobs AS j INNER JOIN msdb.dbo.sysjobhistory AS h ON j.job_id = h.job_id WHERE j.enabled = 1 --Only Enabled Jobs AND name LIKE N'Redgate Monitor Annotation'; |
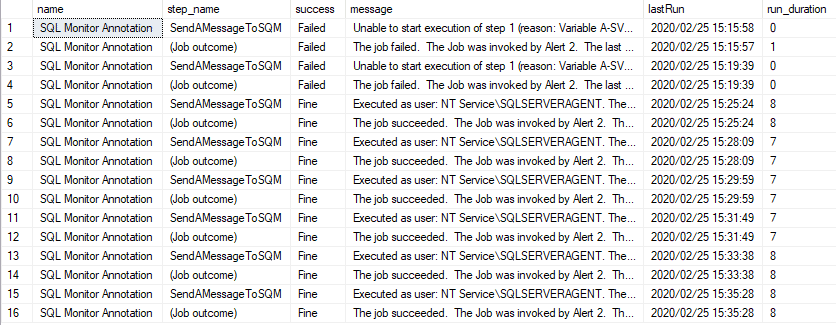
In Redgate Monitor, you should see something like this on your overview graph:
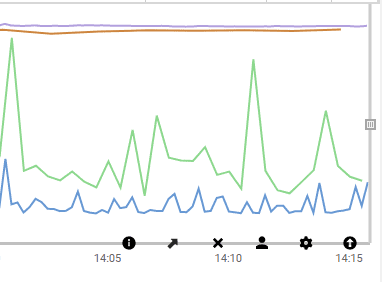
…and if you mouse-over one of the black icons you get a message…
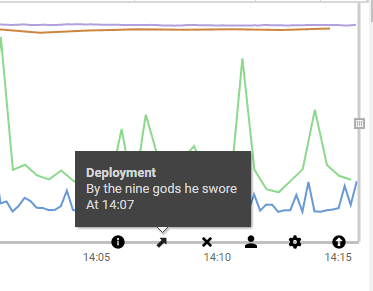
Having tested it out for each SQL Server that we are monitoring, this messaging and annotation system to ready to go. Obviously, this is only suitable for the important events that need to be considered by anyone monitoring an estate of SQL Servers, meaning those likely to have a significant impact on the metrics in the main graph. It would be easy to overwhelm this graph by scattering so many annotations that they are likely to be ignored.
An annotation and reporting system that we can write to from within a batch, by means of a RAISERROR function must be about the easiest way in SQL Code, and the application can use the same device. If this doesn’t seem to be enough, then it is possible that you need a unified messaging system at the application level.
Now that you’ve seen the code, this should provide you very little difficulty. PowerShell to Slack is well-documented, so it is perfectly possible to send annotations to Redgate Monitor from a slack channel rather than a RAISERROR. This is just one of several possible message vectors that you can use a to send to Redgate Monitor to provide feedback about what an application is doing in detail as an annotation.
Conclusions
In the heat of the moment, especially if you only have charge of a few servers, it is possible to know that a particularly resource-intensive ETL job is underway, or index rebuilds on a heavily used OLTP table, whether a server is offline for routine servicing, a deployment is underway, or a database is being moved. You may also be aware that a database application is running an end-of-month reconciliation or that the ticket-sales application is being besieged by hopeful punters.
On the other hand, as the number of servers increases, and things get busier, then you may not. When you experience that heart-stopping moment when the up-and-down heartbeat of a database suddenly vanishes, you’d be a very cold fish if you don’t care whether you know about an event that would explain it. A Busy Ops Person will be grateful for information that can help to understand and diagnose server events when anything anomalous appears on a graph.
Tools in this post
Redgate Monitor
Real-time multi-platform performance monitoring, with alerts and diagnostics

