


Query Executions in Redgate Monitor
Intermittent database problems are much easier to resolve when DBAs can pinpoint exactly when they occur and under what conditions. With Query Executions, Redgate Monitor captures execution details for individual queries, helping DBAs identify the precise circumstances that cause resource contention and performance problems.
What are Query Executions?
The new query executions feature in Redgate Monitor provides granular performance data for individual query executions. It collects this data using SQL Server Extended Events, a built-in event-tracing system that can capture in-depth performance metrics for individual query executions, without significant overhead.
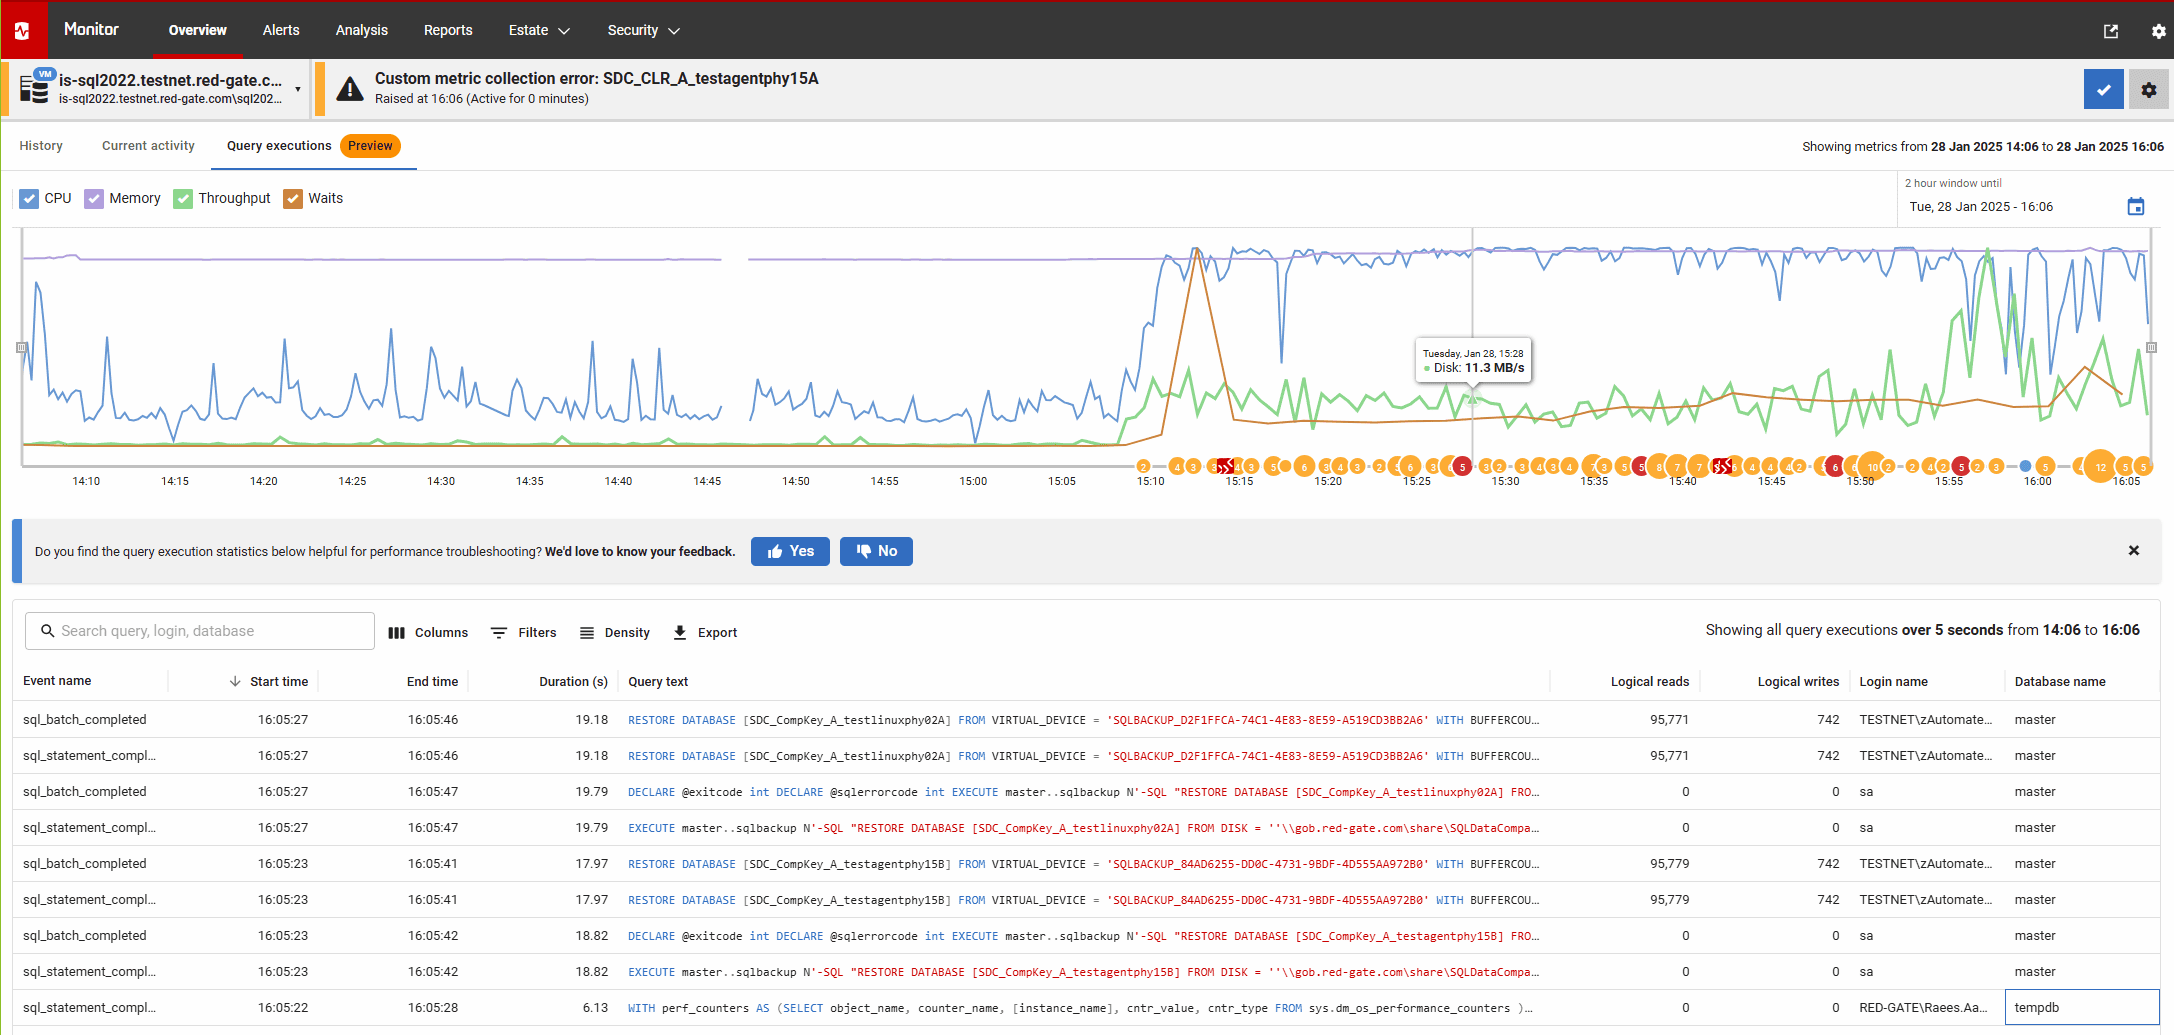
With Query Executions enabled, Redgate Monitor captures the extended event data for any query executions over five seconds in duration. It provides users with detailed metrics including the query text, query start and end times, and logical reads and writes. You can view this data on the “Query executions” tab of the Server Overview page and use the interactive activity graph to correlate individual query executions with spikes in CPU or memory:
Why are Query Executions needed?
Redgate Monitor comes with a host of query tuning and tracking capabilities that help DBAs and developers to identify long running and costly queries, get recommendations and guidance on how to optimize them.
For example, the Top queries table on each Server overview page provides details of any expensive queries that ran over the period you're investigating. It provides aggregated execution statistics across all executions of semantically identical queries that occurred within the selected time. Over time, this helps DBAs identify and tune queries that are generally 'high cost'. DBAs can even choose to track significant queries so they can always review execution data for them and track their performance over time.
However, the most difficult performance problems to diagnose are intermittent and only occur under a particular set of conditions. For example, imagine that a query runs 50 times and the average duration reported by Top Queries is 72 seconds. This might mask the fact that on 49/50 of those executions, the query completed in 60 seconds, but on one occasion, coinciding with CPU saturation, the query took 660 seconds to complete.
The Query Executions feature fills this gap by allowing DBAs to correlate spikes in resource usage, or occurrences of blocking, with execution details for the individual queries that ran around at the time these occurred. These details are displayed in the individual query executions table. For rpc_completed events, the query text will reveal the exact parameters used to execute the query, which can be very helpful in cases where the performance of a query changes dramatically with different parameter values. Please note that query parameter values are available only for rpc_completed events and not for sp_statement_completed, sql_statement_completed or sql_batch_completed events.
Enabling Query Executions
On each SQL Server instance where Query Executions are enabled, Redgate Monitor will need to set up the Extended Event sessions to collect the required data to track individual query executions. As a result, the Redgate Monitor team decided to make individual query executions opt-in so that users maintain full control over the servers and instances for which this XE data is collected.
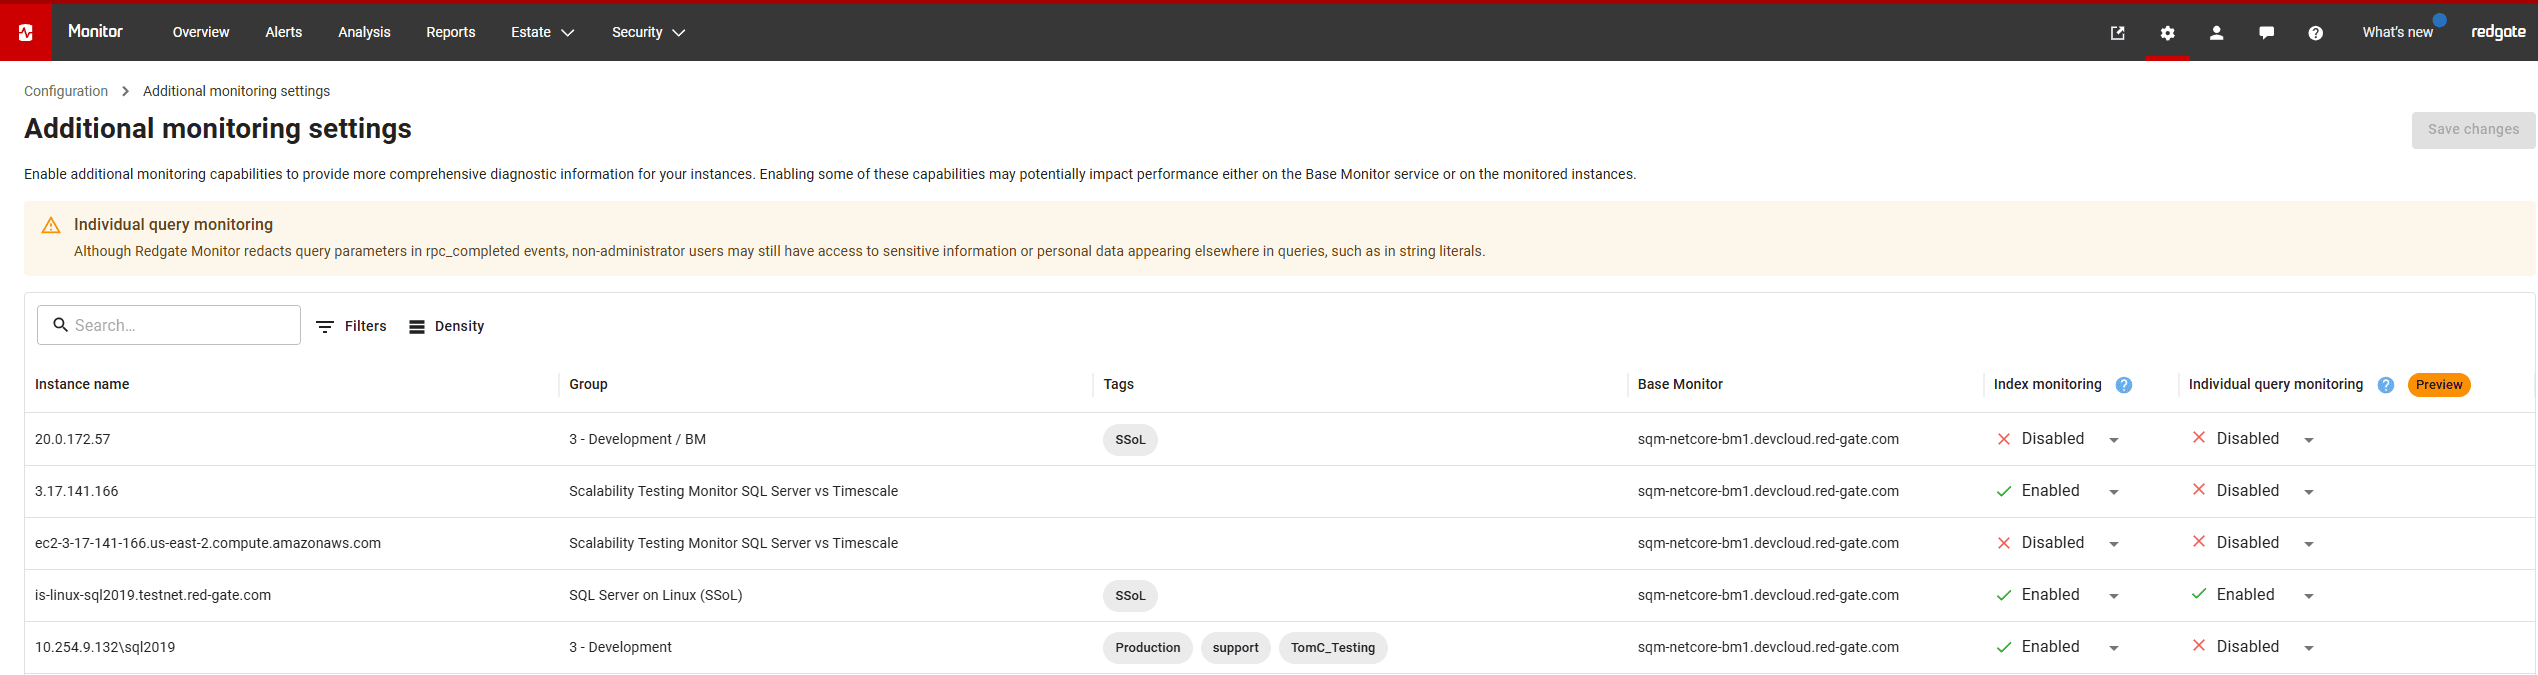
To collect Query Executions data on an instance, go into additional monitoring settings and select the server(s) for which the feature should be enabled.
Conclusions
DBAs often struggle to unravel the exact circumstances or chain of events that lead to performance problems. With the new query executions feature, Redgate Monitor provides more granular performance data for individual query executions, allowing individual queries to be directly correlated with performance spikes.
This deeper visibility helps teams diagnose not just which high-cost queries were running over the selected period, but which instances of a query caused slowdowns at specific times.
Tools in this post
Redgate Monitor
Real-time multi-platform performance monitoring, with alerts and diagnostics
You may also like

Webinar
What's New in Database Monitoring: A Redgate Sneak Peak
Get a sneak peek into Redgate Monitor's roadmap, showcasing features like extended multi-platform support, optimizing cloud costs, and database security monitoring and auditing capabilities.

Article
Introduction to Analyzing Waits using Redgate Monitor
Phil Factor sets out with the modest aim of giving you enough of an introduction to waits to better understand the wait information you get from a SQL Server monitoring tool like Redgate Monitor, and the rather overwhelming amount of information available in the underlying DMVs and Extended Events.
Article
Troubleshooting SQL Server Queries using Actual Execution Plans
For SQL Server 2019 onwards, Redgate Monitor can now show the actual execution plan, complete with runtime statistics, for expensive queries that were running over any period of investigation. This means you'll not only know how SQL Server executed your poorly performing query but also see accurate runtime data. Any big discrepancies between estimated and actual row counts will be revealed, and Redgate Monitor will highlight any warnings and offer recommendations.

Article
A Fresh Look at the NHS Autumn Budget: Opportunities for IT Teams
Over £2 billion has been earmarked for the IT modernisation of the NHS. Let's explore some of what this means for IT teams and how Redgate can help.

Article
Unearthing Bad Deployments with Redgate Monitor and Redgate's Database DevOps Tools
Sudden performance issues in SQL Server can have many causes, ranging all the way from malfunctioning hardware, through to simple misconfiguration, or perhaps just end users doing things they shouldn't. But one particularly common culprit is when deployments go wrong: I don't know a single DBA who hasn't been burned by a bad release.

Live training session
Redgate Monitor: Ask the Experts
Join our live customer exclusive online event - 'Ask the Experts'. In this live event, Solution Engineer, Huxley Kendell will be available to answer questions and provide friendly advice on Redgate Monitor.
Loading comments...