


Dynamic Alerting on Processor (CPU) utilization
Why it matters: Redgate Monitor's dynamic alerting uses machine learning to automatically adjust alert thresholds, eliminating alerts that are predictable based on historical trends. This increases alert relevance, keeping DBAs focused on genuine anomalies and real issues, allowing continuous improvement to system stability and performance. By eliminating the need for manual baseline analysis and threshold tuning, dynamic alerts also save DBAs significant time and effort.
What is dynamic alerting?
Dynamic alerts dynamically adjust the conditions under which they are raised based on historical data analysis, ensuring alerts are only triggered when behavior deviates significantly from its usual patterns. For example, suppose a business report runs every four hours on a server, and historical data shows that it consistently causes CPU usage to spike to nearly 100% for 60 minutes each time, as shown in the following CPU utilization forecast:
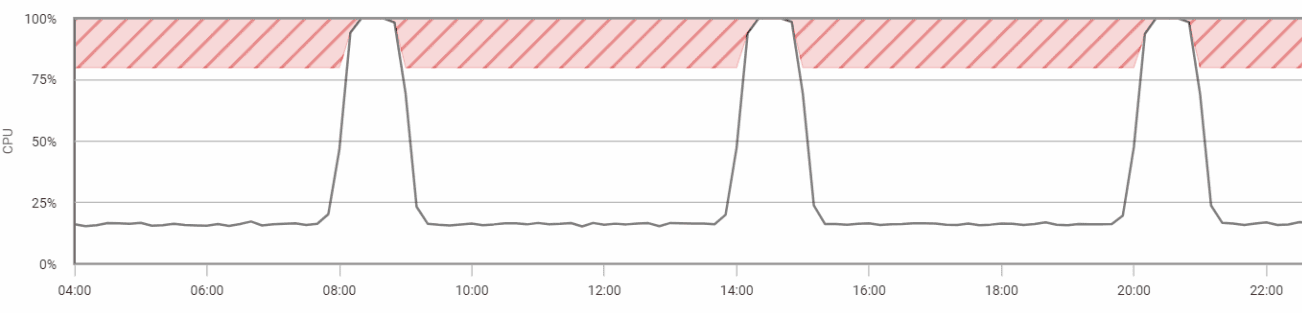
A static alert threshold, such as "alert if CPU exceeds 80% for over 600 seconds", would trigger an alert every time the report runs—even though this behavior is normal.
With dynamic alert thresholds, Redgate Monitor applies machine learning to analyze historical patterns and trends and forecast expected behavior. It automatically adjusts alert thresholds over the periods where CPU routinely exceeds the defined threshold, and will only alert on significant deviation from forecast. In this case, an alert would only be raised if CPU usage deviates unexpectedly, such as prolonged saturation or unusual activity outside regular times. All ML analysis runs locally on the Base Monitor machine, with no external data transmission, ensuring data privacy.
By adapting alert thresholds over time to account for variations in server workload, user activity, and application demand, dynamic alerting helps prevent unnecessary alerts—allowing teams to focus on the most relevant and critical issues.
Expanding dynamic alerting support
Redgate Monitor currently uses static thresholds to trigger alerts, by default. Dynamic alerting was launched in preview in Dec 2024 and currently supports Processor (CPU) utilization alerts for all database platforms. Future releases will expand coverage to other metrics.
Why is dynamic alerting important?
A specialized database monitoring system like Redgate Monitor must track many dynamic events—long-running queries, CPU pressure, IO bottlenecks, blocking, and many more. In large estates with busy servers, excessive "event noise" can lead to alert flooding, making it difficult for responders to prioritize critical issues. This can result in alert fatigue, where even important alerts risk being overlooked or ignored.
Dynamic alerting is an important new addition to the ways that Redgate Monitor allows teams to control and customize their alerting strategy and address the issue of alert flooding. It prevents predictable alerts from overwhelming the critical alerts that require immediate action to protect database stability, security, or performance.
Dynamic alerts are especially valuable in larger database environments where workload patterns fluctuate based on time of day, week, month, season, or all four! In such cases, predictability is only possible through continuous data analysis and tuning —something traditional static thresholds can't accommodate without considerable effort.
Controlled alerting in Redgate Monitor
Dynamic alerts complement Redgate Monitor’s existing alerting features, helping teams refine their database alerting strategy. These features include alert filtering by time or type, alert grouping (e.g., by alert type), alert suppression rules to mute alerts during maintenance windows, and the ability to customize your alerting strategy by server type, or for groups of servers.
Key benefits of dynamic alerting
Redgate Monitors new ML-driven dynamic alerting leads to a smarter, data-driven approach to performance monitoring that improves system reliability and performance over time. It will:
- Reduce Manual Effort and Improve Operational Efficiency
Manually tuning the thresholds of each alert is labor-intensive. Whilst this may be manageable with large teams or small estates, for many the time needed to determine and configure the correct threshold is unrealistic, time-consuming, and prone to errors. Dynamic alerting automates this process, allowing database administrators (DBAs) to focus on higher-value tasks. - Increase alert relevance
Fixed thresholds, if set low, often generate excessive amounts of noisy alerts during predictable high-utilization periods. Inversely, if the thresholds are set too high, it will fail to capture critical alerts. Dynamic alerting ensures alerts are meaningful, reducing unnecessary disruptions while improving issue detection. - Accommodate Variable Workloads
CPU usage patterns can vary significantly based on time of day, seasonal demand, or specific events. Dynamic alerting adapts to these changes, ensuring that alerts are triggered only when behavior deviates from expected norms. - Enhance Proactive Monitoring
Dynamic alerting identifies deviations from baseline trends, enabling early detection of potential issues before they escalate into critical incidents. - Improve System Reliability and Performance
By providing timely and accurate alerts, dynamic alerting helps maintain optimal performance and ensures systems remain available to meet business needs.
Dynamic alerting for CPU utilization
Monitoring CPU utilization is a critical aspect of maintaining database server performance and ensuring system reliability. Let's look at how it works in Redgate Monitor.
Enabling dynamic CPU alerts
To enable dynamic alerts for CPU utilization (requires Redgate Monitor version 14.0.37 or later), an administrator must first set the MachineLearningForecasting feature flag to true and restart the Base Monitor. Then in Alert Settings, simply select Processor (CPU) Utilization, choose the target machine or group, and turn on Use dynamic alert thresholds. For step-by-step instructions, see the documentation.

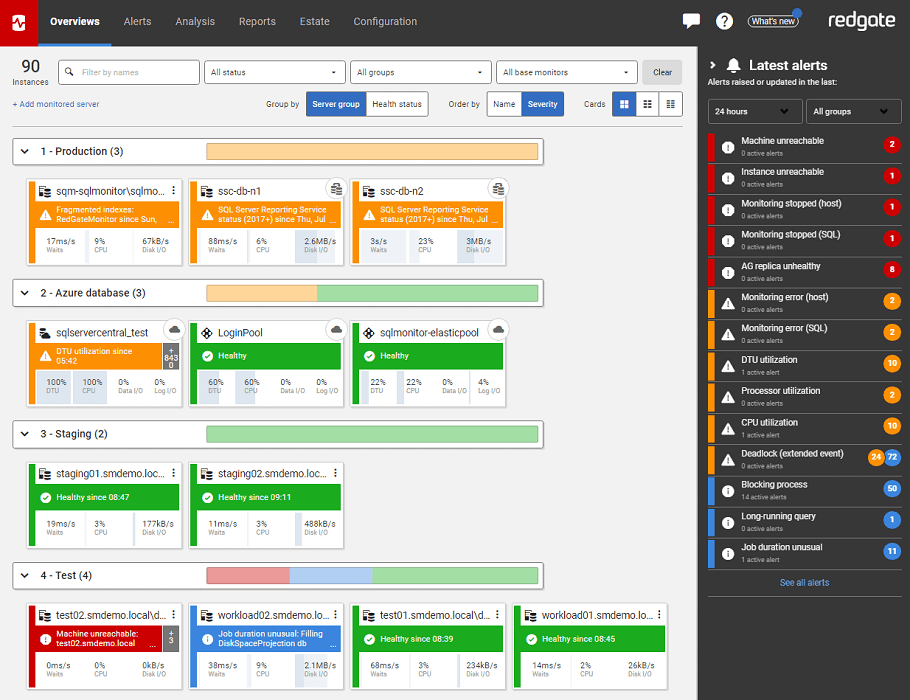
Reviewing dynamics CPU alerts in the dashboard
When an alert is triggered using dynamic thresholds, it will be marked with a 'Dynamic alert' label in the Alert Inbox.
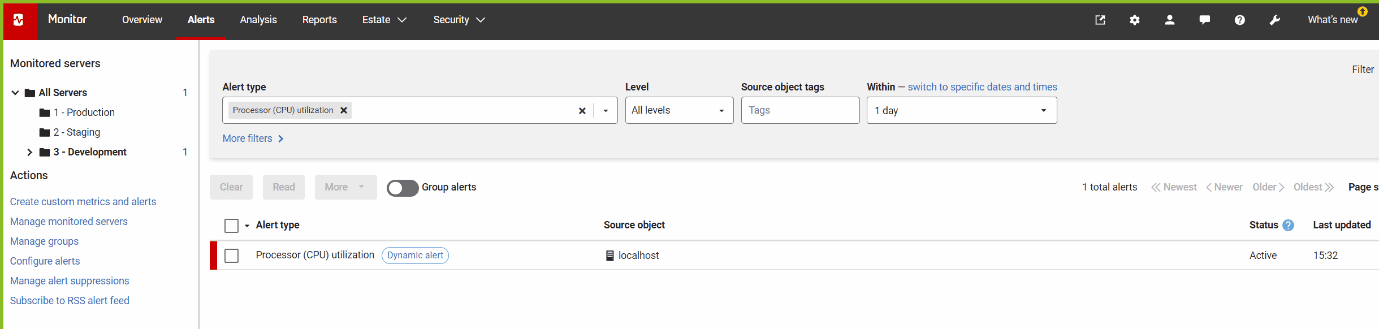
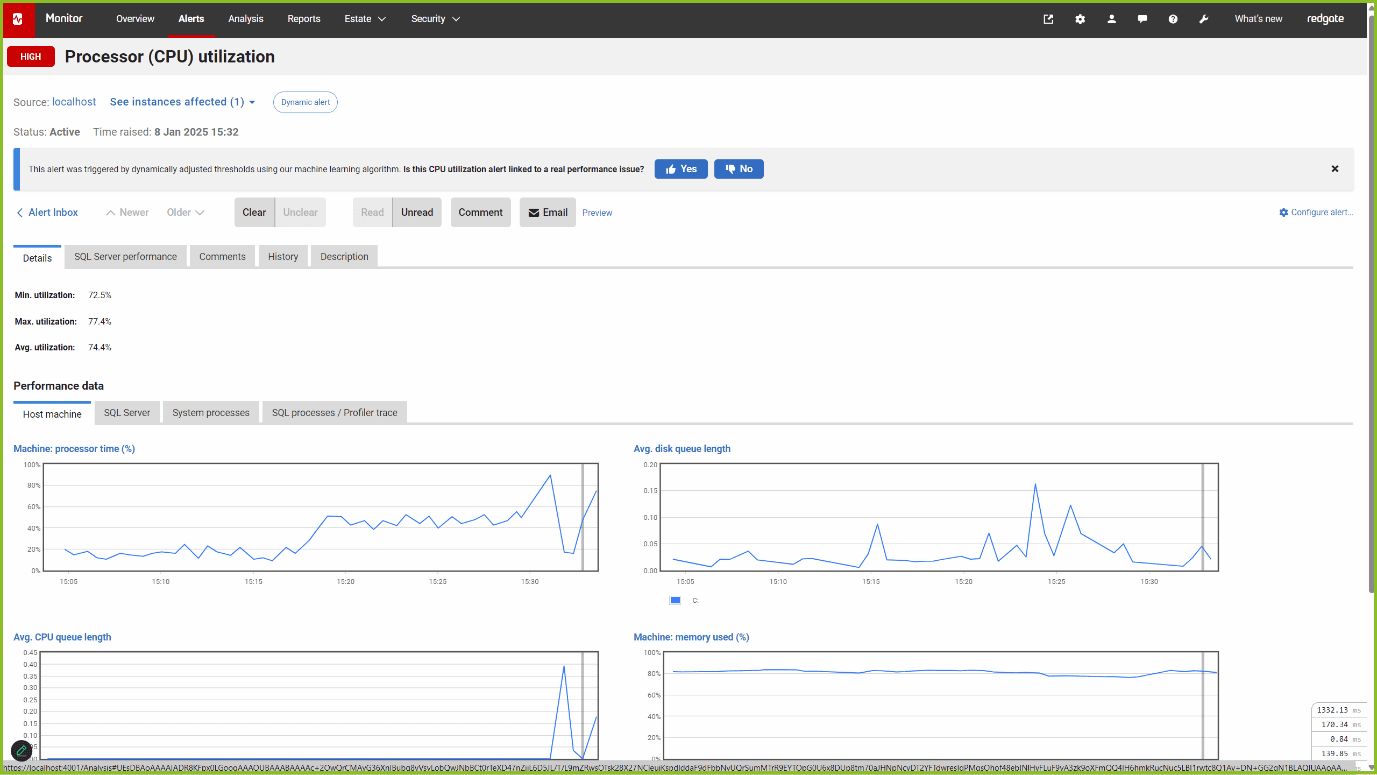
Simply click on the alert to review the details.
Dynamic thresholds are expected to generate fewer alerts than static thresholds, helping to reduce unnecessary alerts and allowing teams to focus on alerts based on real performance anomalies (please use the feedback buttons to tell us how well this works!)
How Redgate Monitor dynamic CPU alerting works
Dynamic alerting is an adaptive monitoring feature, designed to analyze historical metrics and generate context-aware alerts. Dynamic alerts are triggered by significant deviations from the predicted baseline behavior, rather than just on static threshold settings.
Key Features and Workflow
- Historical Data Analysis
Dynamic alerting requires at least 14 days of historical CPU usage data to generate accurate forecasts. The system uses this data to identify trends, including seasonal fluctuations such as hourly, daily, weekly, or monthly patterns. - Forecasting Normal Ranges
Using machine learning models, the system predicts an expected range of CPU utilization ("expected normalcy") for each hour of the day. Forecasts are generated when dynamic alerting is first enabled and then updated daily at 4 AM to account for recent data trends. - Alerting Logic
A dynamic alert triggers when CPU usage exceeds the forecasted range for a sustained period. The system falls back to the use of default static thresholds if:- historical data is missing or forecasting fails
- dynamic alerting is enabled for a group containing unsupported machines
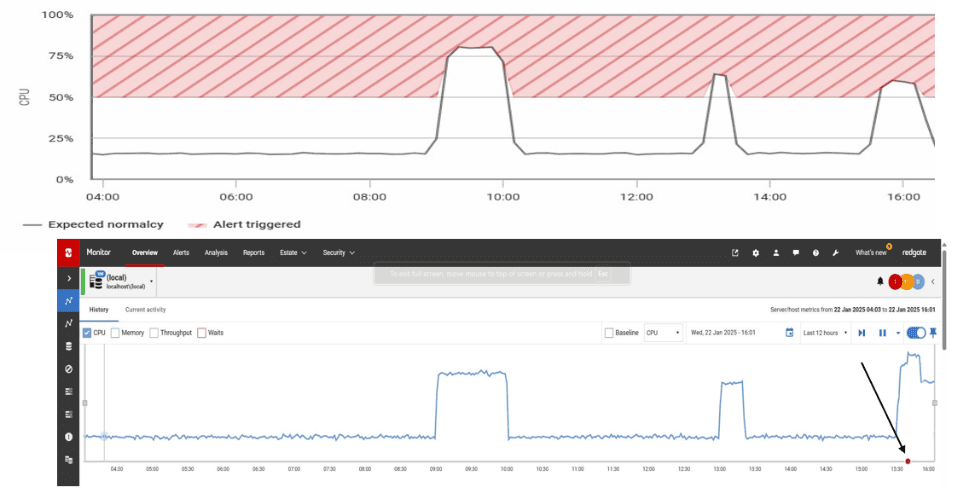
A chart is displayed in the alert configuration page showing the expected normal range for the day by a black line, while a hatched red region indicates the threshold beyond which an alert will be triggered. This threshold can be adjusted, with a default setting of 80% to reduce unnecessary alerts. Similarly, the duration a metric must remain in the red region before triggering an alert is configurable, with a default value of 600 seconds to avoid alerts from brief spikes. Alerts are sent only if the metric remains in the red region for the specified duration, based on these configurations.
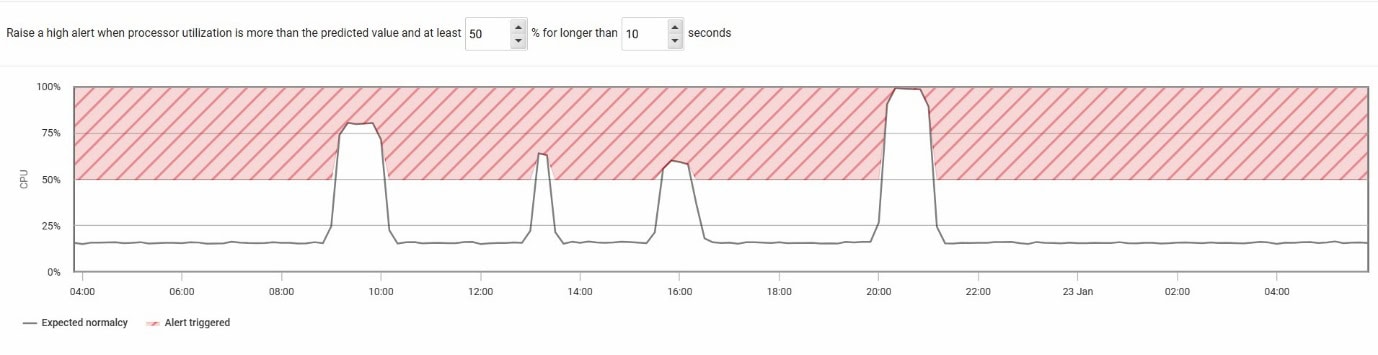
This adaptive approach minimizes noisy alerts by filtering out those expected trends, focusing instead on highlighting deviations. In the following example, the top graph shows the forecast, which was for a large CPU peak of 80% at around 09:00 and two smaller ones of 60% at 13:00 and 16:00. Redgate Monitor will dynamically adjust the defined alert threshold, just over these busy periods, to avoid unnecessary alerts. The bottom graph is the activity timeline for the server where we see that the first two CPU peaks were in line with the forecast and caused no alerts. However, the peak around 16:00 was much higher than expected and so still triggered the Processor (CPU) alert, as indicated by the arrow:
Performance and security considerations
Dynamic alerting will consume base monitor resources during the training and the training time increases with the number of machines on which it is enabled. Be aware that once an administrator enables the feature flag, any user with access to the alert settings page can activate dynamic alerting for individual machines or groups.
However, the forecast generation is designed to have as minimal an impact as possible on the Base Monitor's performance. It operates as a low-priority task with a two-hour timeout window, and the models have been parametrized to complete training for larger estates within this timeframe. If the process is incomplete within this window, it is terminated and will attempt to run again the next day.
All forecasting and alerting calculations are performed locally on the Base Monitor machine, ensuring data security by preventing external data transmission.
Summary
Dynamic alerting combines adaptive machine learning with customizable settings to provide alert notifications that are more accurate and meaningful because they are only sent in response to significant deviation from the predicted behavior, rather than transgression of a static threshold. Dynamic alerts are especially useful in environments with variable workloads. By operating locally and maintaining a small performance footprint, it ensures secure and efficient alerting tailored to the monitored systems.
Launched in preview in Dec 2024, it is available for the Processor (CPU) utilization alert on all database platforms. We welcome your feedback! From directly within the Redgate Monitor alert dashboard, you can use the feedback button with each alert to let us know how well dynamic CPU alerting picks out significant performance problems, and whether you notice any associated issues. Alternatively, contact us here to discuss your requirements for dynamic alerting and Redgate Monitor.
All feedback will help us improve the feature as we expand support for other alerts and platforms in future releases!
This document contains proprietary information and is protected by copyright law.
Copyright © 2026 Red Gate Software Limited. All rights reserved
Tools in this post
Redgate Monitor
Real-time multi-platform performance monitoring, with alerts and diagnostics
You may also like

Article
How to monitor the impact of patching on SQL Server performance
This article uses the Spectre/Meltdown bugs as means to demonstrate how you can use a tool like Redgate Monitor to assess the impact of patching on the throughput and performance of your SQL Servers.
Article
5 things to look for in a third-party monitoring tool
Update, 28 February 2024: A new edition of this article can be found here. A key finding from Redgate’s last State of Database Monitoring Survey of over 2,500 IT professionals was that 79% of respondents reported using either a third-party or in-house monitoring tool. It’s notable because it was an increase of 10 percentage points from the same survey the previous year – and the satisfaction rate with third-party monitoring tools also saw an increase of 18 percentage points to 86%. But when should you use an in-house tool, and when should you take the plunge and invest in a
Article
How to Monitor IDENTITY columns to prevent unplanned downtime
If a table runs out of IDENTITY values then it, and any dependent services and applications, will be "read-only" until the problem is fixed. Steve Jones explains how to set up a custom monitor to detect and prevent such problems.
Article
How to Detect SQL Injection Attacks using Extended Events and Redgate Monitor
Phil Factor shows how to monitor for the errors indicative of a possible SQL Injection attack on one of your SQL Server databases, using a Redgate Monitor custom metric that uses diagnostic data from Extended Events.
Article
Integrating Redgate Monitor into a Tier-1 Alert and Notification System
Redgate Monitor provides detail-level diagnostic data that will allow an expert to drill down to establish the cause of, and a fix for, any database problem. However, with support for webhooks, it can also contribute alerts to the sort of "Tier 1" alerting and paging system that an operations team might use to get an immediate notification of an urgent problem, anywhere on the network, and then coordinate a timely response.

Live training session
How to be Proactive, not Reactive with SQL Monitor
SQL Monitor allows you to manage your entire SQL Server estate, with instant problem diagnosis, and intelligent and customizable alerting. In this 30 minute session Redgate’s James King will demonstrate the best way you can use the tool to uncover abnormalities before they trigger an event, giving you the opportunity to act quickly and prevent any issues before they even occur. In this session James will cover: How to use SQL Monitor to help you find a problem in minutes Avoiding the blame game with data Setting up your alerts to avoid alert fatigue Whether you are just starting
Loading comments...