


SQL Monitor: Time For a 2nd Look
I’m inordinately proud to work for Redgate Software. One of the biggest reasons for my pride is because I can say, without equivocation, we make fantastic software that will help you do your job better, easier, and faster.
However, there was one piece of software, many years ago now, that I wasn’t so proud of.
Let me put it this way: I tried to get rid of SQL Monitor.
Where We Were Then
If we roll back the clock about 6 years or so, SQL Monitor was a totally different tool than what you see today.
Let’s talk internals first. The data structure was off. Performance was poor and I had a hard time recommending it to people with more than 20-30 servers. I just didn’t feel comfortable suggesting large scale enterprises take on a monitoring tool that I thought might put additional load on their systems.
Further, while we had a good alerting mechanism, a lot of the rest of the metrics we were collecting, just weren’t the best. We weren’t getting wait statistics, let alone all the good stuff on queries, locking, blocking, deadlocks and the rest. Further, what information we did provide was frequently hard to get to because the interface just wasn’t that sophisticated.
So, yeah, I started lobbying to just toss the tool aside.
I’ve never been happier to not be listened to.
Where We Are Now
Between my efforts to get rid of the tool, and some real concern expressed by the sales and development teams (to be honest and fair, it was the sales and development teams that really made the difference), the company reassessed SQL Monitor. We looked at what SQL Monitor did and how it worked. We compared it to other tools available. Heck, we compared it to other Redgate tools and how awesome they were. A path forward was clear and a plan was made and it’s now one of the best tools we offer.

This is an entirely new tool! Here’s what makes SQL Monitor so awesome today:
1. Dedicated development
Developers were assigned to the tool. Not just one team. Several different development teams. In fact, as of this writing, we have four different teams working on SQL Monitor. These teams sat down with Steve Jones, a whole bunch of you, our peers out in the Microsoft Data Platform community and me. They found out what we needed in a monitoring tool. Then, they started delivering it. Now we release new functionality, performance improvements and bug fixes once a week. We listen and we deliver on what the customer needs. I’ve seen things like the ability to search for a query get added right after a company asked for it.
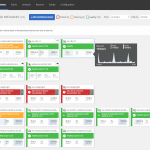
2. A single pane of glass for hybrid environments
The UI was updated to make it easier to navigate and drill down into all sorts of amazing details. New metrics were collected, including things like wait statistics, query recompiles, sophisticated block chains, and more. We made sure we had full support for Azure SQL Database, Azure Managed Instance and AWS RDS. You are probably running a hybrid set of tools between the cloud and on-premises. We’re a hybrid tool, providing you a single pane of glass into all your various servers and databases.
3. Support of large databases and server estates
More than that, queries got tuned. Data structures got adjusted. Code was improved. We changed from supporting only a handful of servers to supporting thousands. Yes, thousands. SQL Monitor can scale to meet you where you are.
We added all sorts of new mechanisms and metrics specifically oriented to large companies. If you have large server estates, we have tools, reports, and more, that will make your management of those estates a whole lot easier. Further, we’ll help you to make your estates safer and better protected through new functionality like Installed Versions and Backup reporting.
Time for you to Take Another Look at SQL Monitor?
If I was once skeptical, I can now proudly say: you should take some time out of your no-doubt busy schedule and check out SQL Monitor. If you’ve never seen it before, I think you’re going to be extremely happy with this tool. If you looked at it back in the day, you’re going to be pleasantly shocked at where we are now. Our teams have built a world class monitoring tool. Best of all, they’re not done. More and more functionality is being introduced all the time. Our systems are getting faster. We’re expanding the capabilities of the tool to support more servers and do it all in a better way.
I’m happy to say, I was wrong. SQL Monitor is a fantastic tool, and it’s time for you to take a second look.

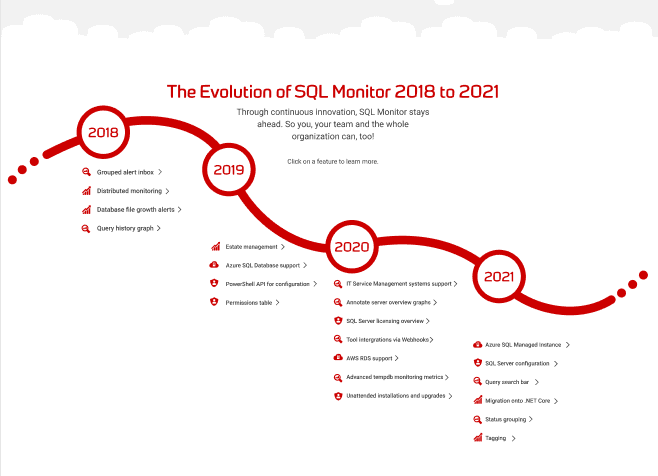
Find out why SQL Monitor is fantastically placed to help you and your team here, and see the full evolution in interactive infographic format here.
Read next
Blog post
7 steps to effective database monitoring
Updated in 2024. There are a whole range of reasons you should monitor your SQL Server estate, from the essentials that support firefighting through to advanced modelling to help with proactive future planning. However, there are a few steps you need to take in order to ensure the monitoring is effective. In this post, we’ll

Blog post
Monitor your SQL Server databases in the cloud and on-premises with one monitoring tool
There’s no doubt the cloud is having a big impact on the nature and make-up of SQL Server estates. The 2021 State of Database DevOps report from Redgate, for example, showed that 58% of organizations now use the cloud either wholly or in combination with on-premises servers, compared to 46% in the same report a
Interactive infographic
Find out how SQL Monitor helps you and your team work smarter
All the nifty features in an easy to grasp format.
Tools in this post
Redgate Monitor
Real-time multi-platform performance monitoring, with alerts and diagnostics
You may also like
Blog