


New in Redgate Monitor: Oracle Data Guard support
DBAs running Oracle Data Guard know that keeping replicas healthy requires constant vigilance. It often involves querying dynamic performance views, such as V$DATAGUARD_STATS, or running Data Guard Broker commands to check lag and role status. It’s time-consuming, and if you miss a problem, a switchover or failover may not succeed when it’s urgently needed. This can even result in data loss during outages.
With Redgate Monitor, all that scripting effort disappears. Replica health, transport lag, apply lag, and role transitions are tracked automatically, so you'll know if replicas fall behind or a Standby isn’t ready to take over. All of this is visible, instantly, from the Monitor dashboard, so you can be confident your data will remain available and protected.
Stay ahead of Data Guard issues
Instead of needing to run scripted checks, piecing together information from various sources, Redgate Monitor's built-in Data Guard support gives you a clear picture of replica health, performance, and status in one place.
It gives you an easy way to:
- Define, manage and monitor your HA/DR topology – group your Oracle instances into a Data Guard setup, so you always know which Standbys belong to which Primary, even as roles switch
- See roles and health at a glance – view each replica’s current role (Primary, Physical Standby, etc.) and health status, and instantly assess if, for example, a Standby is in a healthy state to take over
- Track replication lag with detailed metrics – critical for assessing if a failover would succeed without service or data loss. You’ll see immediately if there’s:
- Transport lag – delay in shipping redo logs from Primary to Standby
- Apply lag – delay in applying logs on the Standby instance
- Drill into replica details — on any server’s overview page, use the Data Guard panel to view lag graphs, role history, and replica-specific health metrics in context.

Redgate Monitor tracks health, lag, and role transitions in Data Guard
Together, these features give DBAs confidence that Data Guard is working as intended, and that any issues will be caught before they threaten availability or introduce risk of data loss in a failover.
Add and manage Data Guard instances with ease
Adding Oracle Data Guard environments to Redgate Monitor is straightforward. When you add a Primary instance, you can define a new Data Guard group. As you add Standby instances, simply select the same Data Guard group alias to link them.
This creates a logical association between Primary and Standby replicas, so Redgate Monitor always understands the relationships between them, without you having to track these relationships manually.
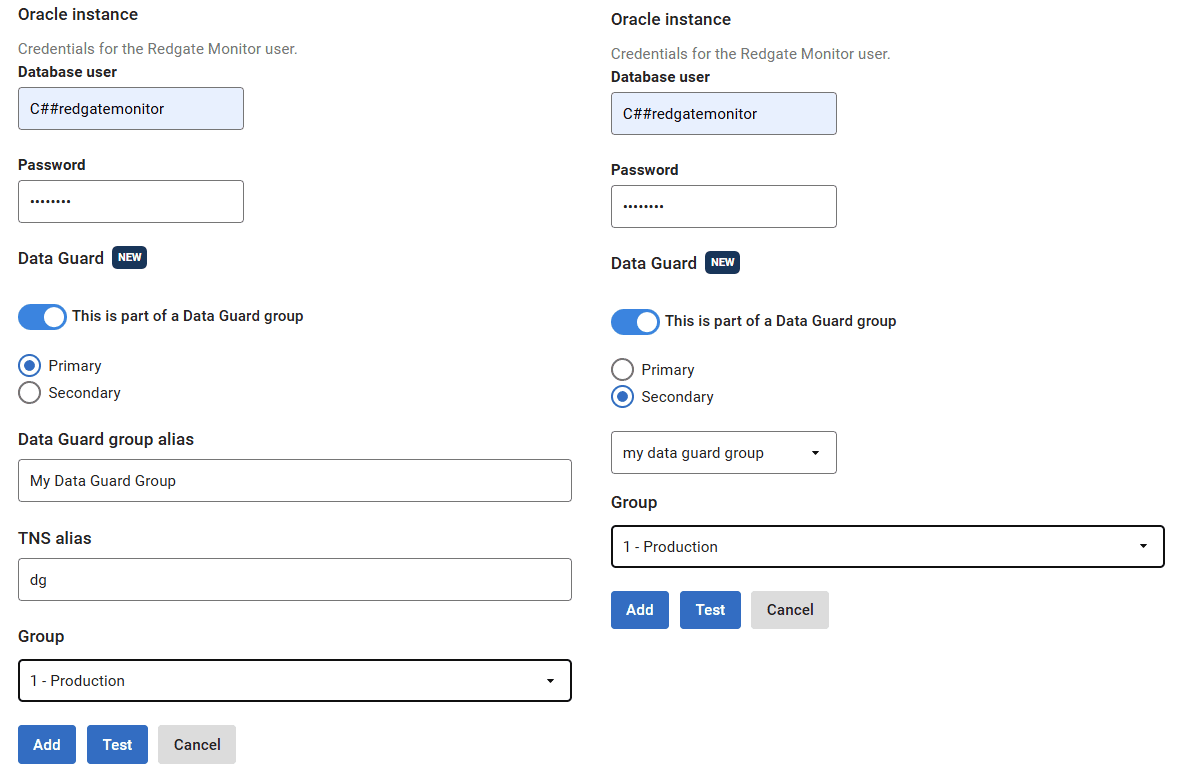
(Left) Adding Primary DG Instance, (Right) Adding Secondary DG Instance
Quick drilldown into key Data Guard metrics
Once set up, each Oracle instance displays a dedicated Data Guard panel in its overview page. This highlights essentials like current role, status and transport and apply lag. Lag data is also shown as graphs, making it easy to spot trends and confirm replicas are keeping pace. These real-time metrics give DBAs a focused view of replica health, crucial for catching issues early and resolving them before they compromise availability or data protection.
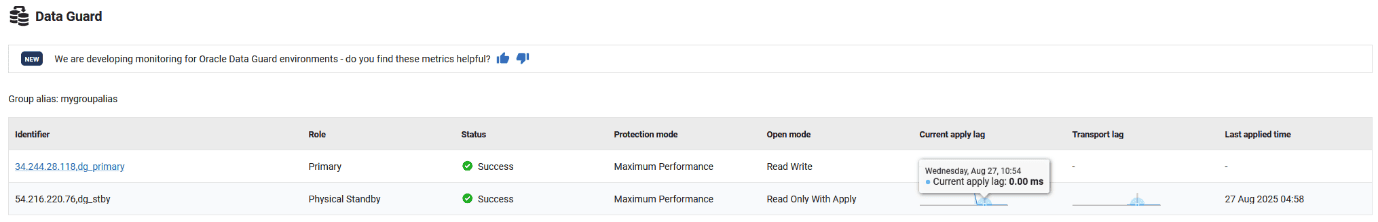
Data Guard section in an Oracle server overview
Conclusion
With Data Guard support built in, Redgate Monitor takes away the manual overhead of running health checks and Broker queries. You can quickly review replica health, lag, and role changes, giving you confidence that your Data Guard environment is ready to protect your data, when it's needed.
This document contains proprietary information and is protected by copyright law.
Copyright © 2026 Red Gate Software Limited. All rights reserved
Tools in this post
Redgate Monitor
Real-time multi-platform performance monitoring, with alerts and diagnostics
You may also like

Blog
Redgate Monitor Product Updates - July 2026

Blog
Loading comments...