


A Faster Way To Spot What’s Slowing Down Your PostgreSQL Database
When a PostgreSQL database starts misbehaving, your instinct might be to jump straight into query plans and index statistics. But often, the real story hides one level higher, in wait events: the moments where PostgreSQL pauses and tells you exactly what it's waiting for. Redgate Monitor now surfaces this data visually for PostgreSQL customers. Here's why that matters.
What Are Wait Events, and Why Should You Care?
Every time a PostgreSQL session can't proceed immediately, it registers a wait. These waits are grouped into Wait Event Types, which are high-level categories that tell you immediately "why" the wait occurred:
- Lock – heavyweight locks blocking progress (i.e., waiting on a relation)
- LWLock – lightweight internal locks
- IO – waiting on disk reads/writes (e.g., DataFileRead)
- Client – sessions waiting for the application to respond
- IPC – inter-process communication delays
- Timeout – explicit waits or timer-based pauses
- Activity – background process idle states
- BufferPin – contention on shared buffer pins
- Extension – waits originating in extensions
This data lives in pg_stat_activity, exposed via the wait_event_type and wait_event columns. PostgreSQL has exposed this information for some time, but having raw query output is not the same as understanding it. Redgate Monitor helps make it usable.
Seeing the Pattern, Not Just the Point-in-Time
Redgate Monitor renders wait event data as a stacked time-series chart, with each Wait Event Type represented as a distinct layer. This changes how you interact with the information entirely.
Instead of running a query and getting a snapshot, you're watching the rhythm of your database over time. You start to develop an intuition for what normal looks like, and that makes anomalies unmistakable when they appear. A sudden surge in Lock waits, or an unexpected spike in IO, stands out immediately against the baseline.
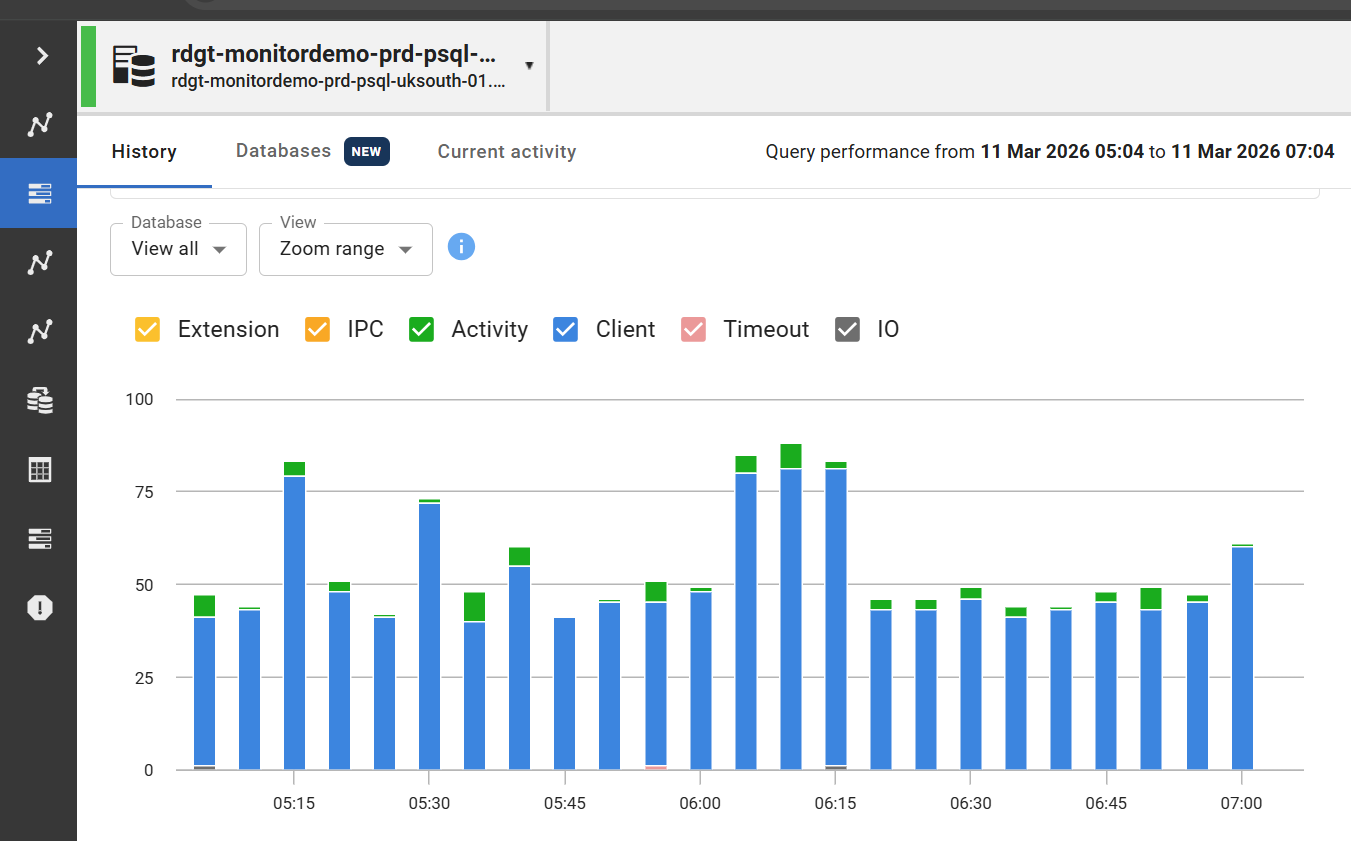
(Fig 1: Stacked Wait Event Type view in Redgate Monitor)
You can scope the view to your entire PostgreSQL cluster, drill into a specific instance, or zoom into a particular time window, which gives you flexibility whether you're investigating a live incident or reviewing historical patterns.
Drilling In When Something Stands Out
If a specific sample catches your eye, clicking it reveals a breakdown of the wait event types active at that moment. This includes wait event types that represent only a small percentage of total waits. That last point matters as minor wait categories are easy to miss in a raw table, but here they're visible and accounted for.
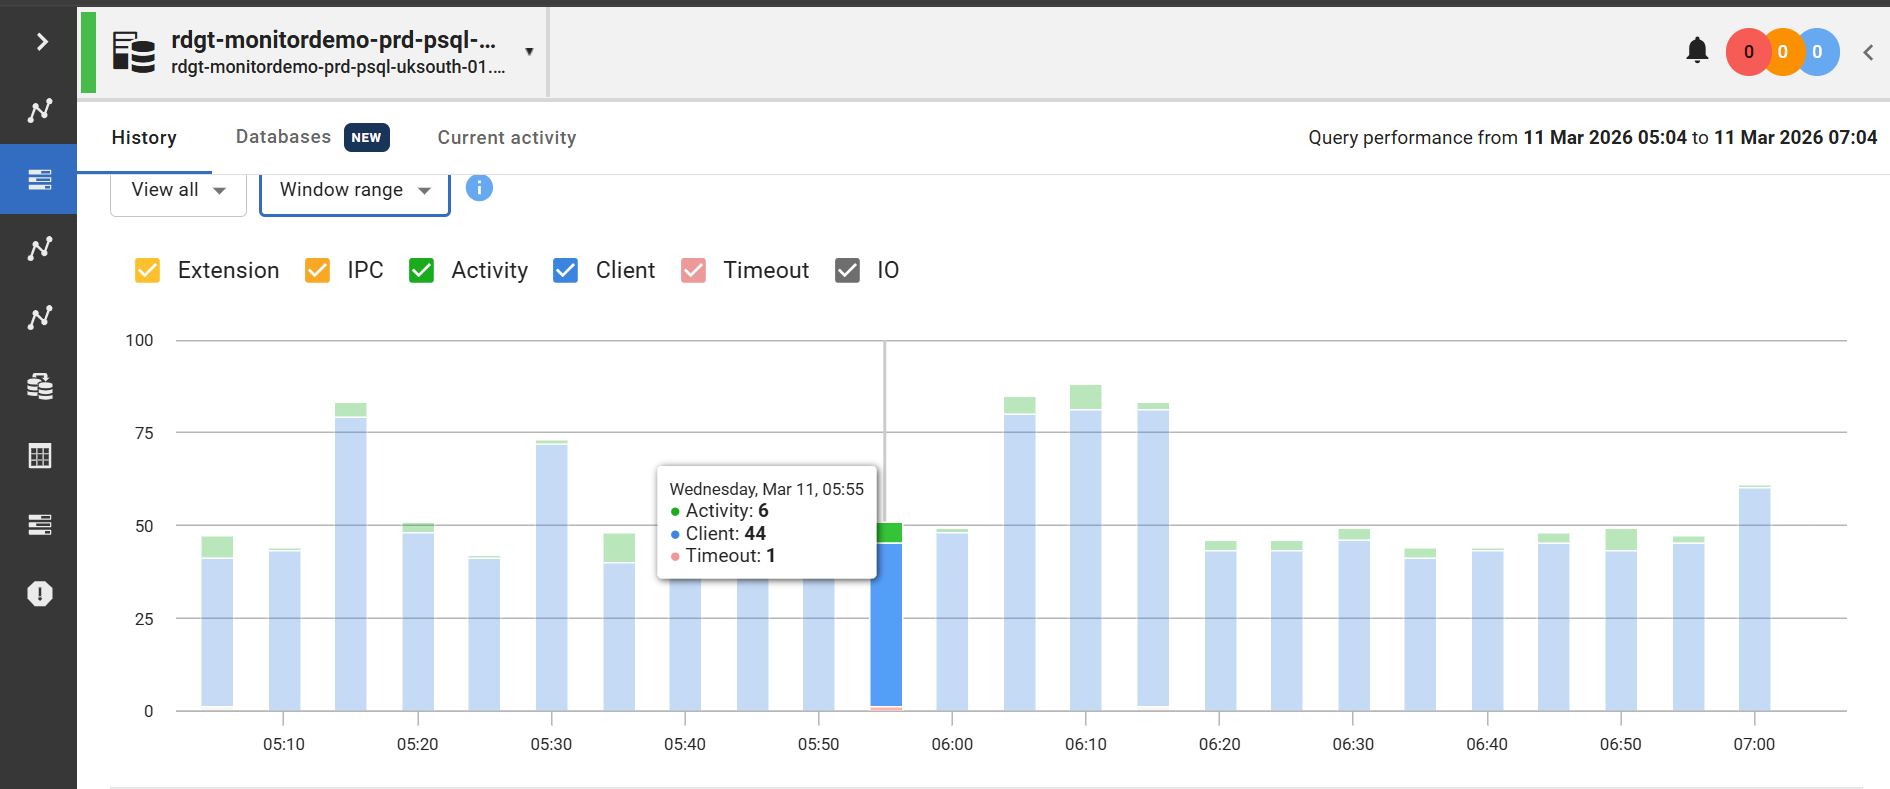
(Fig 2: Wait Event Type popup for a selected sample)
Beneath the chart, a detail panel shows:
- Wait Event Type and specific Wait Event
- A plain-English description of what the wait means
- Occurrence count
- Percentage of total waits
- Average occurrences per second
In a typical idle or lightly loaded system, you might see Client waits dominating, perhaps 90%+ of activity. That's not a problem; it simply means most sessions are waiting for the application layer to send the next command. Knowing that confidently is itself valuable. It rules out a class of problems immediately.
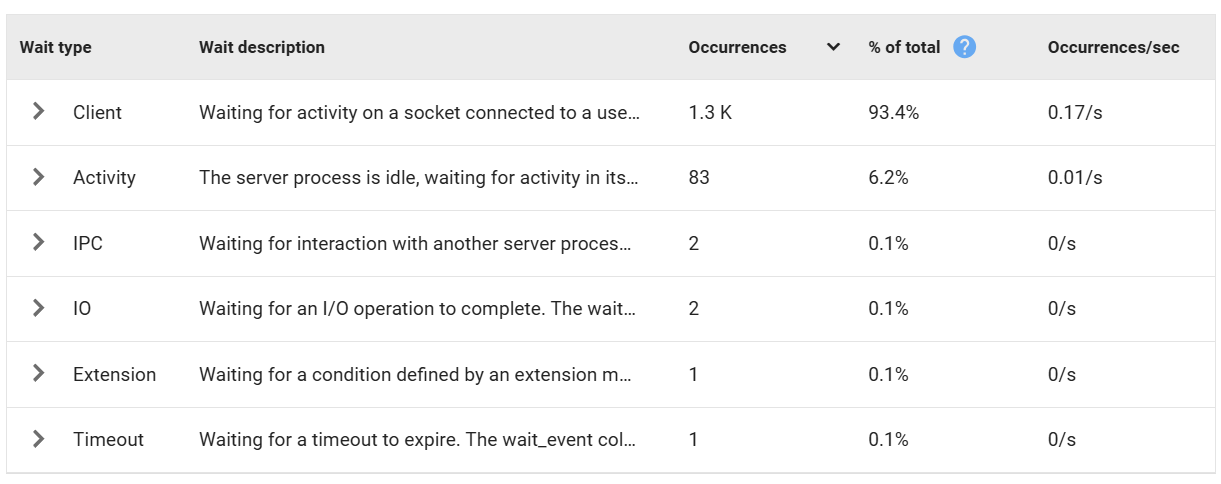
(Fig 3: Wait Type Information)
Expanding Into the Detail
Where it gets genuinely powerful is when you expand a Wait Event Type to see the individual wait events contributing to it. Rather than just knowing that IO is elevated, you can see which specific IO waits are contributing, such as DataFileRead, WALWrite, SLRURead, and in what proportion. The descriptions are precise and actionable, so there's no need to cross-reference documentation mid-investigation.
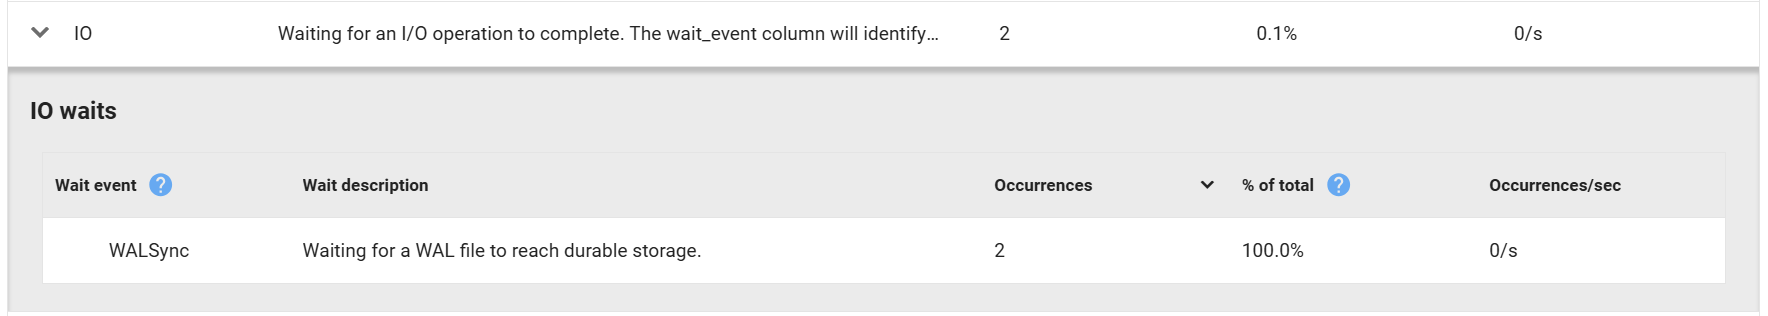
(Fig. 4: Details of IO Waits)
Why This Matters for PostgreSQL DBAs
Wait event analysis has been a cornerstone of performance diagnosis in enterprise database platform environments for years. It’s a methodology that works: rather than jumping straight into execution plans, you first let the database show where sessions are spending time, then investigate from there.
PostgreSQL has had the underlying data for a while, but without a tool that really surfaced it effectively. This feature closes that gap, giving Postgres teams the same intuition-building, pattern-recognition workflow that experienced DBAs have relied on for decades.
If you're troubleshooting intermittent slowdowns, investigating an incident after the fact, or simply trying to understand how your PostgreSQL cluster behaves under normal load, wait event visibility is one of the most efficient places to start.
We're looking forward to hearing how PostgreSQL users put it to work!
If you’d like to see what this approach looks like in practice, feel free to get in touch, download a trial, or check out Redgate Monitor at your own pace in our live demo environment.
This document contains proprietary information and is protected by copyright law.
Copyright © 2026 Red Gate Software Limited. All rights reserved
Tools in this post
Redgate Monitor
Real-time multi-platform performance monitoring, with alerts and diagnostics
You may also like
Blog
Without Governance, AI Is Just Faster Failure

Blog
Seeing the Bigger Picture: What technical leaders can learn from evolving monitoring needs

Blog
Loading comments...