


Replication Job Monitoring Support in Redgate Monitor
In many SQL Server environments, replication remains essential for offloading reporting and analytics workloads, or for maintaining local and synchronized data copies across regions. And yet, when replication jobs fail or fall behind, it can be difficult to spot the issue and diagnose the cause quickly.
The new Replication Monitoring in Redgate Monitor gives DBAs real-time insight into replication jobs across their estate, including transactional replication, configured with either push or pull subscriptions, and the performance of the Replication Distribution Agent.
Unlike SQL Server’s native Replication Monitor, which requires manual connections to each publisher, distributor, or subscriber depending on the replication topology, Redgate Monitor provides a unified view of replication across your estate. It automatically tracks push and pull subscriptions, eliminating the need for separate connections and giving instant visibility into replication health.
Reviewing current replication job activity across your estate
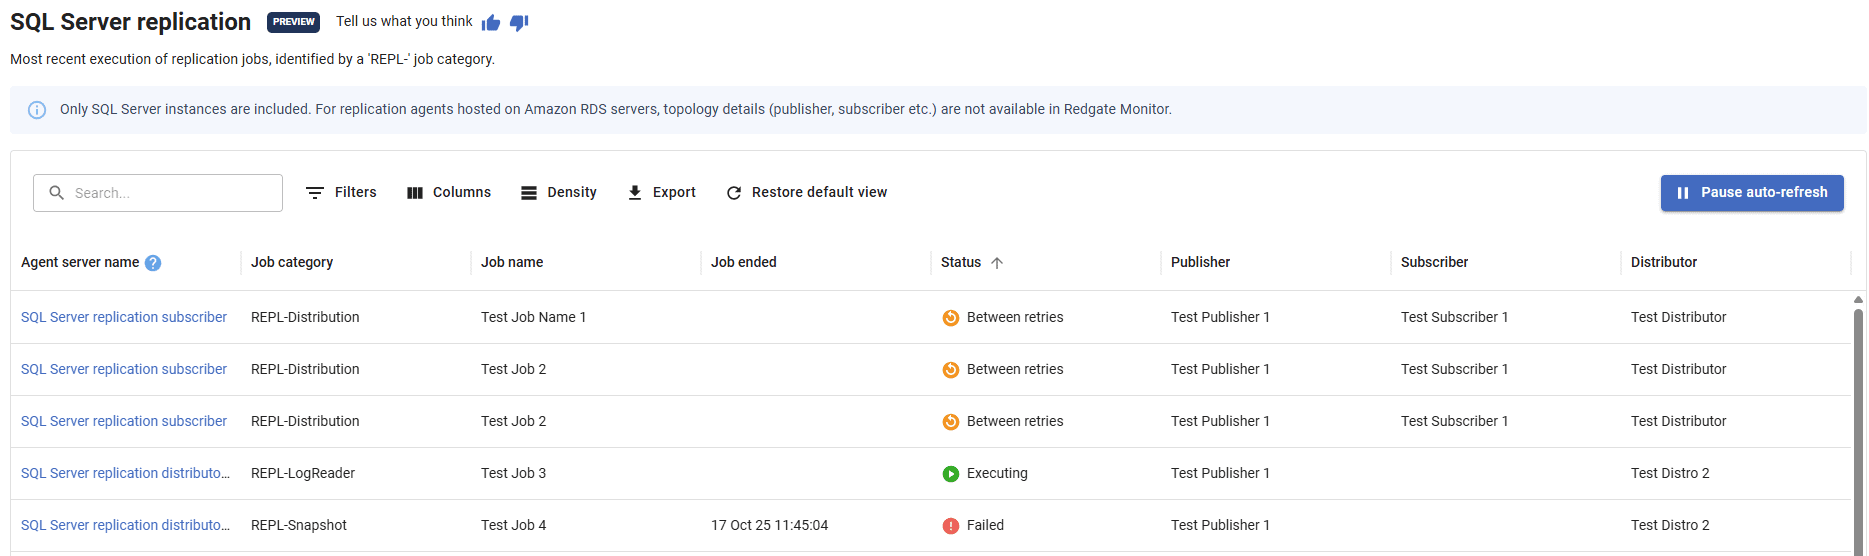
Redgate Monitor captures Replication job data at regular intervals, providing DBAs with an up-to-date view of activity across the estate, including the job's name, duration, status, and replication topology. Redgate Monitor identifies replication jobs by detecting SQL Server Agent jobs categorized with the “REPL-” prefix.
This data appears on the new SQL Server replication page under the Estate tab, showing the most recent replication job executions. Additional information about individual columns can be found in our documentation.
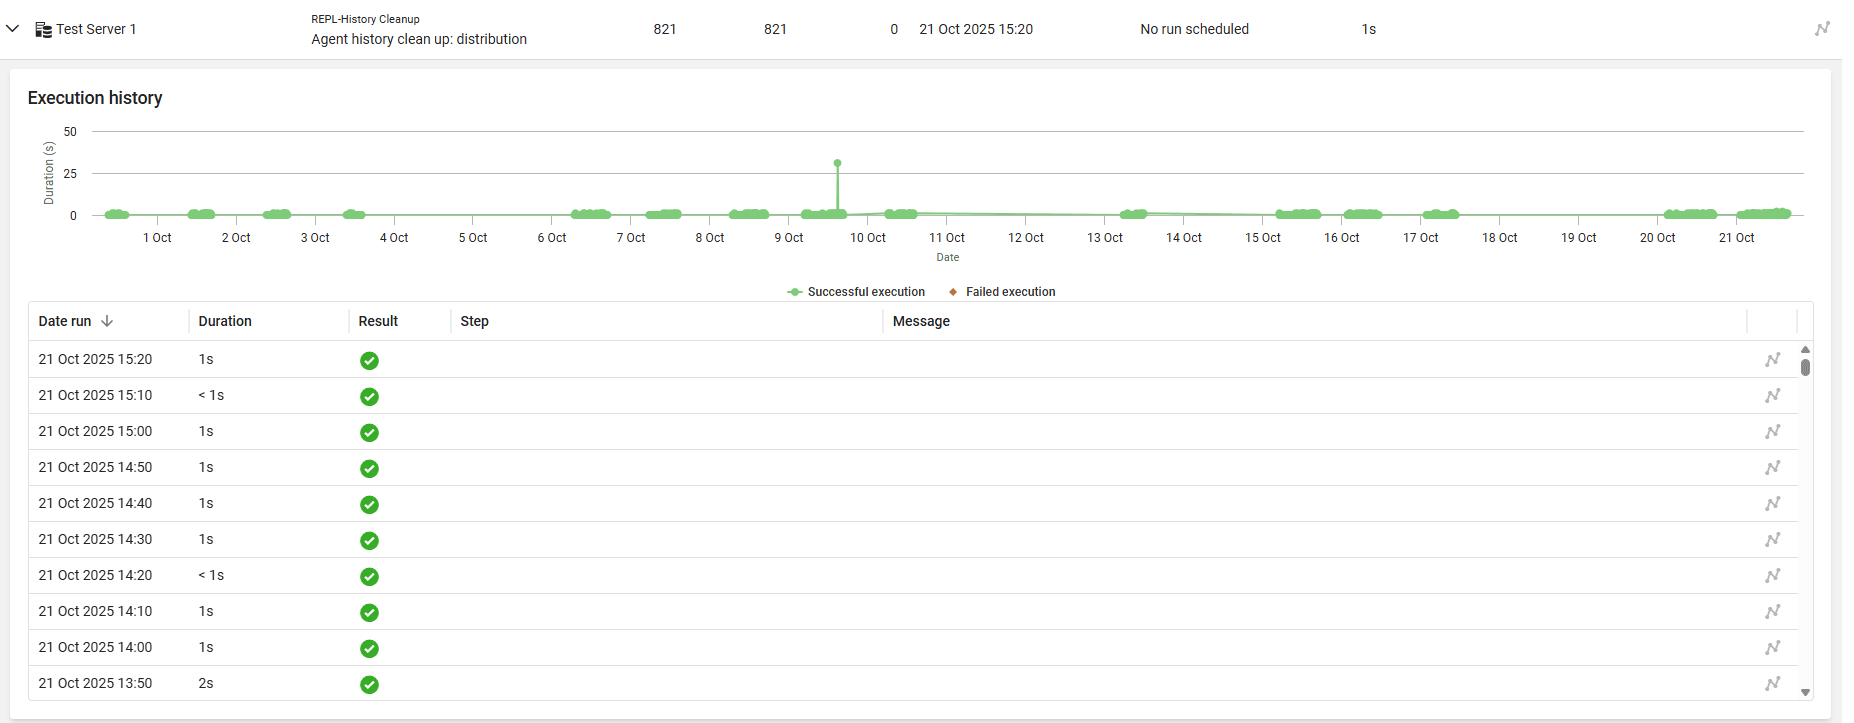
More details of completed executions and historical data for replication jobs can be found on the Jobs page. This makes it easier to identify potential replication lag, for example, when an agent job’s duration suddenly deviates from its typical baseline.
Alerting
With replication monitoring in version 14.2 of Redgate Monitor come two new alerts:
- Replication job failure alert
- Replication maintenance job failure alert
These alerts function similarly to Redgate Monitor's Job failure alerts but target jobs with a category starting with “REPL-”. As with all other alerts, notifications can sent via email, Slack, Microsoft Teams, etc.
Replication job failure alert
The Replication job failure alert in Redgate Monitor is event-based, triggering immediately whenever a replication job fails. It monitors replication jobs across the following categories:
- Distribution
- Merge
- Snapshot
- Log Reader
- Queue Reader
The alert details include a complete breakdown of the job failure, including the error message and corresponding replication command, allowing a DBA to direct their diagnosis and resolution of the problem. For example, if a distribution agent job fails while running a command to insert a row into the subscriber table and the error shows a primary key conflict, then the DBA knows straight away there’s a data consistency issue, without having to dig through the job history.
Replication maintenance job failure alert
The Replication Maintenance Job Failure alert is a continuous alert that triggers when a replication maintenance job fails for the first time. Since these jobs run frequently, only one alert is raised per failure event. The alert remains active until Redgate Monitor detects a successful run of the job. Replication maintenance jobs are denoted by the following categories:
- Alert Response
- Distribution Cleanup
- Checkup
- Subscription Cleanup
- History Cleanup
For example, if a Distribution Cleanup job fails because the MSrepl_commands table has grown too large, Redgate Monitor surfaces the error on the alert page. DBAs can quickly identify the cleanup procedure that’s struggling to process large volumes of data, and then adjust retention settings or reduce table size manually. The alert clears automatically once the issue is resolved.
More information about the two new replication alerts can be found in our documentation.
Conclusion
SQL Server replication keeps data flowing across servers, but when agents stall, latency builds up, or jobs fail, the root cause can be elusive. Redgate Monitor now gives DBAs a single view of all replication activity, with detailed real-time alerts that pinpoint the problem fast.
Try out replication monitoring in Redgate Monitor and see how it simplifies troubleshooting.
Read next

Blog post
Tracking Aborted Queries and Memory Grants in Redgate Monitor
Redgate Monitor now surfaces two common SQL Server query issues that usually take manual work to uncover: cancelled or aborted queries and high memory-grant queries. You can see both in the Query Executions view for each SQL Server instance, directly alongside server activity and alerts, so you can diagnose the cause much faster.

Product learning article
Troubleshooting SQL Server Queries using Actual Execution Plans
For SQL Server 2019 onwards, Redgate Monitor can now show the actual execution plan, complete with runtime statistics, for expensive queries that were running over any period of investigation. This means you'll not only know how SQL Server executed your poorly performing query but also see accurate runtime data. Any big discrepancies between estimated and actual row counts will be revealed, and Redgate Monitor will highlight any warnings and offer recommendations.
Tools in this post
Redgate Monitor
Real-time multi-platform performance monitoring, with alerts and diagnostics
You may also like

Blog
How to run a proof of concept that de-risks your monitoring decision

Blog
A Faster Way To Spot What's Slowing Down Your PostgreSQL Database
Blog
Loading comments...