


Query Plan Compare for PostgreSQL in Redgate Monitor
Performance investigations are a fact of life in database administration. Redgate Monitor already makes it simple to spot resource usage spikes, and having identified the offending SQL statement, the next question becomes: why is it behaving this way, and what changed?
Query Plan Compare for PostgreSQL in Redgate Monitor is designed to answer this question by showing how execution plans for the same query changed over time, making it straightforward to identify exactly when and why performance improved or degraded. Let's dig in.
Seeing Plan History at a Glance
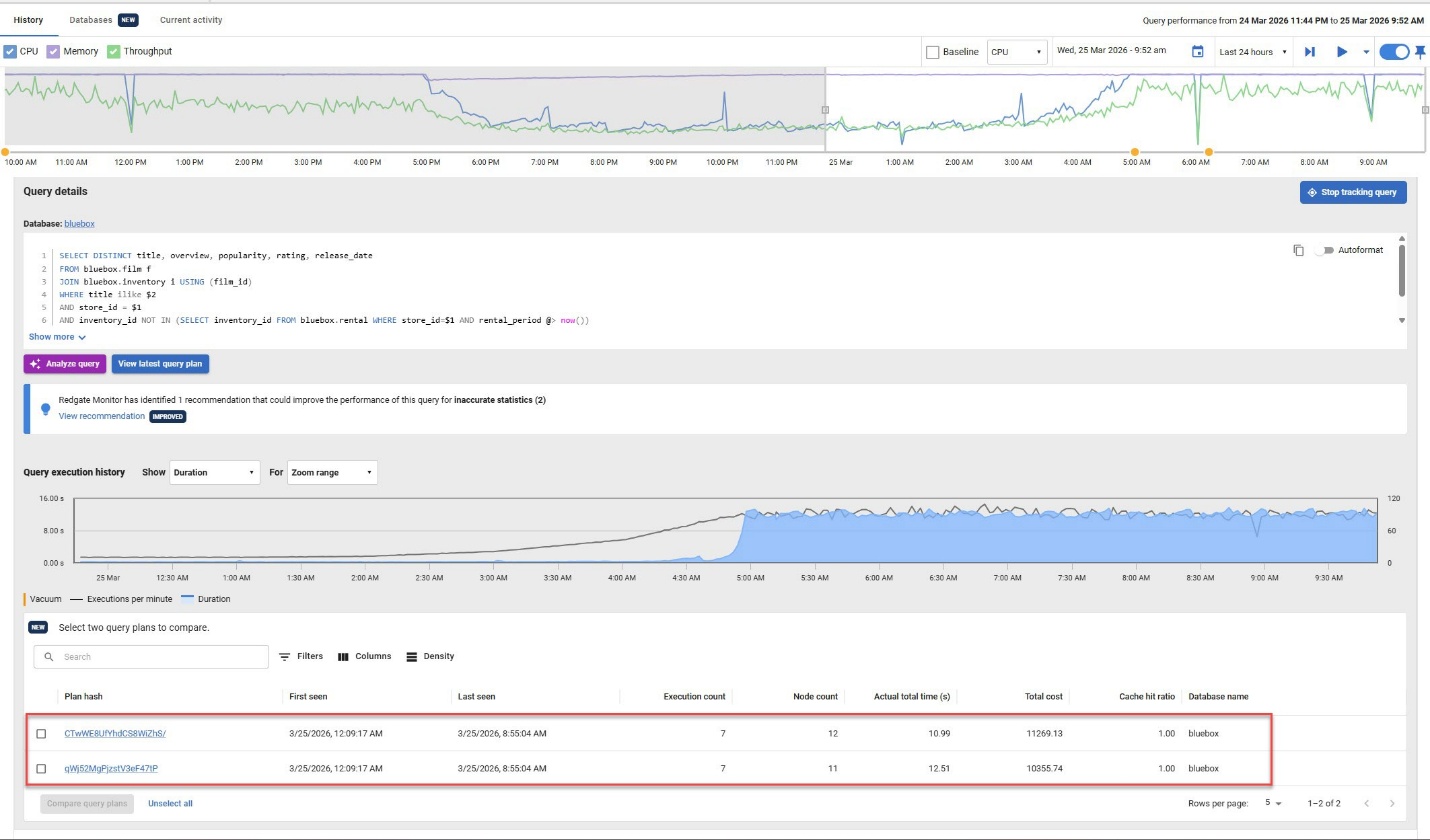
When you expand a query in Redgate Monitor, multiple plan hashes associated with that query ID are displayed alongside a query execution history graph, showing query duration over time. Plan hashes are unique identifiers assigned to each distinct execution plan for a given query ID in PostgreSQL and seeing them side by side immediately tells a story. In the example shown, the qWj52MgPjzstV3eF47tP plan ran over 1.5 seconds slower than the CTwWE8UfYhdCS8WiZhS/ plan - a difference that would have taken significant digging to uncover manually.
Choosing What to Compare
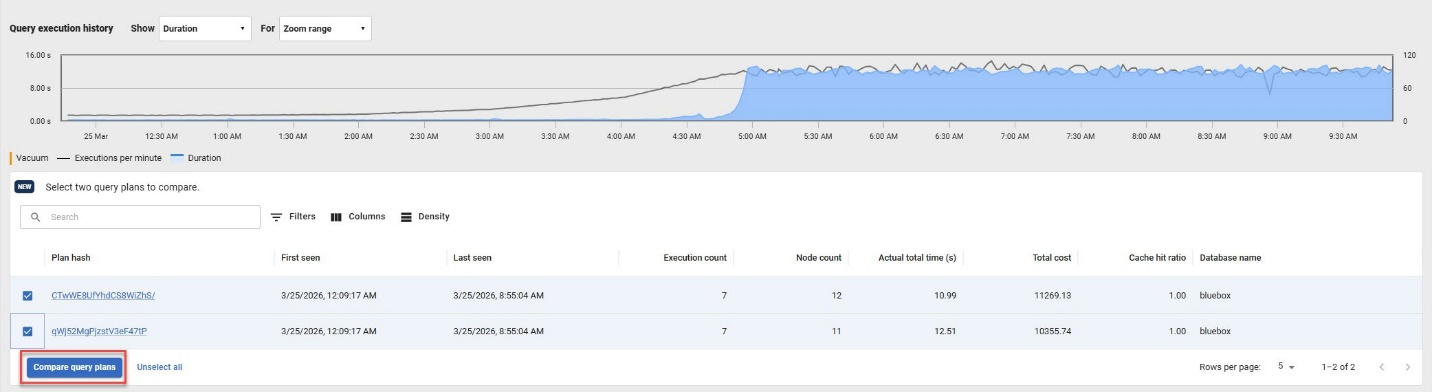
A single query ID can accumulate many plans over time, but you have full control over which ones to examine. Simply check the plans you want to investigate (in our example, the two shown) and click Compare Query Plans to move forward.
The Query Plan Compare Interface
You're now on the comparison page, where the real analysis begins. The interface is feature-rich, so here's a walkthrough for anyone coming to Query Plan Compare for the first time.
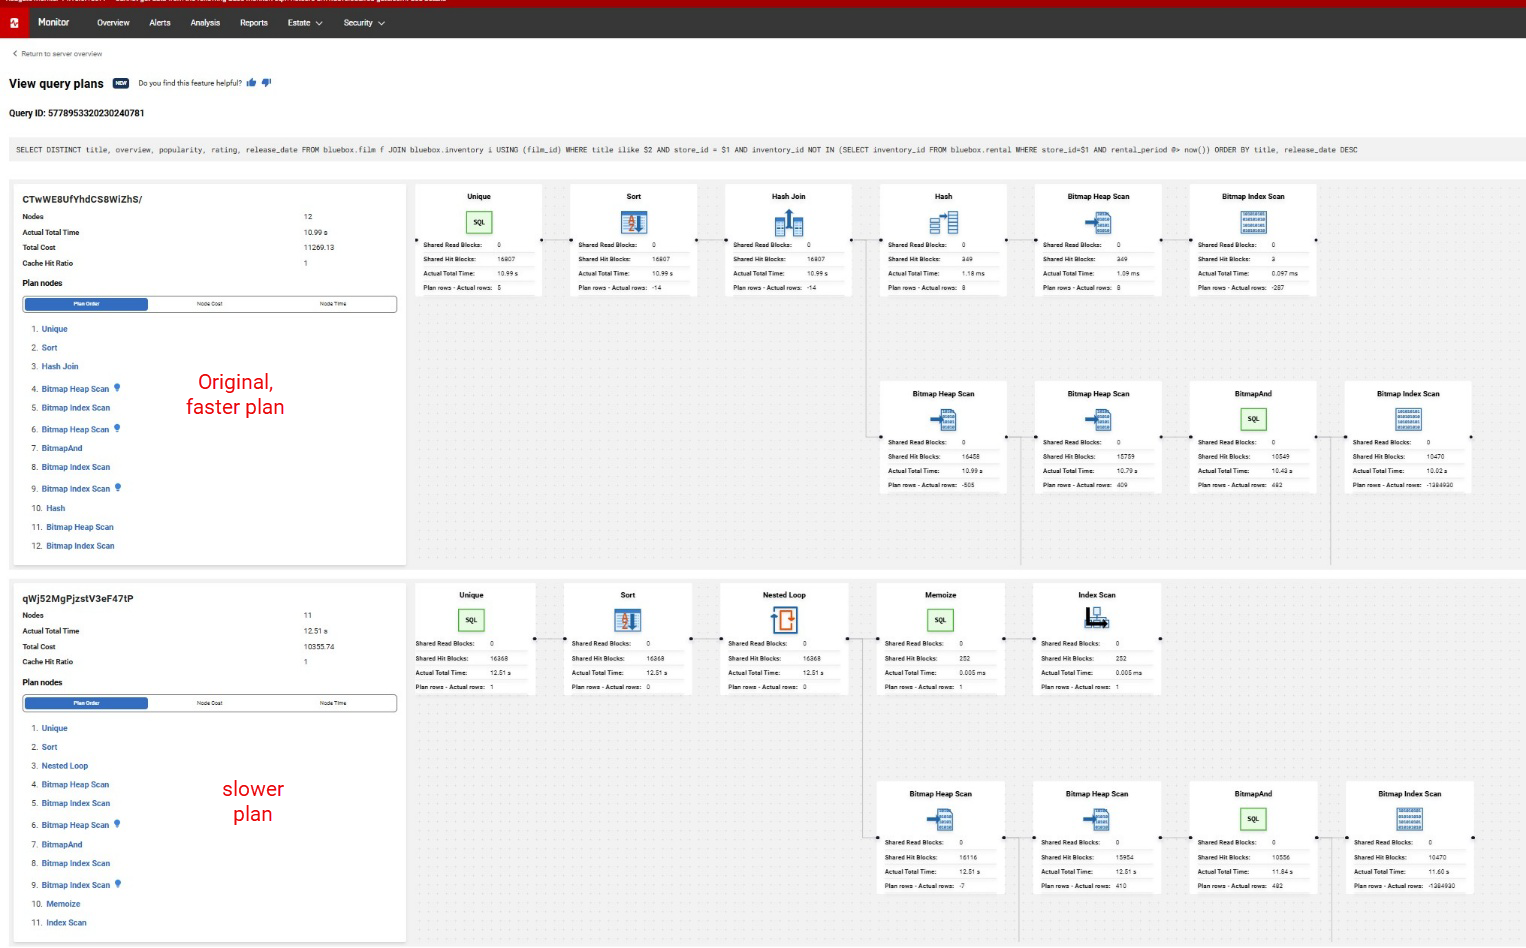
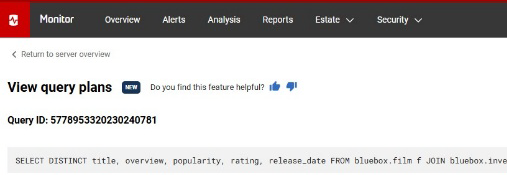
At the top, the Query ID and the full SQL statement are displayed for reference, which keeps context front and center as you work through the details.
On the left, the plan hashes and their associated details are listed side by side. Plan Order is highlighted first, giving you an immediate signal of where performance shifted between executions. From there, you can select and compare individual plan steps to examine differences in cost, row estimates, cardinality, and more. These differences helps explain why the optimizer chose the path it did, even when that choice wasn't the most performant one.
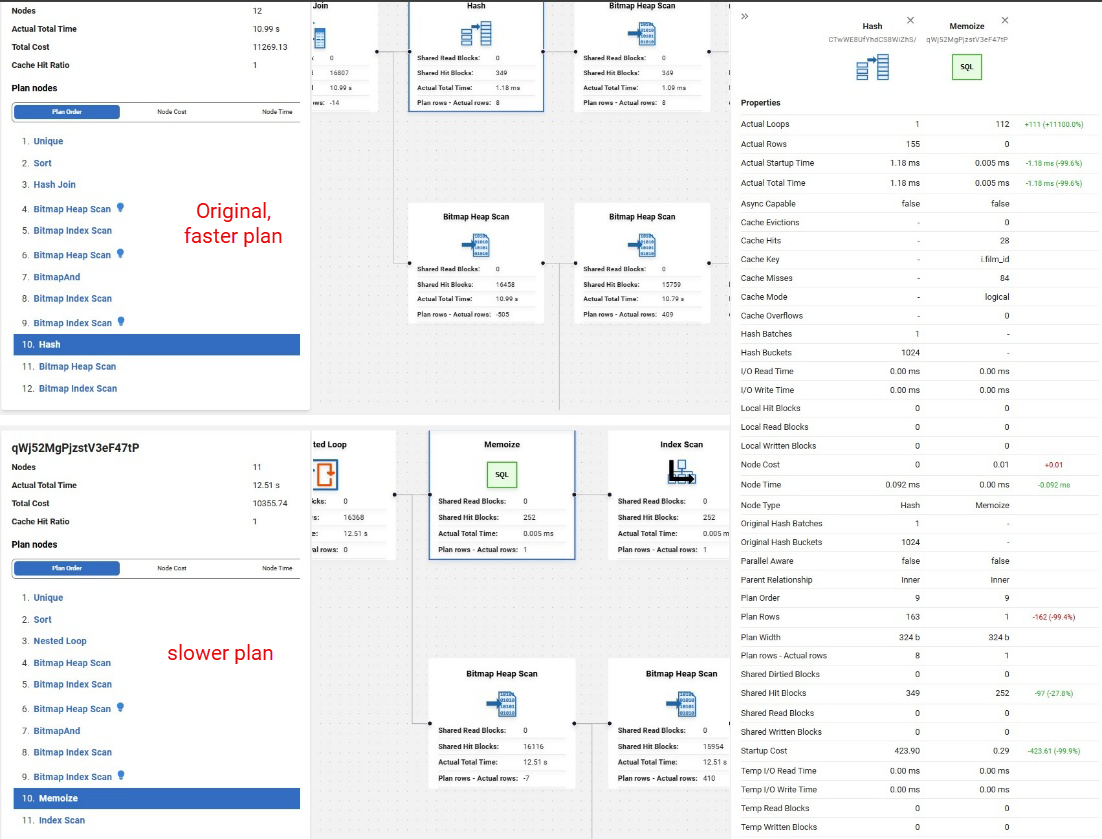
Comparisons only take place when the same property is detected in both nodes. In cases where the property contains the words "cost", "time" or "block", lower values are reported in green, indicating improvement, and higher values in red, for degradation.
In this example, Query Plan Compare shows that PostgreSQL is no longer using the same execution strategy for the query. One plan relies on a hash-based join, while the other switches to a nested loop with Memoize and an Index Scan. Even though the latter plan has a lower estimated cost, it took longer to run, suggesting that the optimizer misjudged the cost of the nested loop/memoize strategy. This is the sort of regression that Query Plan Compare helps you spot quickly.
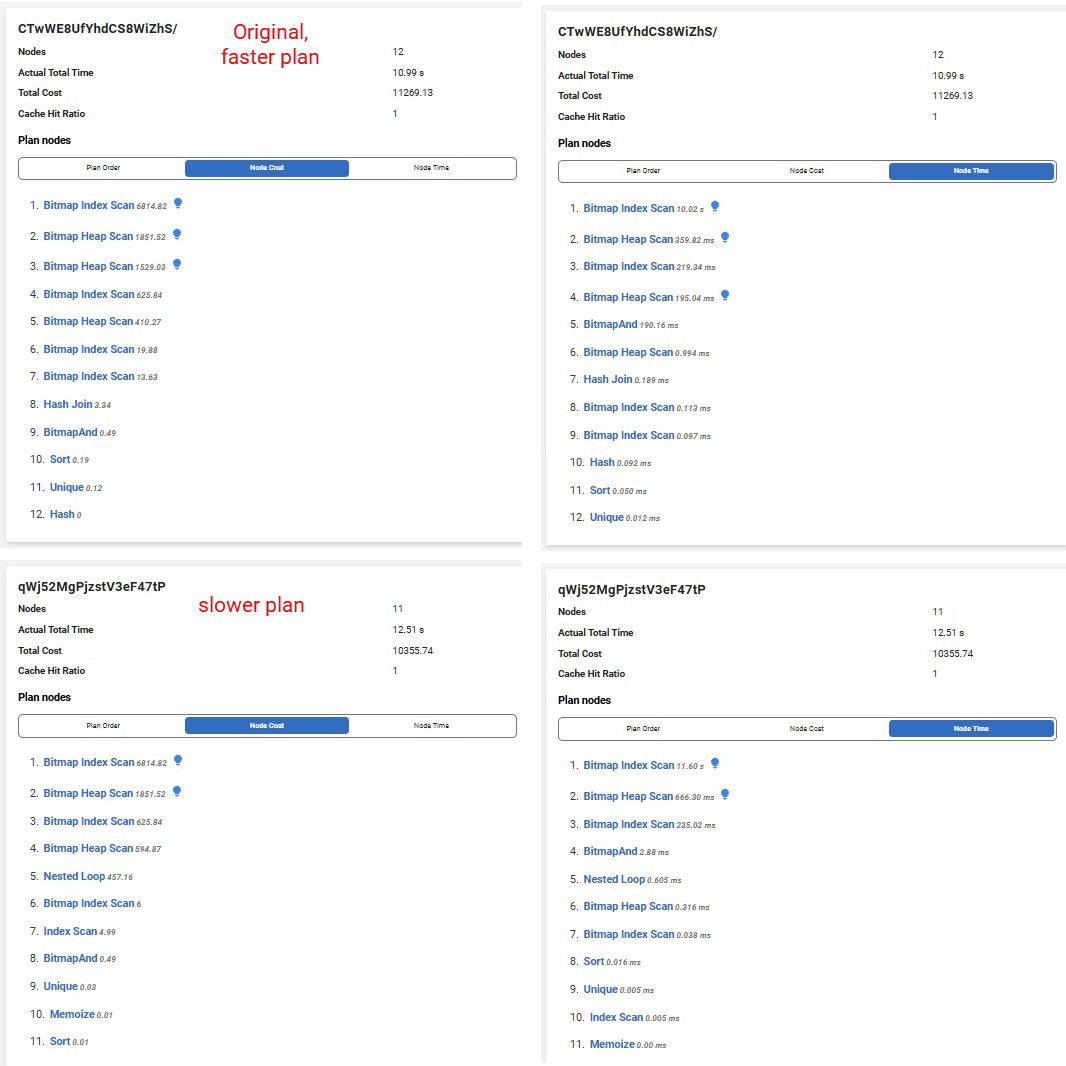
Node Cost and Node Time Tabs
Clicking into the Node Cost and Node Time tabs in the left panel reveals more detail about how the two plans differ, helping you investigate where a regression may have been introduced. The Node Cost comparison shows how PostgreSQL estimated the work would be distributed across each plan, while the Node Time comparison shows where the query spent its runtime.
In this example, the Node Time comparison suggests that most of the slowdown is concentrated in the data-access steps, with the leading Bitmap Index Scan standing out as one of the biggest contributors to the increase in Actual Total Time:
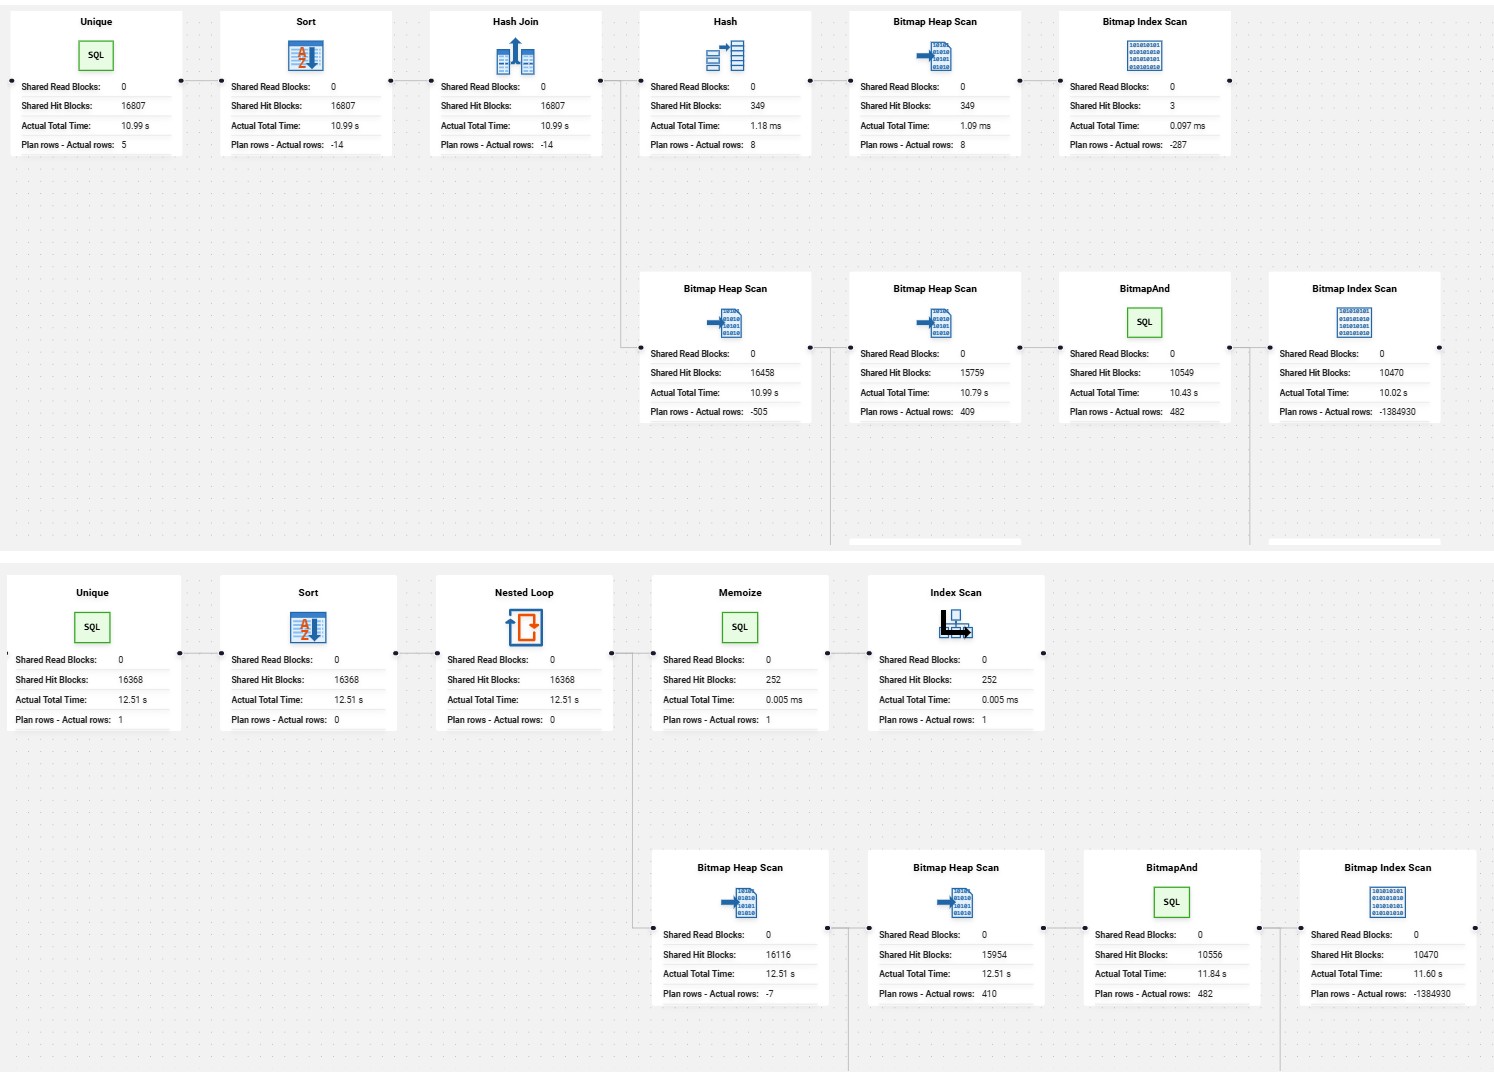
The Visual Execution Plan
Center stage in the UI belongs to the visual execution plan comparison. This side-by-side graphical representation of two or more plans gives you an at-a-glance way to assess how similar or different the chosen plans are, and to zero in on the specific step where performance diverged. For those who are less comfortable reading raw plan output, this visualization alone can be the difference between a quick answer and a long investigation.
The Bottom Line
Query Plan Compare for PostgreSQL in Redgate Monitor brings together everything you need to answer the question that lands in every DBA's inbox eventually: "What changed?" Without writing a single query against the database, you can identify exactly what shifted in an execution plan within a given time window and communicate it clearly, even to stakeholders who aren't as deep in the technical weeds. For day-to-day performance work, this is the kind of feature that quietly makes diagnosis easier.
Tools in this post
Redgate Monitor
Real-time multi-platform performance monitoring, with alerts and diagnostics
You may also like

Blog
The alerts worth your time. Resolved faster
Blog
Loading comments...